
Abstract
 samples doped with
  ,
,  , (
, ( ,
,  ), (
), ( ,
,  ), and (
 ,
,  ,
,  ) were prepared and studied. The
  5d-4f emissions from two
  sites in
  were observed. However, only one single emission band at
  was found in
  . The energy transfer from
  to
to  in
in  was demonstrated to be a multipolar interaction. It was found that
  showed no afterglow.
  showed some afterglow with a short persistence, and its afterglow could be enhanced by the incorporation of
  . The triply doped phosphor
  ,
,  ,
,  exhibited higher brightness and longer lasting time than that of
  ,
,  , which could be ascribed to more traps formed by the incorporation of
  .
.
Export citation and abstract BibTeX RIS
The blue-luminescent  ,
,  phosphor has drawn much research interest since it was first developed by Xiao and Xiao.1 Compared with previously developed aluminate materials, the silicate phosphor has more advantages with regard to chemical stability, heat stability, lower cost, and excellent weather resistance.2 However, its afterglow properties were inferior to those of aluminate materials. So it is necessary to further improve its long-lasting phosphorescence properties. So far,
  ,
,  phosphor has been extensively studied regarding its synthesis techniques,3–6 and little research has been done on improving its afterglow intensity and extending its afterglow time.
It is known that codoping is one of the most commonly used methods to make long-lasting phosphors. Usually with proper codopants, the afterglow time can be increased by a factor of 10, for example,  in
in  ,
,  .7 Recently, Song et al.8, 9 reported that by codoping the
  ,
,  with other rare earth ions such as
  and
and  , the phosphor shows higher brightness and longer persistence. Chen et al.10 obtained a similar result by doping the
  ,
,  lattice with
  .
.
 activated long-lasting phosphors have been reported by Jia et al.11, 12 and Kodama et al.13 In addition,
  is well known as an efficient sensitizer, and
  to
to  energy transfer is possible.14–16 It was reported that through energy transfer from
  to
to  ,
,  ,
,  ,
,  exhibited higher brightness and longer lasting afterglow than
  ,
,  .14
.14
In this work,  was selected and expected to enhance the long-lasting afterglow of the
  ,
,  duo to energy transfer from
  to
to  , as well as extra traps formed by the incorporation of
  .
.
Experimental
All the samples were prepared by a solid-state reaction. Analytical reagent grade  ,
,  , Mg
, Mg  ,
,  (99.99%),
  (99.99%), and
  (99.99%) were employed as reactants. Stoichiometric mixtures were ground thoroughly in an agate mortar and subsequently fired at
  for
for  in a weak reducing atmosphere.
All the samples were characterized by powder X-ray diffraction (XRD) using a Rigaku diffractometer with Ni-filtered Cu  radiation. The photoluminescence (PL) excitation and emission spectra were obtained by a FLS-
 fluorescence spectrophotometer with Xe 900 (
 xenon arc lamp) as the light source. The decay curves were recorded using a PR305 phosphorophotometer. The thermoluminescence (TL) curves were measured by a FJ-427A1 meter with a heating rate of
  . Before the measurement, the samples were irradiated by UV light
  for
for  and then were kept in a darkroom for
  . All the measurements were performed at room temperature except those for the TL curves.
Results and Discussion
Crystal structure
All the samples are characterized to be single phase by XRD. Figure 1 shows XRD patterns of select samples. All the peaks can be indexed to the phase of  (JCPDS 75-1736). No impurity phase was observed in any of the samples, clearly implying that the small amount of doped rare earth ions have almost no effect on the
  phase.
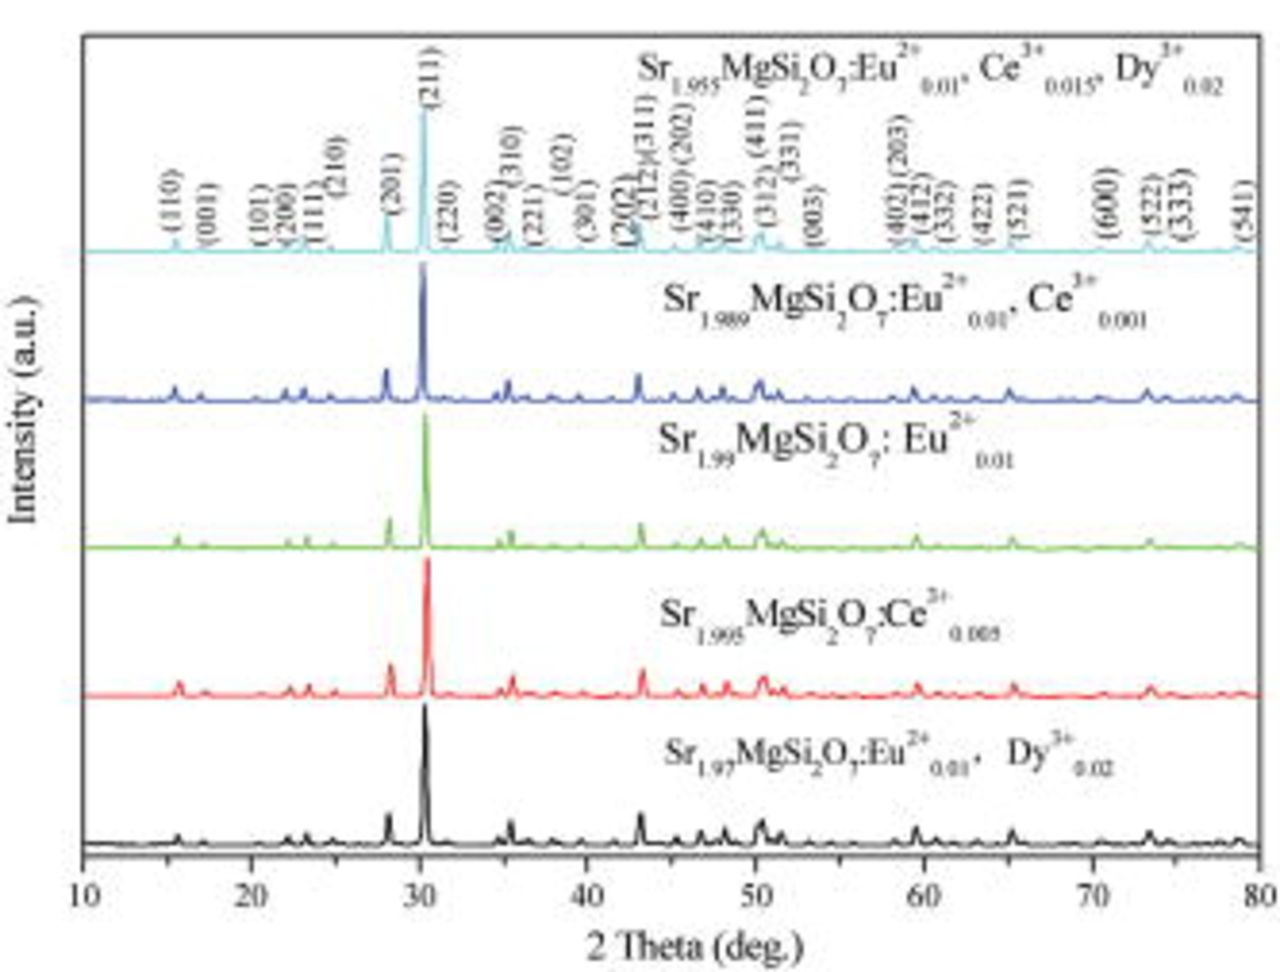
Figure 1. Powder XRD patterns of select samples.
PL properties

Figure 2 gives the excitation and emission spectra of  . The excitation spectrum mainly consists of two broad bands centered about 260 and
  which can be assigned to the
  transition of
  . Usually,
  in one specific lattice site shows two emission bands corresponding to the transition from the lowest 5d excited state to
  and
and  spin-orbit split 4f ground states with the energy difference about
  .17 The emission spectrum of
  also exhibits two bands located at
 and
and 
 . However, the energy difference
  is very different from the theoretical energy difference
  . Therefore, this spectrum is probably produced by the overlap of the emission bands from two different emission
  centers. This can be explained by the fact that in
  crystal structure the coordination number of
  can be 6 and 8,18 and the
 is expected to substitute the
 sites rather than
 or
or 
 sites in the
  host; thus,
  should also be located in two different
  sites in the host of
  . As mentioned above, when
  ions occupy only one lattice site, a doublet emission from the lowest 5d state to the
  and
and  levels of the spin orbit split 4f ground state occurs, but when
  ions enter two different lattice sites, the emission will be more complex and four emission bands should be present in theory. As shown in Fig. 2, the emission spectrum of
  can be fitted well by a sum of four Gaussian profiles with maxima at 344, 367, 395, and
  . The energy difference is
  for the doublet emission at 344 and
  and
and  for the doublet emission at 395 and
  , which is in accord with the usual energy difference between the
 state. Therefore, we attribute the bands at 344 and
  to the emission from one
  site and the bands at 395 and
  to the emission from another
  site.
site.
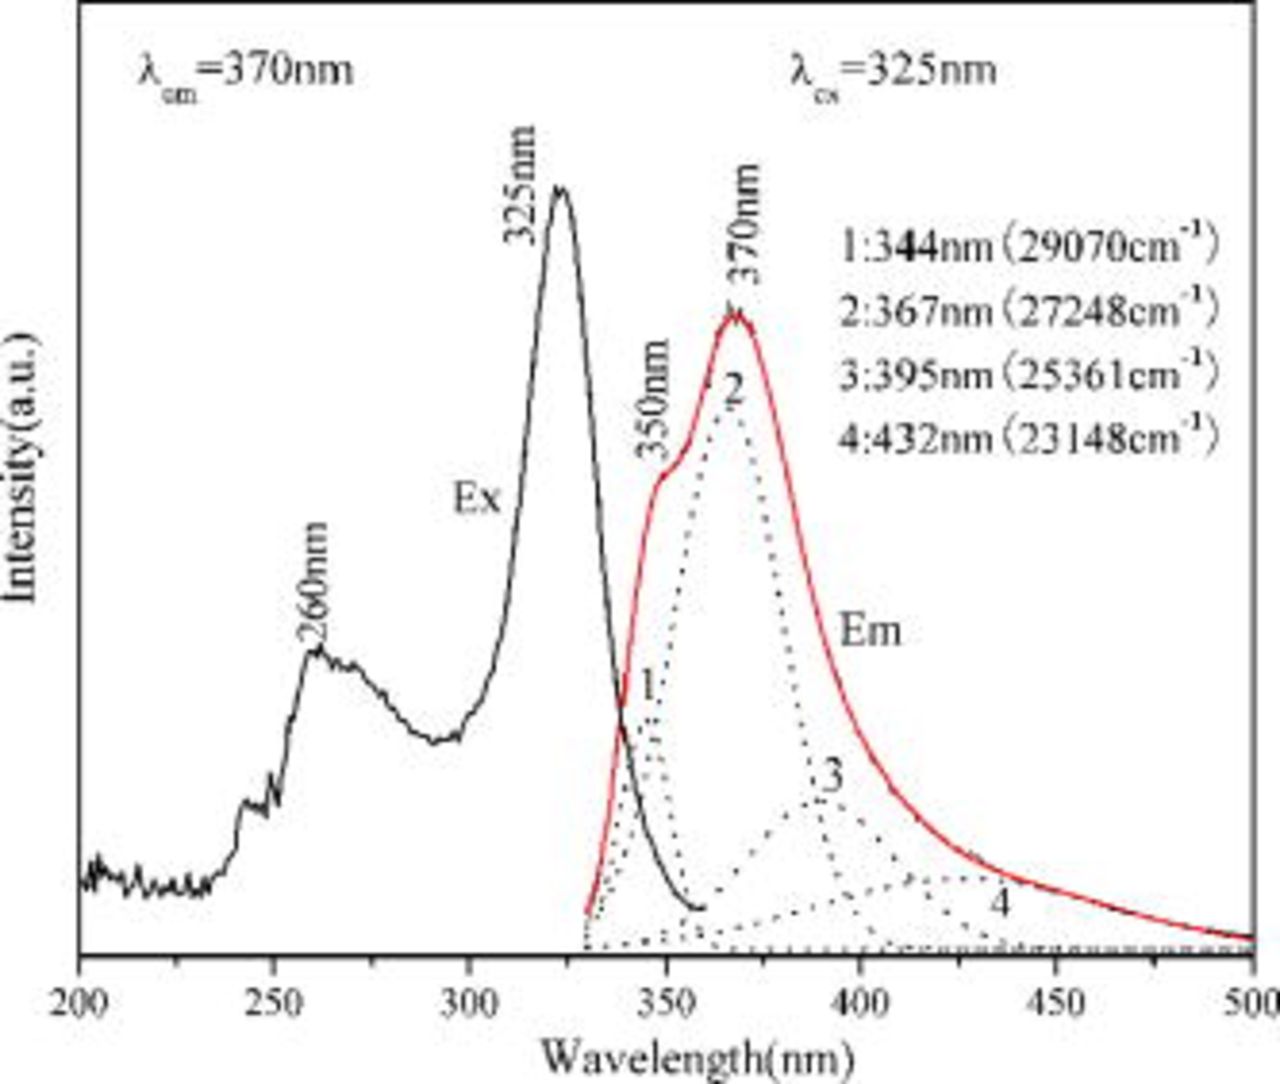
Figure 2. Excitation and emission spectra of the  . The dotted lines denote the Gaussian fit of the emission spectrum.
In order to further determine the crystallographic sites of  in
in  , we calculated the position of the lower d-band edge of
  by the following empirical relation19

where  is the position in energy of the lowest d-band edge, and
  for
for  ,
,  is the valence of the active ion,
  is the coordination number, ea is the electron affinity of the anion (2.5 for
  ),20 and
  is the radius of the cation
  replaced by the active cation. The values of the parameters and the calculated position of emission are listed in Table I. As can be seen, when the coordination number is 8, the calculated emission peak is
  and is in good accord with the fitted value of
  . When the coordination number is 6, the calculated value is
  and is also in good agreement with the fitted value of
  . So we can further assign the bands at 344 and
  to the emission from
  in the octa-coordinated
  sites and the bands at 395 and
  to the emission from
  in the hexa-coordinated sites.
Table I. Calculated values of position of the lower d-band edge for  .
.

|
 (nm) (nm) |
 
|
 (nm) (nm) |
|---|---|---|---|
| 8 | 0.140 | 29,312 | 337 |
| 6 | 0.132 | 23,984 | 411 |
 and ,
and ,

Figure 3a illustrates the excitation and emission spectra of  . Single-band
  emission as well as a broad excitation band from
  are observed in this work. These results are in good agreement with the previous literature reports.1, 2, 5 Because there are two different
  sites in
  , it should be two different
  sites and two distinct
  emissions should be observed. The two
  emissions, located at 406 and
  , were found in the work of Fei et al. at room temperature18 and in the work of Jia et al. at
  .21 It is suggested that energy transfer between
  at inequivalent sites takes place in
  .21 The energy transfer is very efficient due to a higher doping concentration so that the emission at the high-energy site is totally quenched in this work. Similar results were observed in
  .22
.22
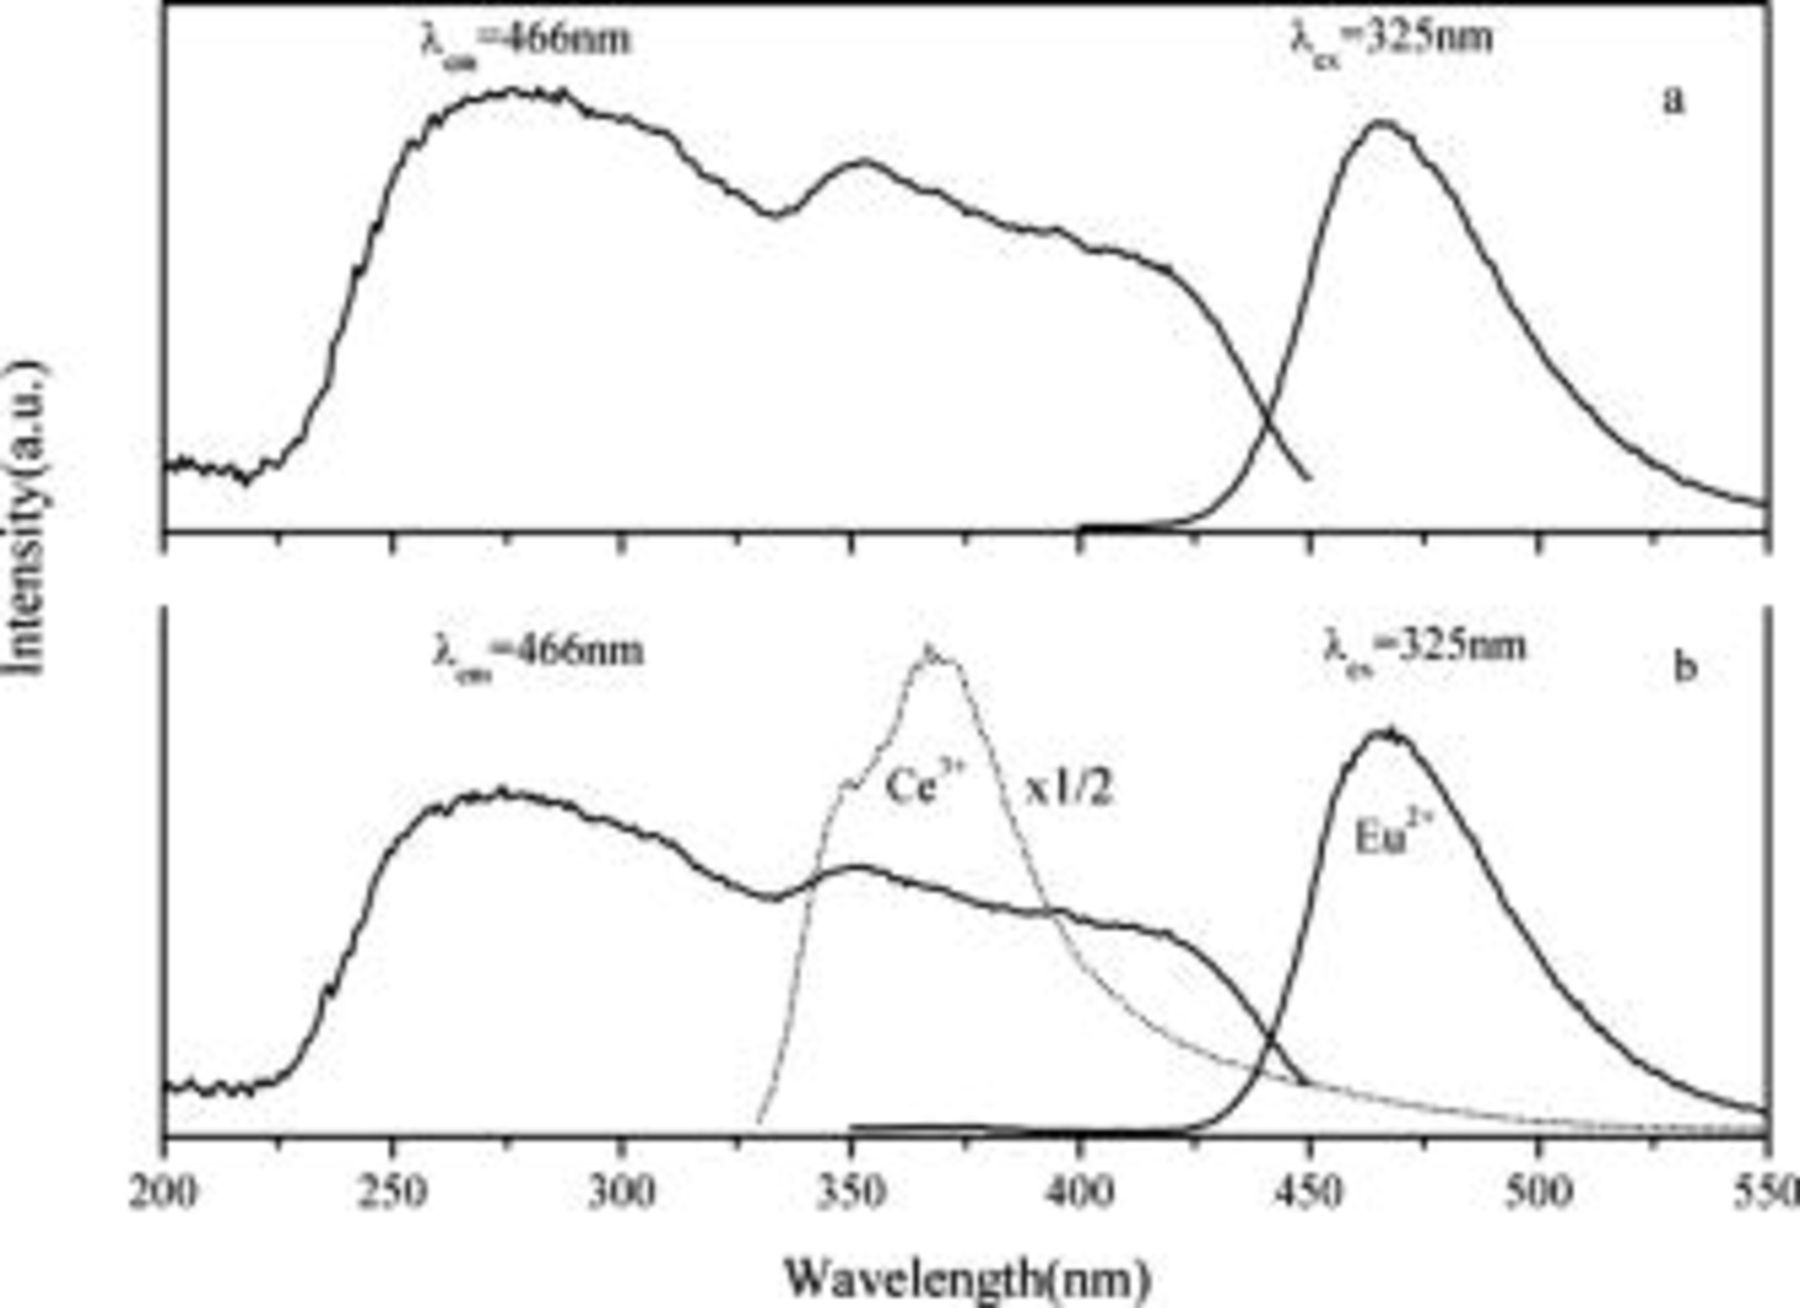
Figure 3. Excitation and emission spectra of  (a),
(a),  ,
,  (b), and emission spectrum of
  (dash-dot line).
Figure 3b exhibits the excitation and emission spectra of  ,
,  . One can observe that the band position and shapes of the excitation and emission spectra are the same as the single-doped
  sample, but the emission intensity of
  is greatly enhanced. In addition, the emission of
  disappears. This implies that
  can transfer its absorbed energy to
  . The emission spectrum of
  is also given in order to compare with that of the
  ,
,  codoped sample. It is found that, when measured under the same conditions, the emission intensity of
  is more than twice that of
  . This can further suggest that the energy transfer from
  to
to  is efficient in
  .
.
Generally, energy transfer occurs only when the emission band of the sensitizer overlaps spectrally with the absorption band of the activator. Spectral overlap has been observed in  emission and
  excitation in
  , which is shown in Fig. 4. It can be seen that the overlap of
  emission and
  excitation is almost 100%. The inset of Fig. 4 shows the schematic of the energy level system, which describes the energy transfer from
  to
to  . According to Dexter's theory, the critical distance of energy transfer from
  to
to  is defined as the distance for which the probability of transfers equals the probability of radiative emission of
  .23, 24 The critical distance of energy transfer from a sensitizer to an activator is given by
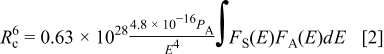
where  is the oscillator strength of the transition, which is taken as 0.01 for
  ions, and
  is the critical distance,
  represents the spectral overlap between the normalized shapes of
  emission
  and
and  excitation
  , estimated at about
  , and
, and  (in eV) is the maximum energy of spectral overlap. From Eq. 2 the value of critical constant is calculated as
  . Thus, it can be concluded that the energy transfer from
  to
to  in
in  occurs by multipolar interaction.
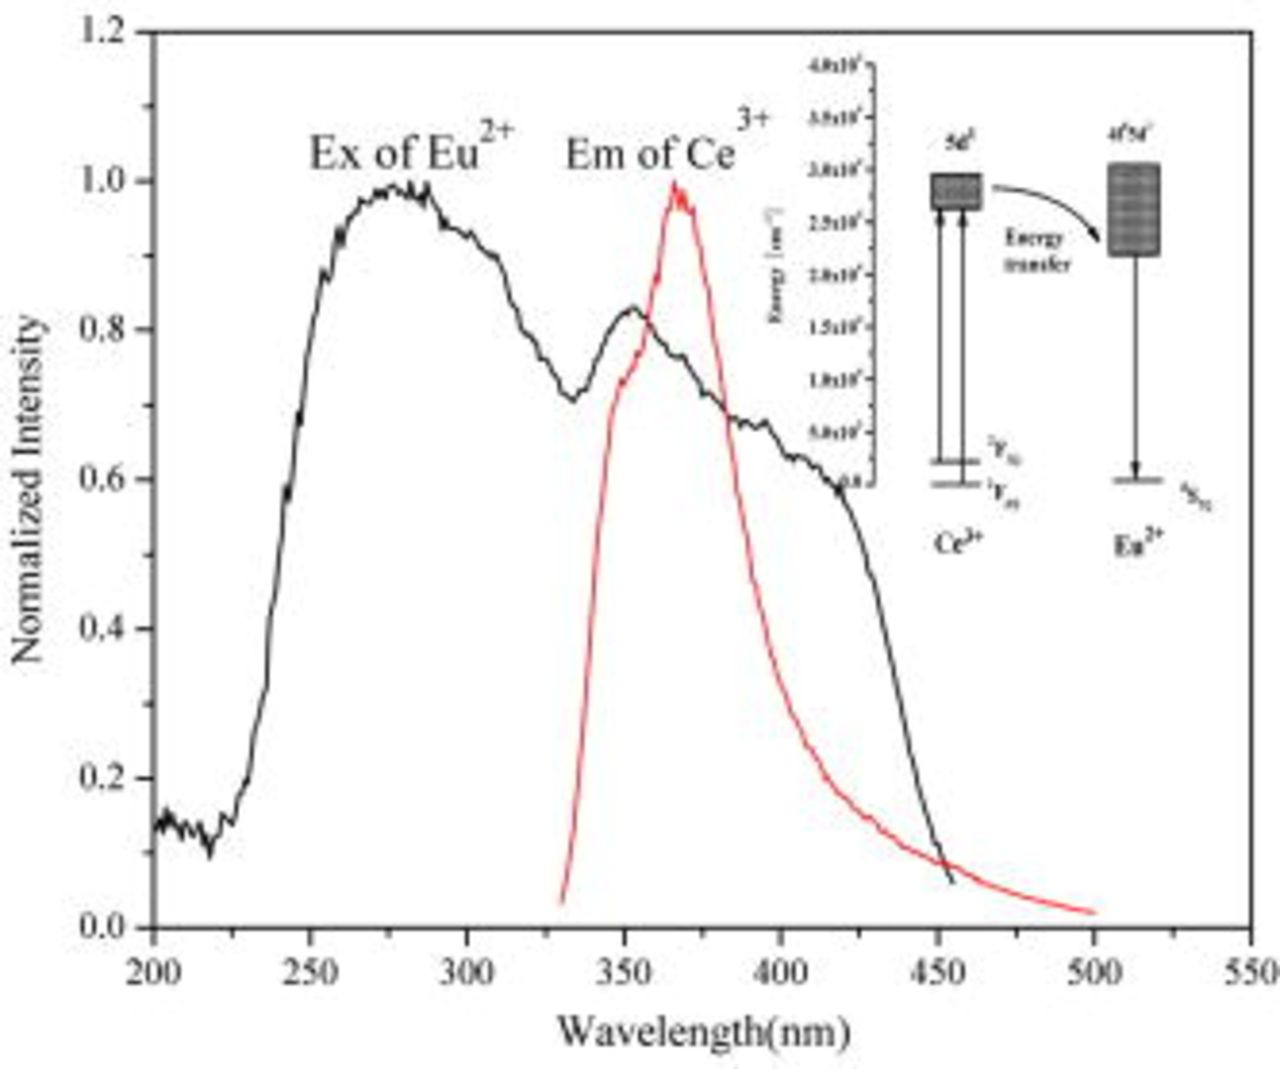
Figure 4. Excitation spectrum of  and emission spectrum of
  . Inset shows the schematic of the energy level system describing energy transfer in the case of
  ,
,  .
.
, ,


The emission spectrum of  ,
,  ,
,  under
under  excitation is shown in Fig. 5. The emission band centered at
  originates from the typical
  transition of
  . Weak
  emission centered at
  appears in the emission spectrum and the emission is very weak compared to the
  emission, suggesting efficient energy transfer from
  to
to  . In our work, the special
  emission is not observed, indicating that
  might serve as the hole or electron traps and energy transporting media.25
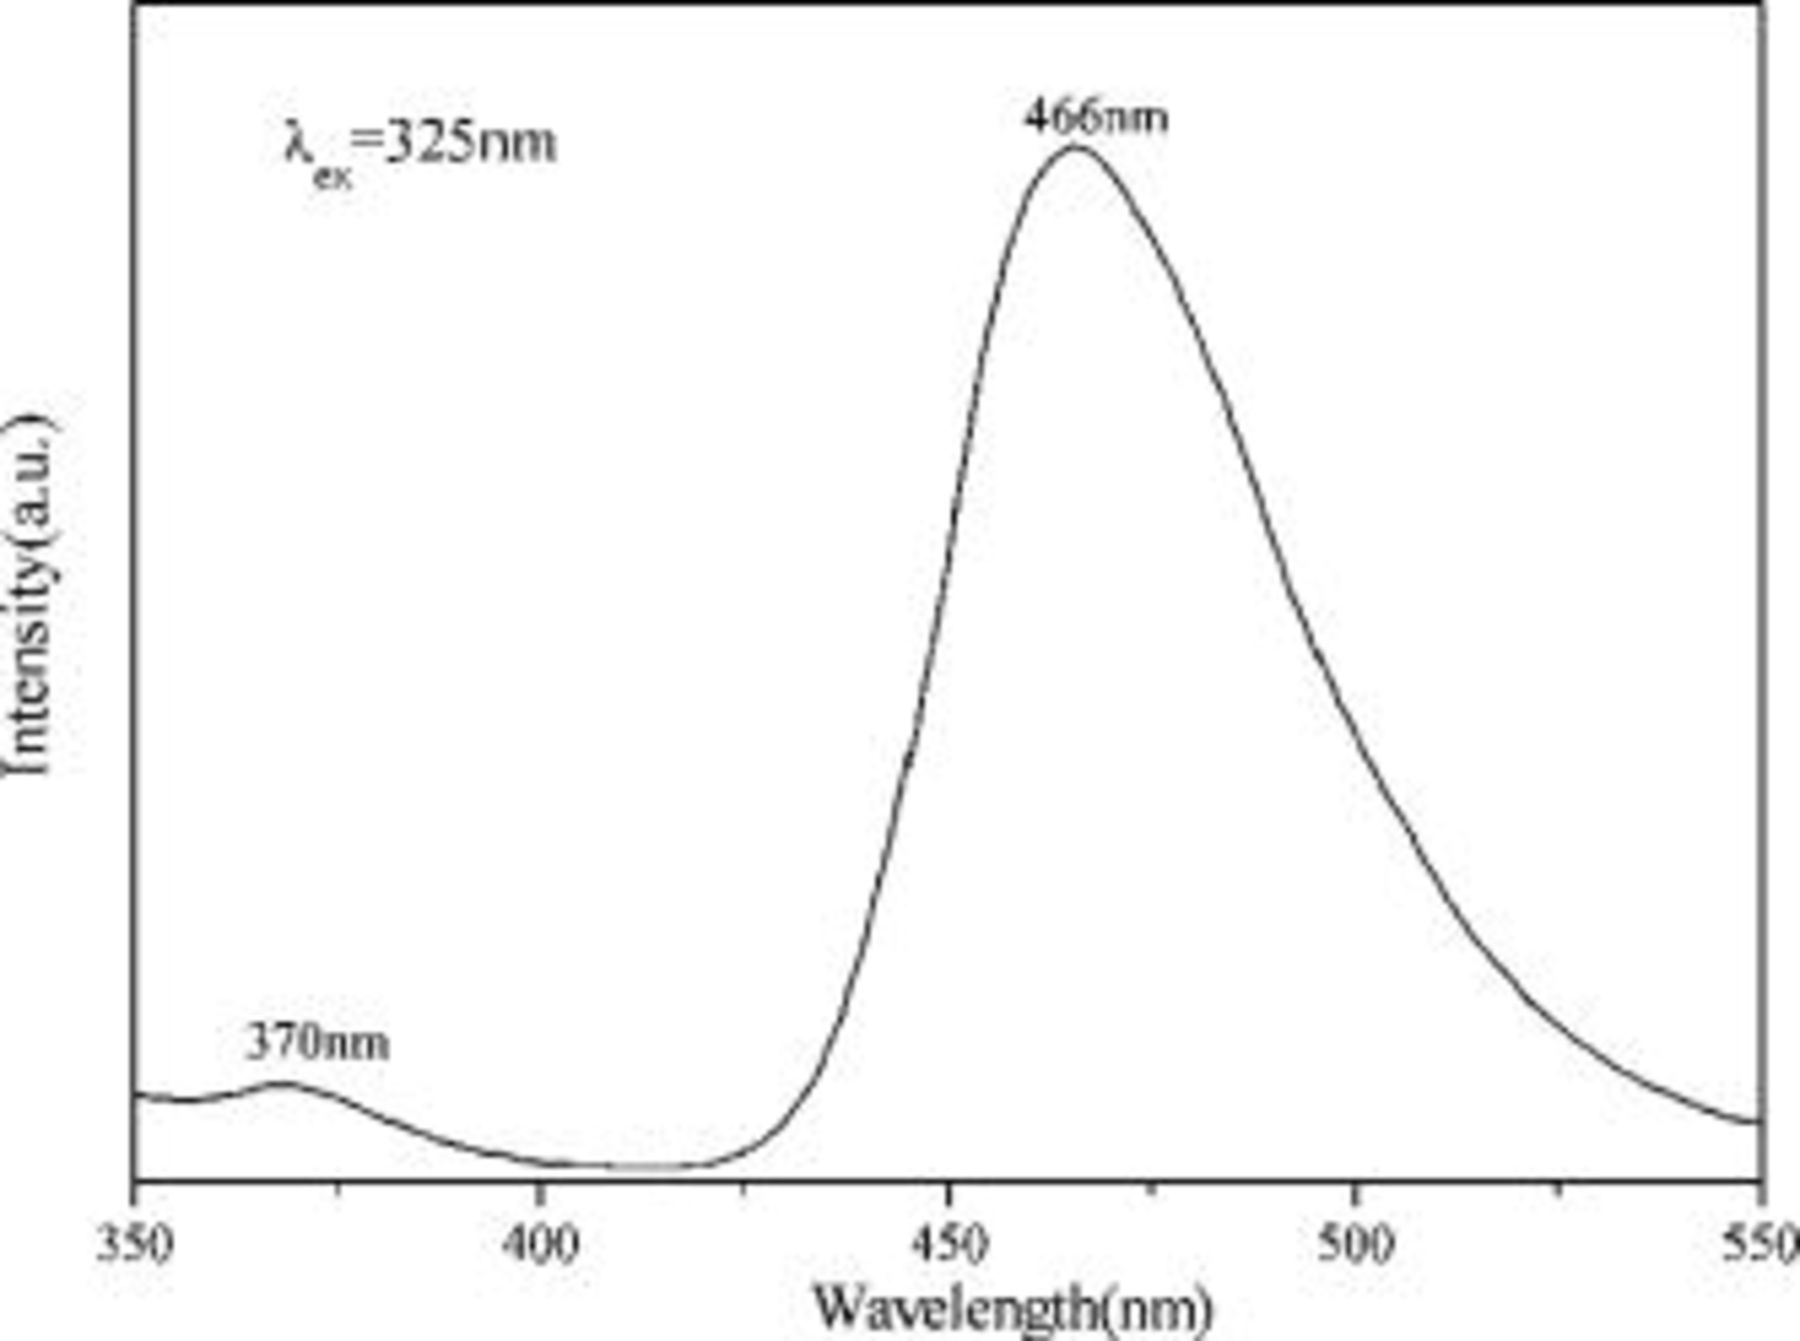
Figure 5. Emission spectrum of  ,
,  ,
,  .
.
Afterglow properties
Figure 6 presents decay curves of the phosphors  and
and  ,
,  . It is found that
  shows some afterglow with a short persistence, and its afterglow can be enhanced by codoping
  . However,
  phosphor shows no afterglow.
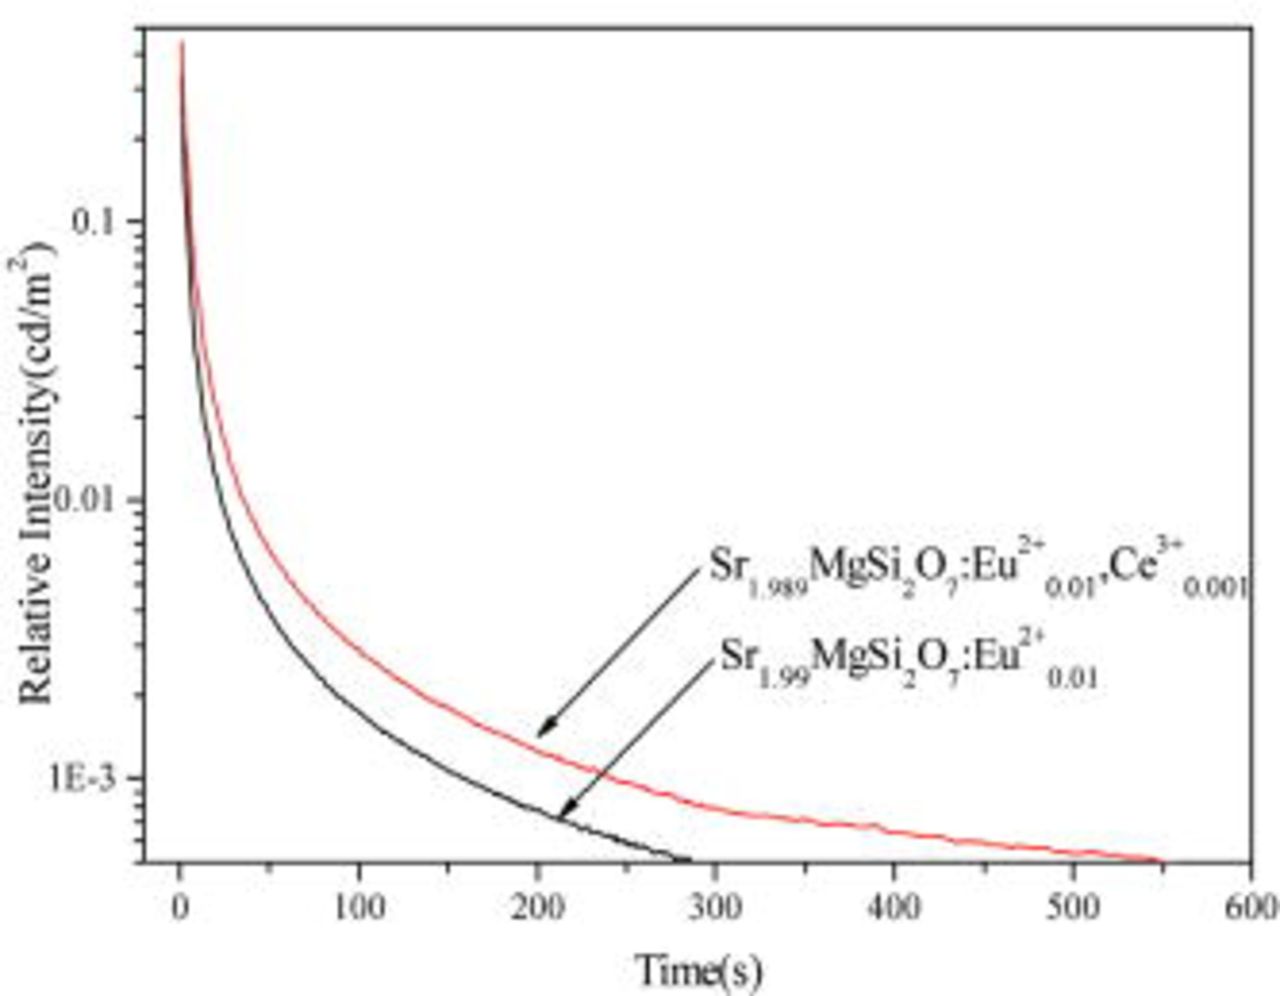
Figure 6. Decay curves of the  and
and  ,
,  phosphors.
The decay curves of  ,
,  phosphors with different
  doping contents are shown in Fig. 7. All of them show a rapid decay and subsequent long-lasting phosphorescence. The afterglow intensity increases with increasing
  doping content at fixed
  content
  and
and 
 , but when the doping content is over 0.005 the afterglow intensity begins to decrease. When
  doping content is 0.005, the afterglow intensity and afterglow time of the
  ,
,  phosphor is greatly enhanced (inset).
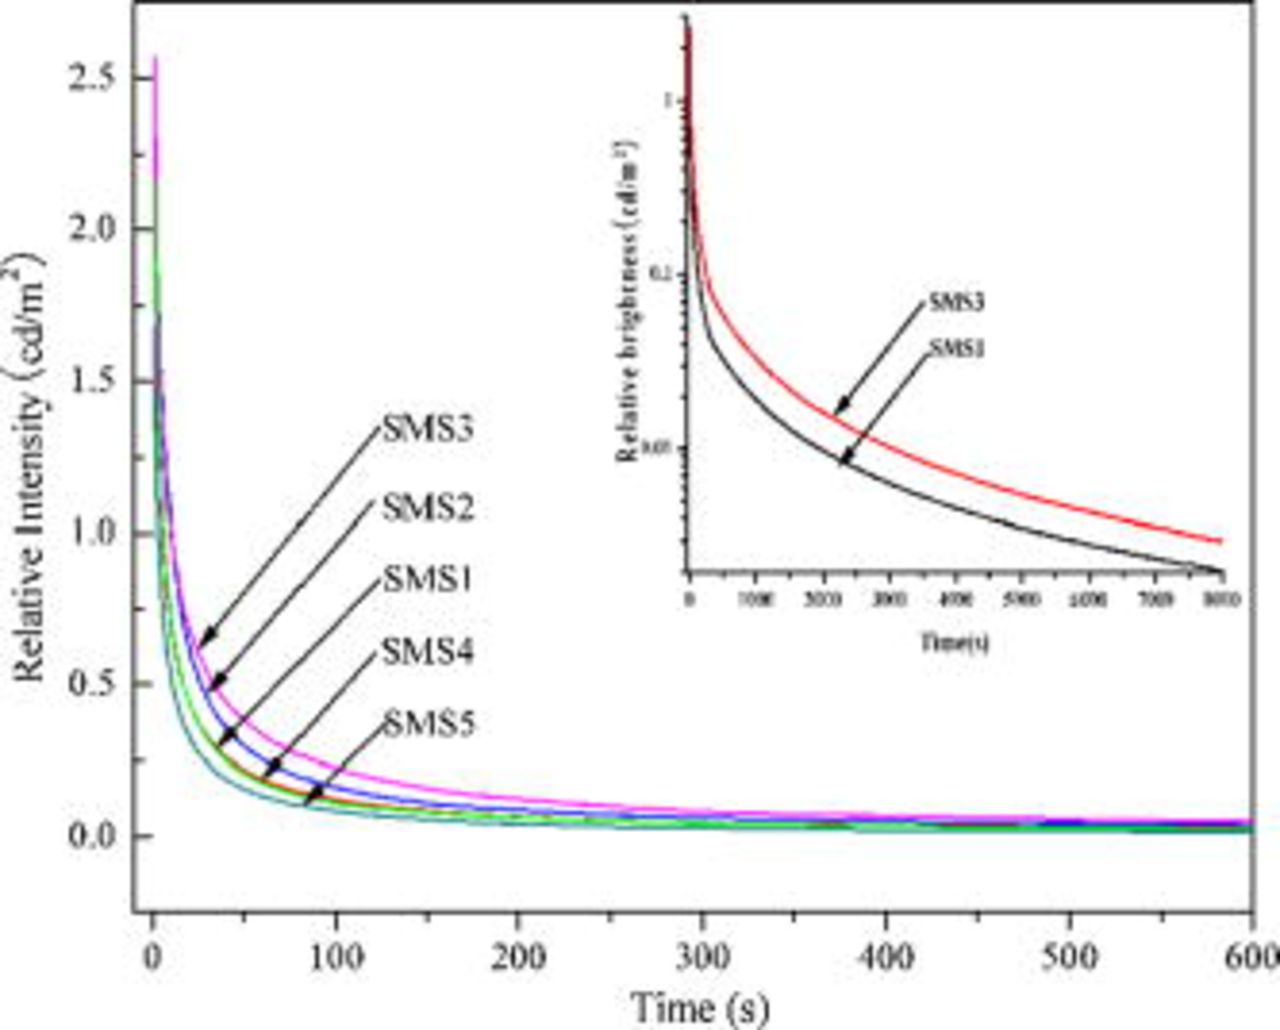
Figure 7. Decay curves of the  ,
,  , and
, and  phosphors, where
  is 0.00, 0.001, 0.005, 0.01, and 0.015, corresponding to SMS1, SMS2, SMS3, SMS4, and SMS5, respectively.
TL properties
To investigate the difference in the afterglow characteristics of  ,
,  and
and  ,
,  ,
,  , Th curves of the samples were conducted and are shown in Fig. 8. Only one TL peak located at
  appears for both samples above room temperature, indicating that the incorporation of
  does not generate new traps and produces similar defects-related traps as
  did. The TL intensity of the
  ,
,  ,
,  phosphor is much stronger in comparison to the
  ,
,  codoped phosphor.
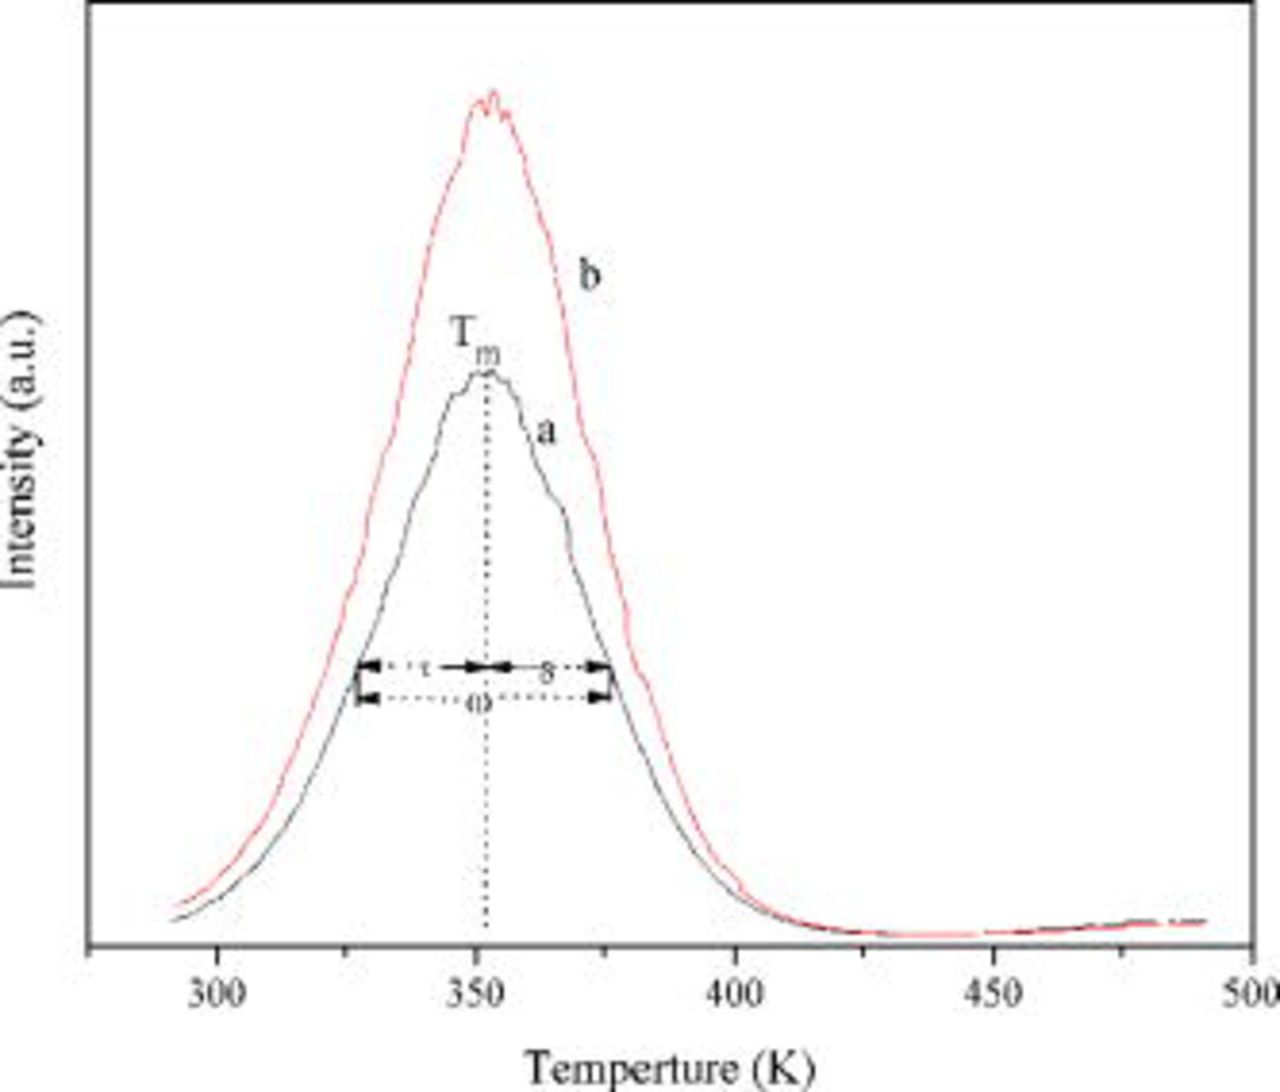
Figure 8. TL curves of  ,
,  (a) and
  ,
,  ,
,  (b).
(b).
The trap depth  can be calculated from the glow-peak parameters by the following equation given by Chen26
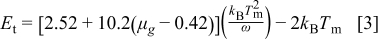
where ω, the full width at half maximum, is known as the shape parameter and defined as  , with δ being the high-temperature half-width and τ the low-temperature half-width. The asymmetric glow-peak shape is defined by the asymmetry parameter
  ,
,  is Boltzmann's constant, and
  is the temperature of the TL peaks.
Table II gives the TL parameters and calculated results of the trap depth. It can be seen from Table II that the trap depth of  ,
,  is about
  and the trap depth of
  ,
,  ,
,  is about
  . It is reported that a suitable trap depth
  is essential for phosphors to show long persistence,27 so the trap depth of both the above phosphors is suitable for a long afterglow. Therefore, we conclude that the difference in afterglow property comes mainly from the difference in trap density. It is well known that a higher trap density normally leads to a higher afterglow intensity and longer persistence, and the intensity of the TL peaks is proportional to the trap density. Usually when a trivalent ion sits in a divalent ion site some defects will be created, producing defect-related traps that then result in a long afterglow.28 In our case, the incorporation of
  produces similar defect-related traps as
  did. Furthermore, extra traps are created by the incorporation of
  , so that the TL intensity of the
  ,
,  ,
,  is much stronger than that of
  ,
,  , indicating the former phosphor shows a better afterglow than the latter. This result is in good agreement with the afterglow curves in Fig. 7.
Table II. TL parameters of  ,
,  (SMS-EN) and
  ,
,  ,
,  (SMS-ENC).
| Glow peak shape parameters | TL parameters | |||||
|---|---|---|---|---|---|---|
| Composition |
 (K) (K) | τ | δ | ω |

|
 (eV) (eV) |
| SMS-EN | 352 | 24 | 23 | 47 | 0.49 | 0.65 |
| SMS-ENC | 352 | 23 | 23 | 46 | 0.50 | 0.71 |
Conclusion
 ,
,  ,
,  ,
,  ,
,  ,
,  , and
, and  ,
,  ,
,  were synthesized by solid-state reaction.
  showed an intense UV emission at around
  and it had no afterglow. An efficient energy transfer from
  to
to  was found in
  .
.  ,
,  ,
,  exhibited a better afterglow than that of
  ,
,  , which is mainly due to higher trap density formed by the
  codoping in the host.
Acknowledgment
This work was supported by the Key Science and Technology Project of Gansu Province (grant no. 2GS064-A52-036-03).
Lanzhou University assisted in meeting the publication costs of this article.