
Abstract
The electrochemical cycling and storage characteristics of  and
and  nanoparticle-coated
  cathode materials
  were compared at room temperature and
  between 3 and
  . The doped cathodes showed degraded electrochemical performance at room temperature compared to the uncoated cathode. The first discharge capacities of the uncoated and the doped cathodes were 186 and
  , respectively. The doped cathodes showed
  after 30 cycles, while the uncoated cathode showed
  after 50 cycles at a
  rate.
rate.  and
and  -coated
  showed discharge capacities of 179 and
  , respectively, and hadsignificantly improved capacity retention, showing 133 and
  , respectively, after 50 cycles. After storage at
  , in the electrolytes using
  charged electrodes, the doped cathodes showed both greatly decreased side reactions with the electrolytes and formation of
  and
and  phases from Li and Co dissolution. However, the coated cathodes did not show either structural transformation into the
  and
and  phases or side reactions with the electrolytes.
Export citation and abstract BibTeX RIS
At present,  powders are the most widely used cathode material in Li-ion batteries for mobile electronics, which alter the charge cutoff voltage from
  (vs graphite) (
 vs lithium metal) to
  (vs graphite) (
 vs lithium metal). By increasing the cutoff voltage, the energy density of the cell can be increased by
  . However, due to side reactions with the electrolytes on the particle surface and continuous structural destruction from the dissolution of Li and Co ions, the capacity of
  rapidly the fades. Previous studies have focused on improvements of electrochemical performances at room temperature using doped
  1, 2 or coatings.3–14 Here, coatings may be an attractive method for improving such problems, as it applies only to final
  materials. For doped cathodes, depending on the dopants (M) in
  and the value of
  , the specific capacity varies. In addition, uniform substitution of dopants into the Co
  sites in the
  are difficult to achieve in mass-production processes that use solid-state reactions.
Only a small number of storage studies at elevated temperatures (e.g.,  ) have been reported15, 17 thus far.
  coatings
  have been reported to be effective in improving not only thermal stability but also electrochemical properties, depending on the M factor.15 In a
  coating, Fe ions were observed to be dissolved into the electrolytes during
  storage. For an
  coating, despite improving the structural stability at
  , it has been observed that the capacity decreases at a 1C rate as the electrode density increases.16 Recently, the authors investigated a
 coating on
  and
and  cathodes, which resulted in better rate capabilities compared to an
  coating at higher C rates.16, 17 However, thus far, a systematic comparison of coated and doped cathodes in terms of cycling and structural stability at
  has not been reported.
In this study, a comparison of  and
and  coatings on
  vs doped
  (
( and Zn) cathodes is made regarding the electrochemical properties at room temperature and the structural stability when in storage at
  after charging at
  in electrolytes.
Experimental
 was prepared by stoichiometric mixing of
  (99.99%, average particle size
  ) and
) and  and firing at
  for
for  .
.  (
( and Mg) was prepared by stoichiometric mixing of
  or
or  with
with  by dry milling at
  for
for  . The mixture was then thoroughly mixed with
  by dry milling at
  , followed by firing at
  for
for  . The cooled powders were remixed and fired at
  for
for  . The average particle size of
  uncoated and doped
  were used for the electrochemical tests (Brunaner–Emmett–Teller surface area of the samples was
  ). For scientific accuracy, same uncoated
  was used for coatings. Inductively coupled plasma-mass spectroscopy (ICP-MS) results of lithium stoichiometry
  in the uncoated
  showed 1.01. To prepare the coating solution,
  of Mg or Zn nitrates and
  of
of  were dissolved in
  of distilled water, and
  particles that were pink in color instantly precipitated in the solution, which was stirred for
  at pH
at pH  . This coating concentration was a
  coating concentration (the weight of cathode was fixed at
  ). For instance, a
  coating concentration was a coating concentration that used
  of zinc nitrate and
  of
of  per
per  of cathode powders. The coated cathodes were annealed at
  for
for  in air. For the storage test at
  , the charged cathodes at
  were dissembled from coin-type half cells in a glove box and were immersed in electrolyte and tightly sealed in vials. The vials were kept at
  for 1 day and cooled to room temperature.
The field-emission transmission electron microscope (FE-TEM) (JEOL 2100F operating at  ) samples were prepared by evaporation of the dispersed particles in acetone or hexane on carbon-coated copper grids. Powder X-ray diffraction (XRD) measurements were carried out using a Rigaku D/Max2000 with a Cu target tube. ICP-MS (ICPS-1000IV, Shimadzu) was used to determine the metal contents. The electrochemical properties were tested in a coin-type 2016R cell with lithium metal as the anode. The cathode consisted of
  active material,
  Super P carbon black, and
  polyvinylidene fluoride binder. The electrolyte for the coin-type half-cells (2016 type) was
 with ethylene carbonate/diethylene carbonate/ethyl-methyl carbonate
  (Cheil Ind. Korea). The capacity and capacity retention were measured to be between 3 and
  at a rate of 0.1, 0.2, 0.5, and 1C
  . Specific capacities of the cathodes were calculated using only the active material. The HF level in the electrolyte solution was determined by gas chromatography.
Results and Discussion
Figure 1 shows XRD patterns of the coated  and doped
  (
( and Zn) powders. Characteristic lines of
  structure can be observed. Single-phase oxide was obtained, for which Miller indexes
  are indexed for a hexagonal setting. For the
  powders, the lattice constants
  and
and  values increase while those of the coated cathodes are identical to those of uncoated sample, as shown in Table I. The increase in lattice constants in the doped cathodes may be due to the larger size of
  and
and  compared with that of the
  ions
ions  ,
,  ,
,  . Figure 2 shows TEM images of the
  (
( and Mg) and the coated samples. The doped samples show typical lattice fringes of the (003) plane corresponding to
  . In the case of the
  -coated sample, its low-magnification image (Fig. 2c) does not show any coating layer, but its high-resolution image (2d) shows an amorphous coating layer with a thickness of
  . It was found that, depending on the metal (M) in
  , the crystallinity and coating thickness varied. For instance, for the
  -coated sample, the
  coating layer became olivine
  as a result of a reaction with Li in
  during the annealing process.16, 17 For the
  coating, the coating layer was amorphous and its thickness was
  to
to  .6 For the
  -coated sample, nanoparticles
  were coated on the
  (Fig. 2e), and the amorphous coating layer that consisted of many pores and rough surfaces with a coating thickness of
  was also observed (Fig. 2f). In contrast to
  coating that exhibited the disappearance of the coating layer due to its complete reaction with the bulk surface,
  -coated
  cathodes (
 and Mg) showed the clearly distinguishable coating layer on the cathode surface, consisting of amorphous phase. Thus, it is believed that
  nanoparticles had a partial reaction of bulk
  during an annealing process at
  .
.
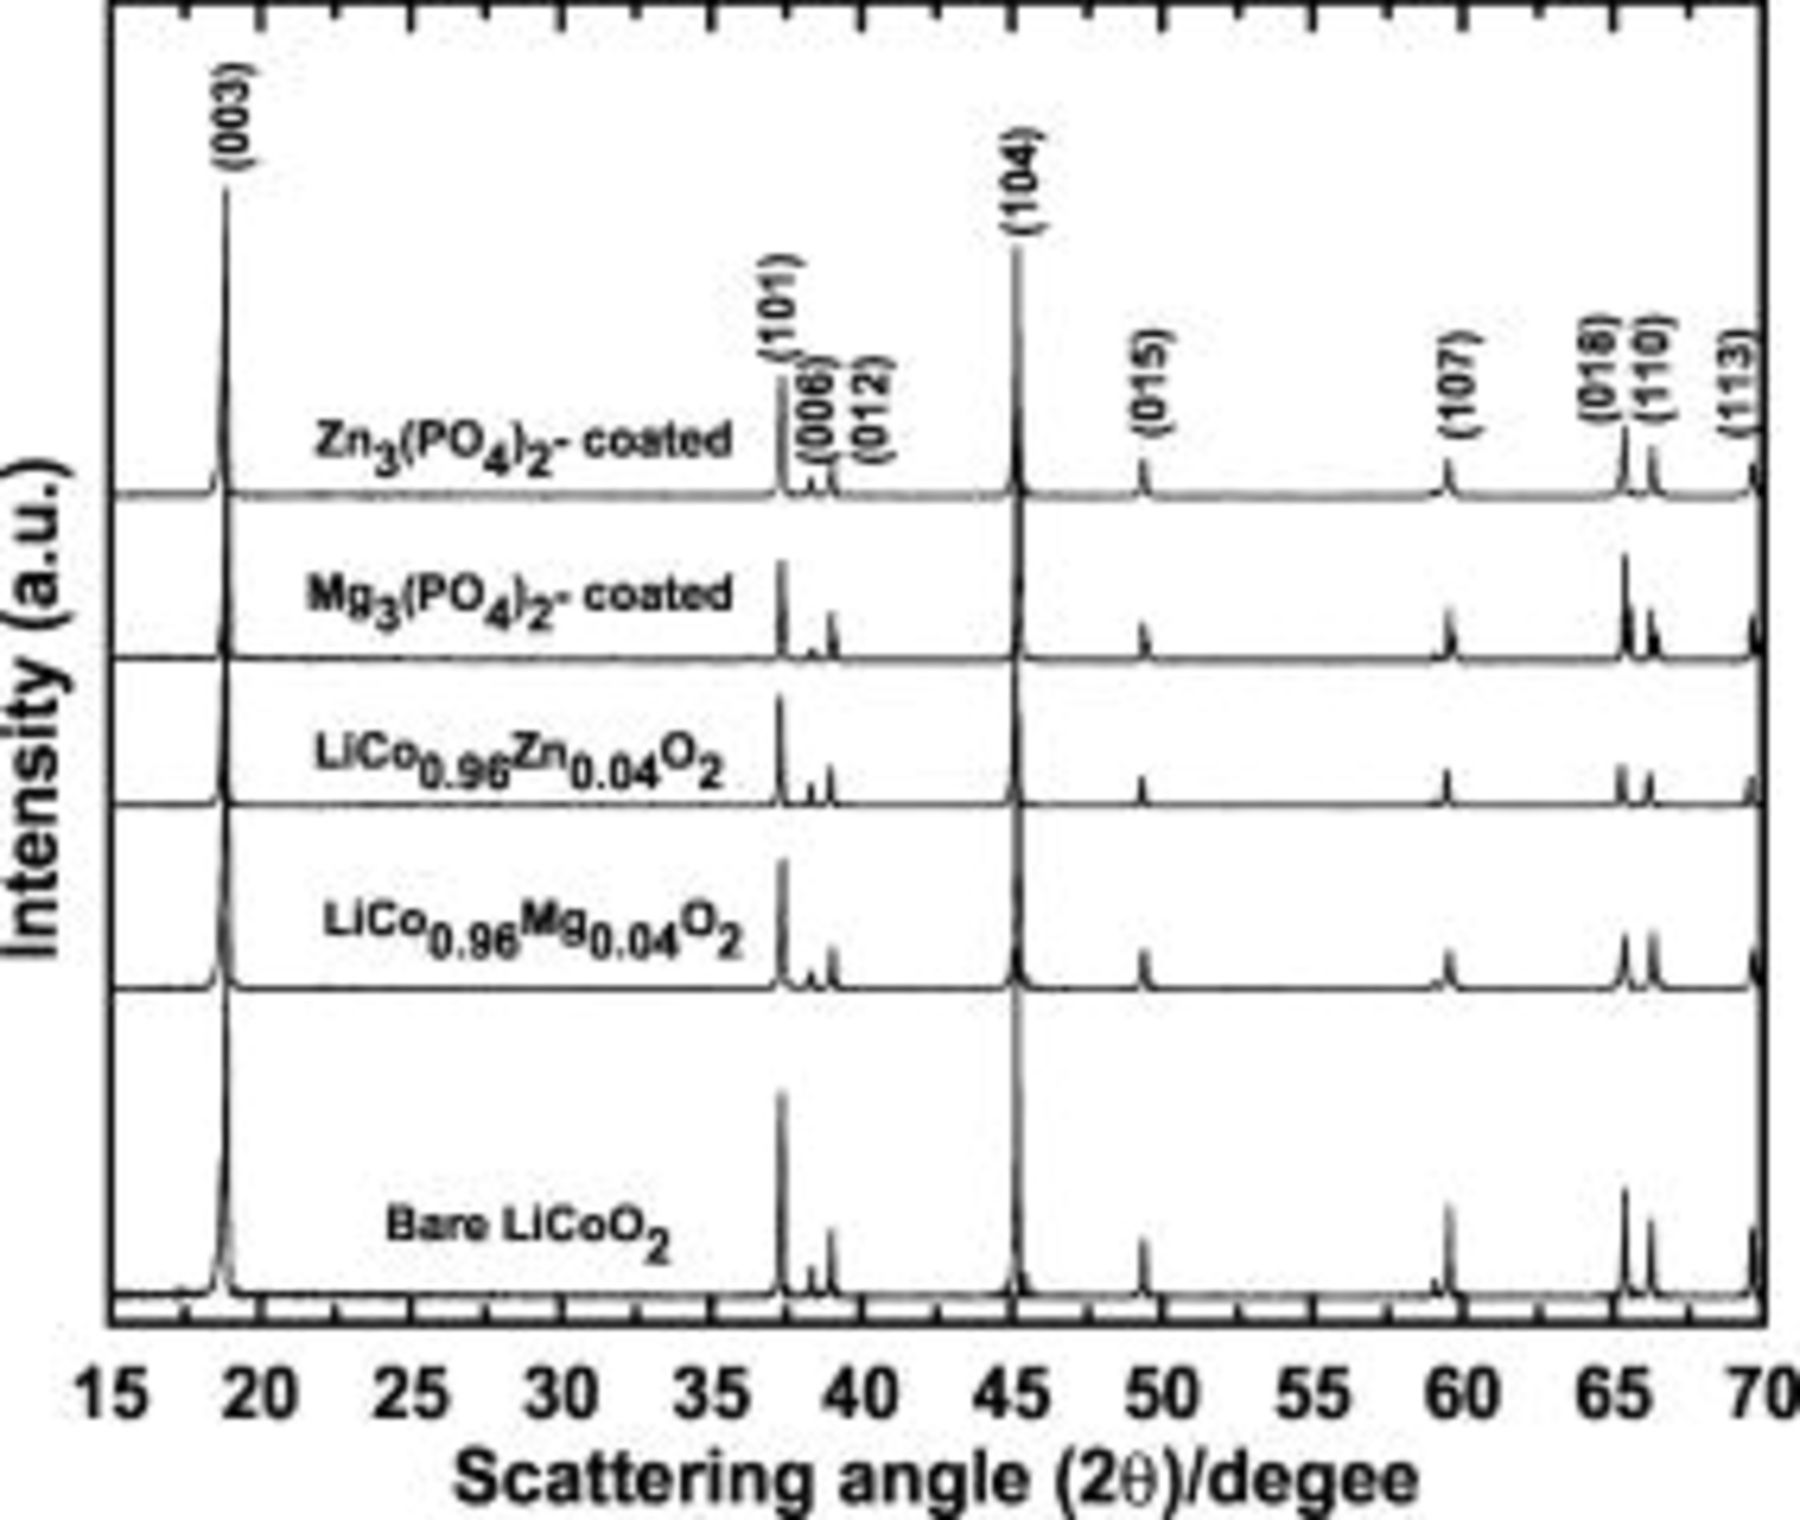
Figure 1. XRD patterns of the  (
( and Mg) and
  and
and  nanoparticle-coated
  powders.
Table I. XRD lattice constants  and
and  and
and  ratio for
  (
( and Mg) and
  and
and  nanoparticles-coated
  .
.
| Material |

|

|

|
|---|---|---|---|

| 2.816 | 14.034 | 4.984 |

| 2.819 | 14.059 | 4.987 |

| 2.819 | 14.060 | 4.988 |
 coating coating | 2.816 | 14.034 | 4.984 |
 coating coating | 2.816 | 14.035 | 4.984 |
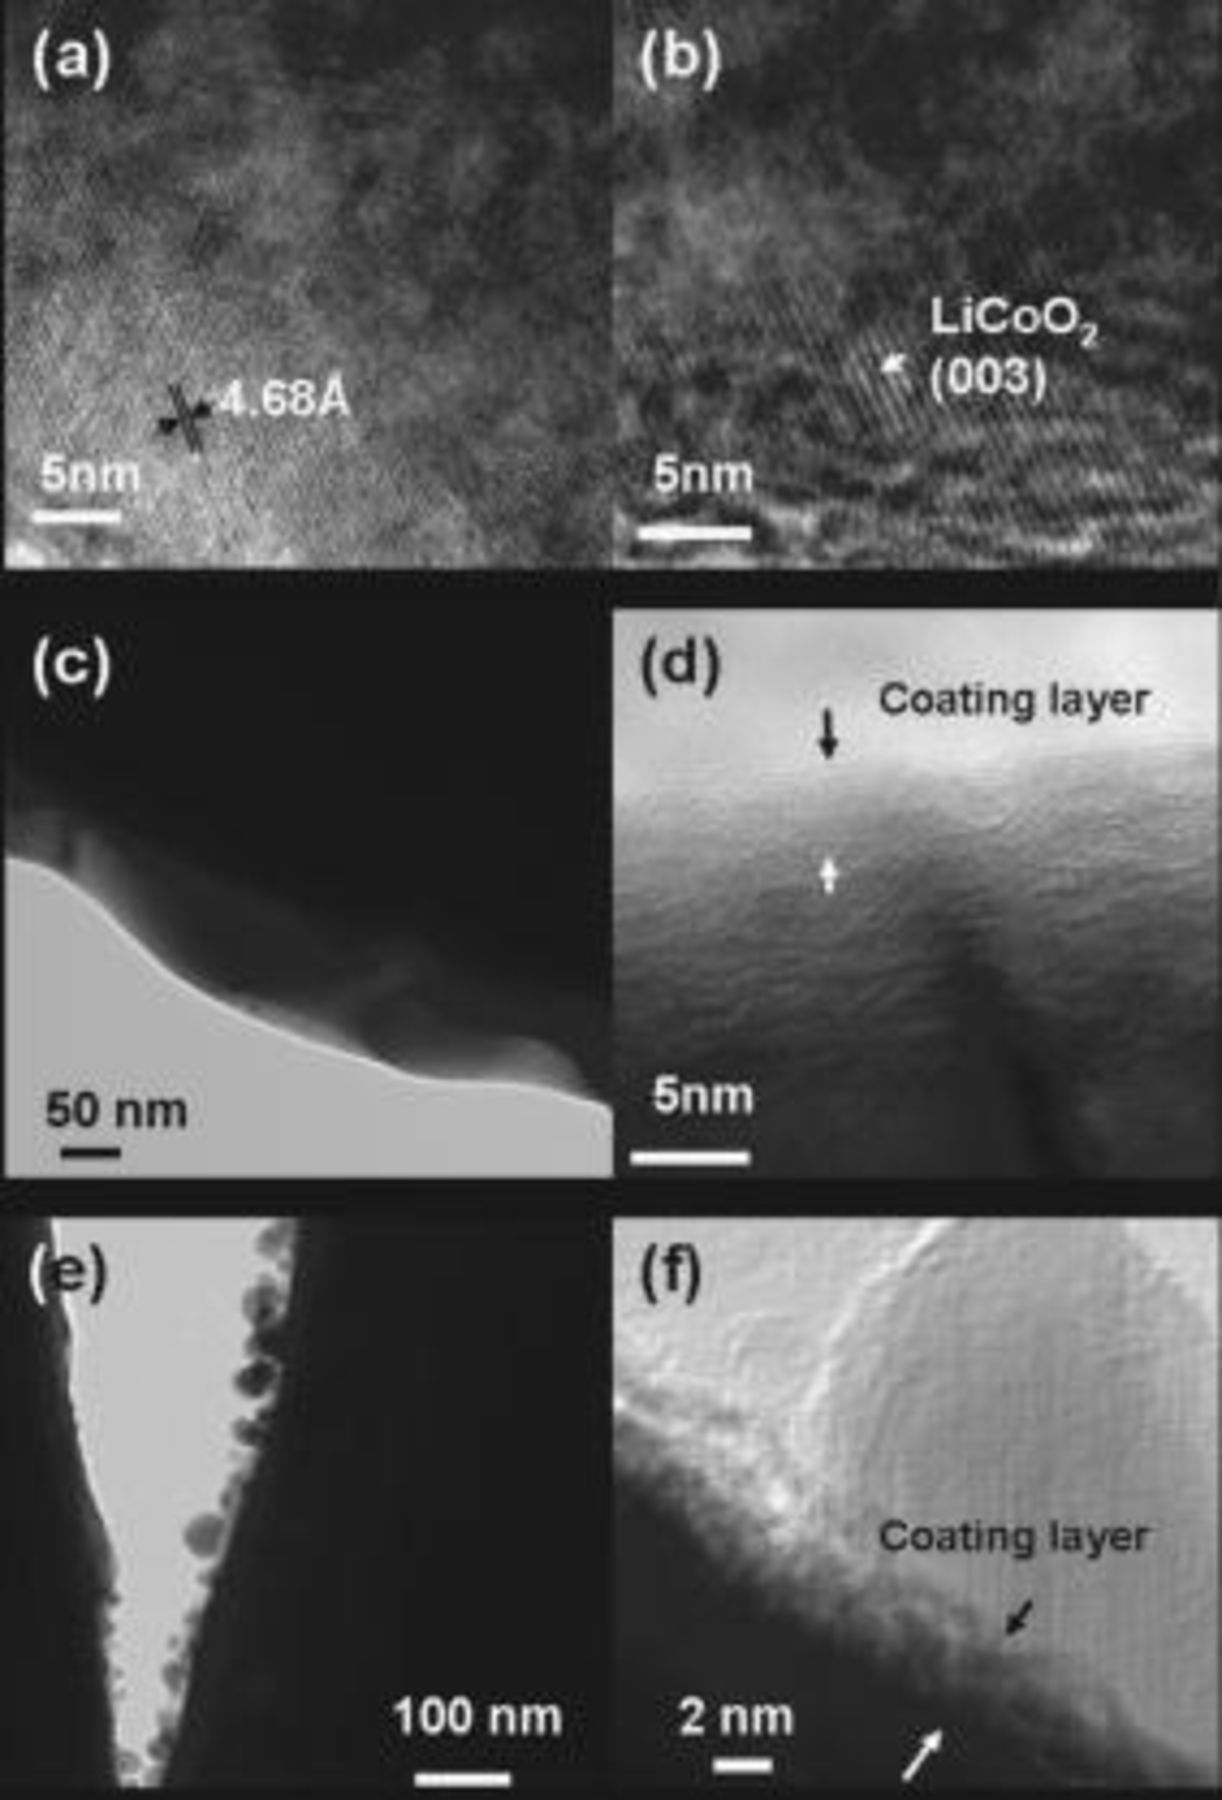
Figure 2. TEM images of the (a)  and (b)
  cathode particles (c and d)
  nanoparticle-coated
  particle [(d) is a magnified image of (c)] and (e and f)
  nanoparticle-coated
  particle [(f) is a magnified image of (e)].
Figure 3 shows the charge and discharge curves of the uncoated and doped cathodes for each first cycle at 0.1, 0.2, 0.5, and 1C rates  and after 30 or 50 cycles in coin-type half cells. For an uncoated cathode, the first charge and discharge capacities are 190 and
  , respectively. However, for the Mg-doped cathode, the first charge capacity is similar to that of uncoated cathode at
  , but its discharge capacity decreases to
  . The Zn-doped cathode shows charge and discharge capacities of 188 and
  , respectively. A decrease in the discharge capacities of the doped cathodes is associated with a decrease in the concentration of active
  ions and
  ions substituted into Co sites, leading to the creation of an equal number of
  ions for the charge balance. Both
  and
and  exhibit a capacity retention rate of 57% after only 30 cycles, compared with the first discharge capacity at 1C. This retention value is inferior to that of the uncoated cathode with capacity retention of 63% after 50 cycles.
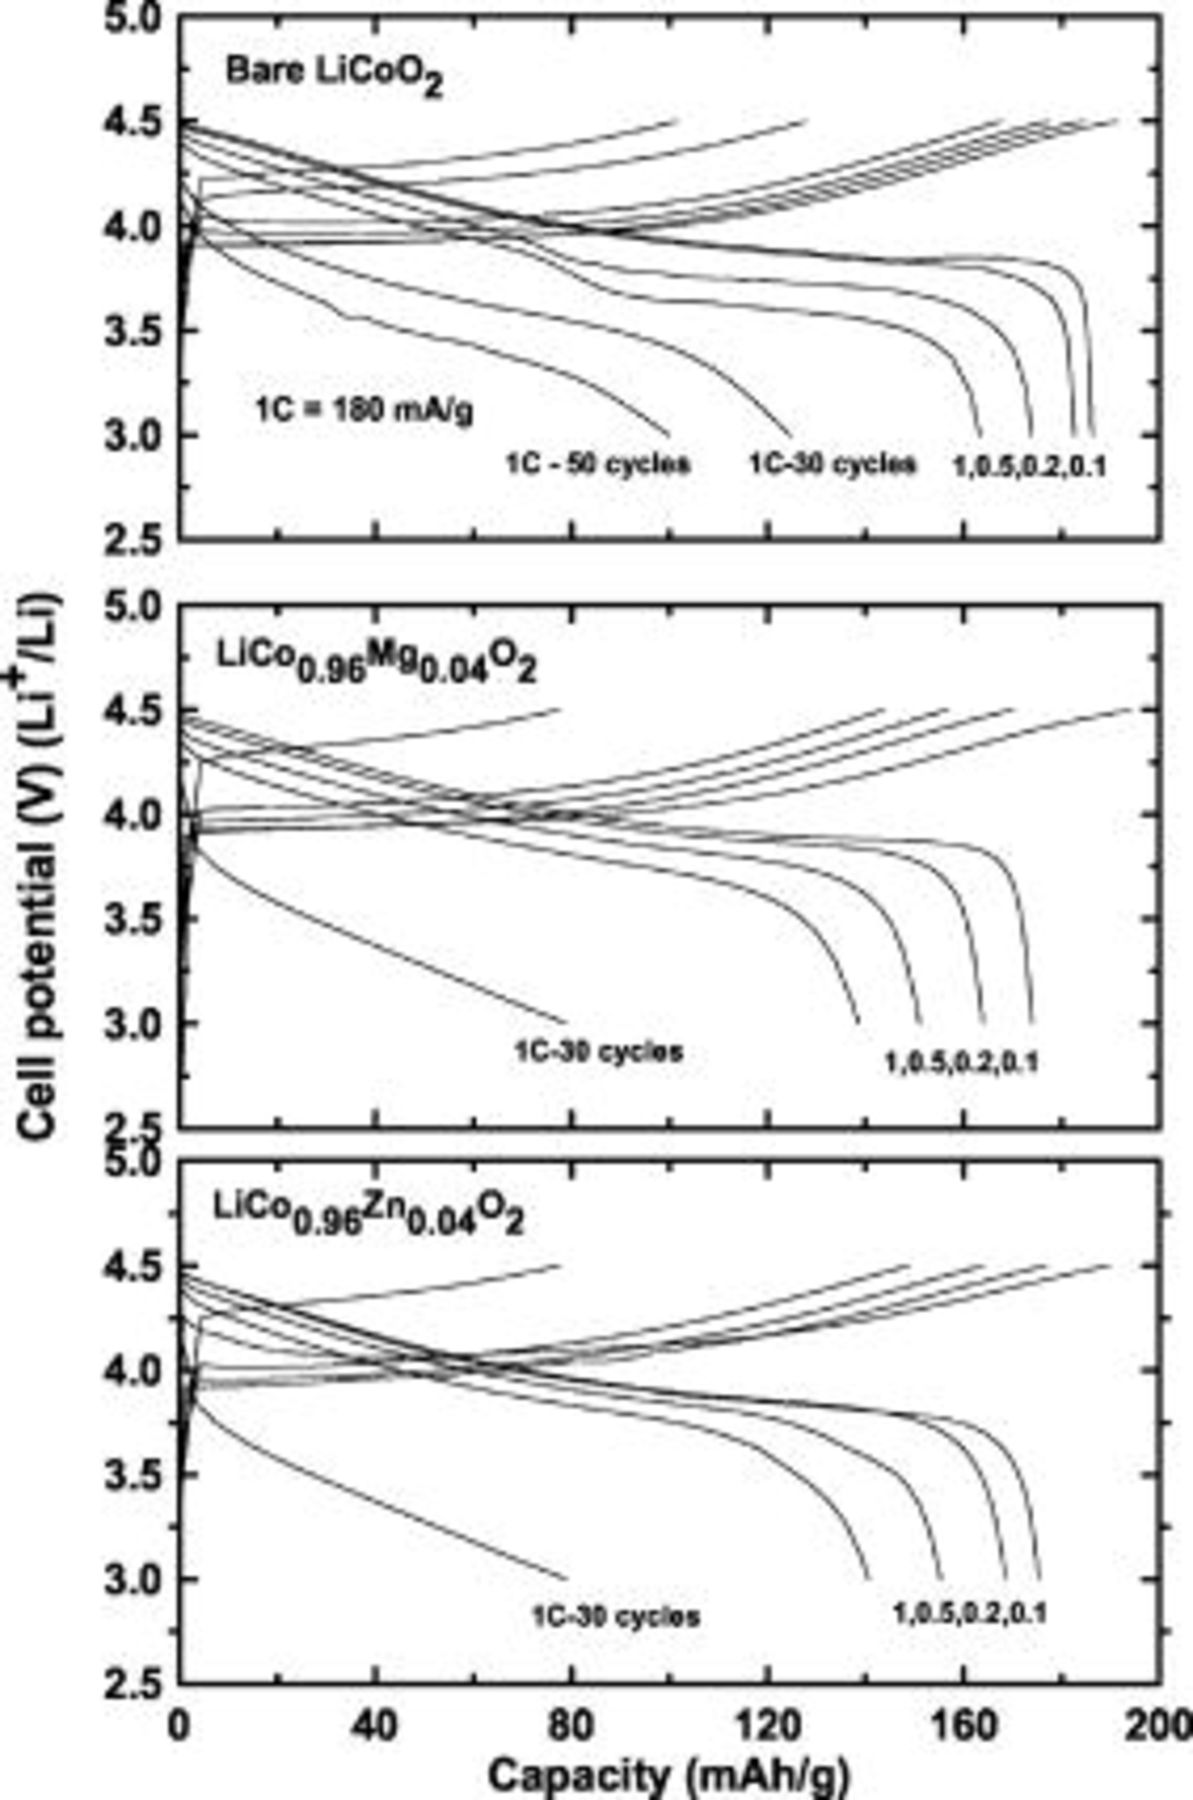
Figure 3. Plots of the cycling curves of coin-type half cells containing uncoated and  (
( and Mg) cathodes between 3 and
  at different C rates from 0.1 to 1C
  and after 30 and 50 cycles at a 1C rate. The same C rates were used during the charge and discharge processes.
The  and
and  -coated samples (
 coating concentration) show first discharge capacities of 178 and
  , respectively, as shown in Fig. 4. Differential voltage profiles for the uncoated 3, and
 -coated cathodes were added in Fig. 5. The presence of the plateaus between 4 and
  , indicative of order/disorder phase transition,18 depends on the coating concentration, and only the
  coated sample shows the plateau. Our previous study on the
  coating concentration effect on
  also showed a similar result.19 At this time, we do not know the detailed mechanism for such a phenomenon but doubt it is related to Li stoichiometry difference near the cathode surface. ICP-MS results of lithium stoichiometry
  in the uncoated
  showed 1.01. Pereira et al. reported that order–disorder reactions disappeared when the Li stoichimetry
  was
was 

 .20 Accordingly, higher
  coating concentration may induce the increased difference in Li concentration at the surface and inward, leading to more developed plateaus.
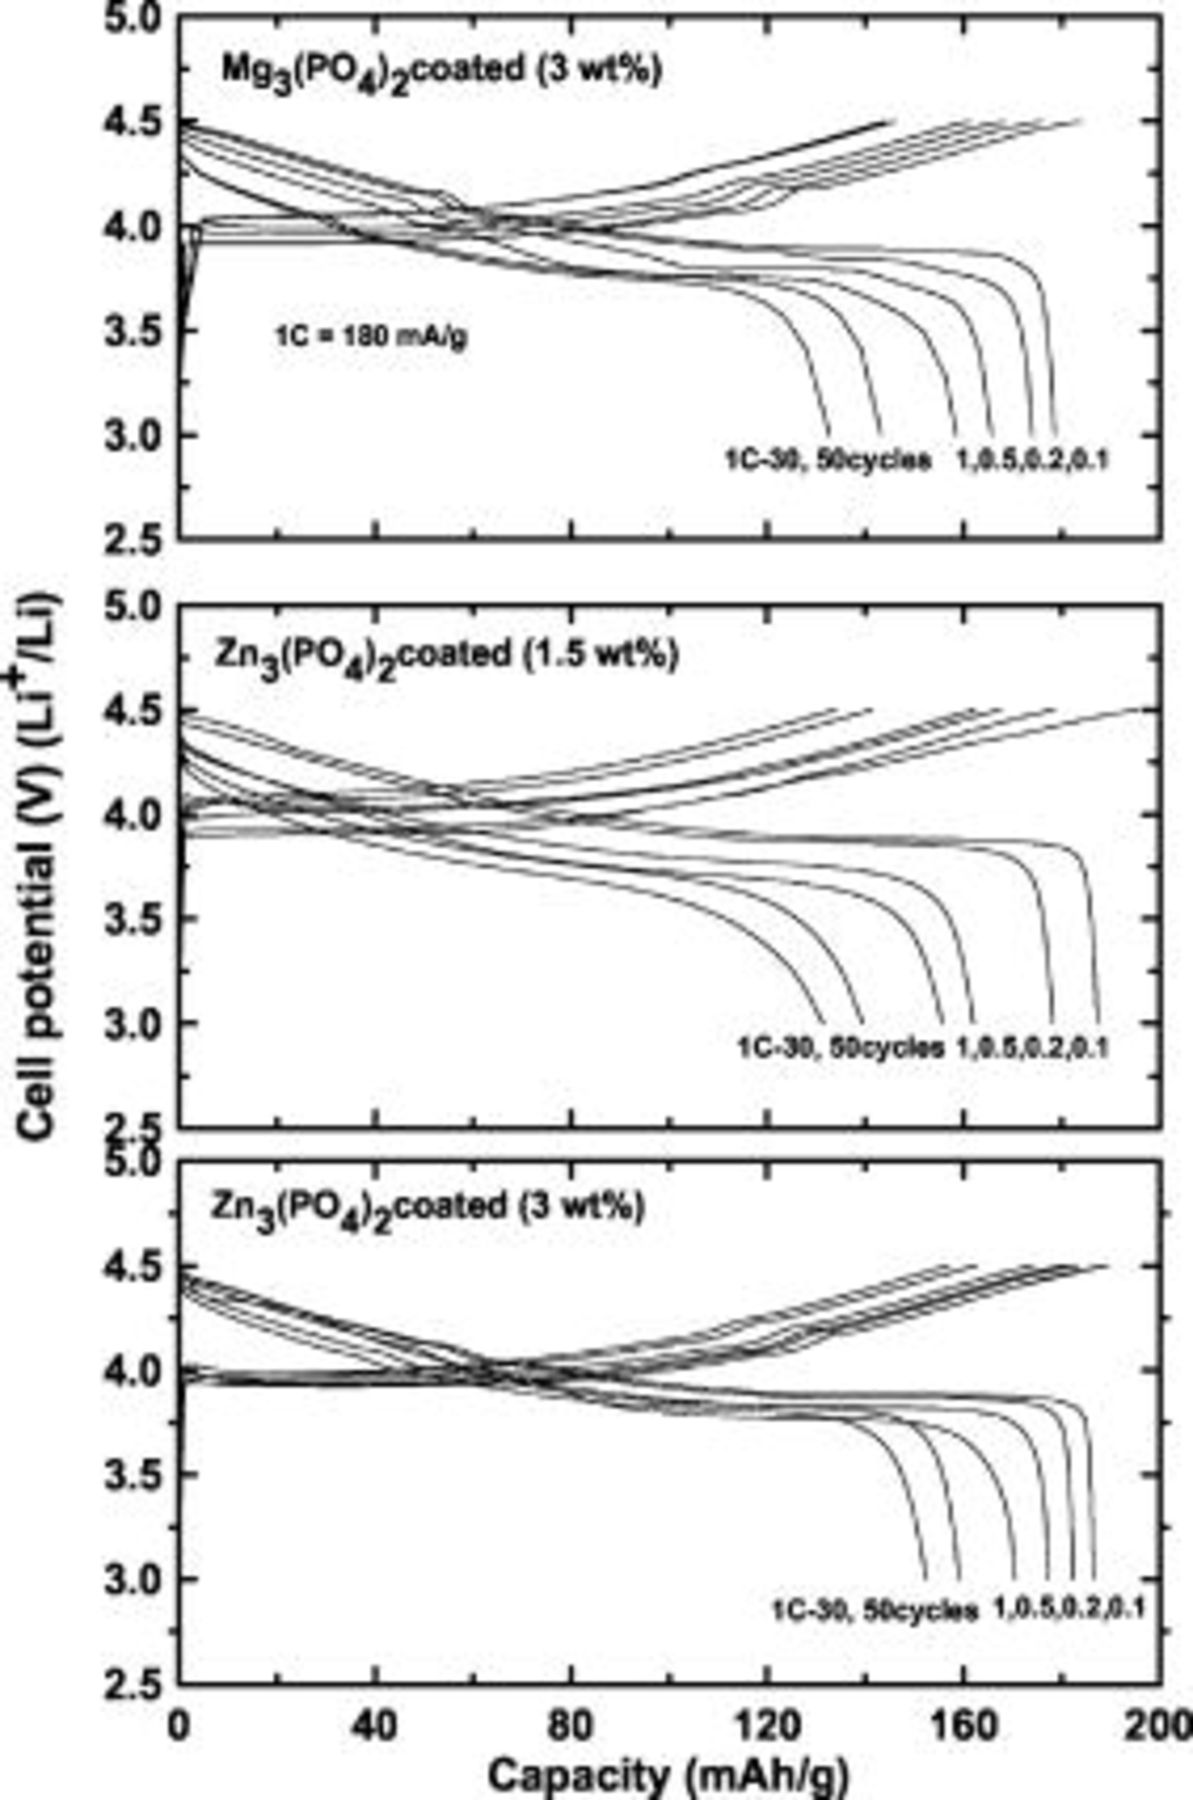
Figure 4. Plots of cycling curves of coin-type half cells containing uncoated and  and
and  nanoparticle-coated
  cathodes between 3 and
  at different C rates from 0.1 to 1C
  and after 30 and 50 cycles at a 1C rate. The same C rates were used during the charge and discharge processes. For the
  nanoparticle-coated
  cathodes, 1.5 and
  coating concentrations are compared.
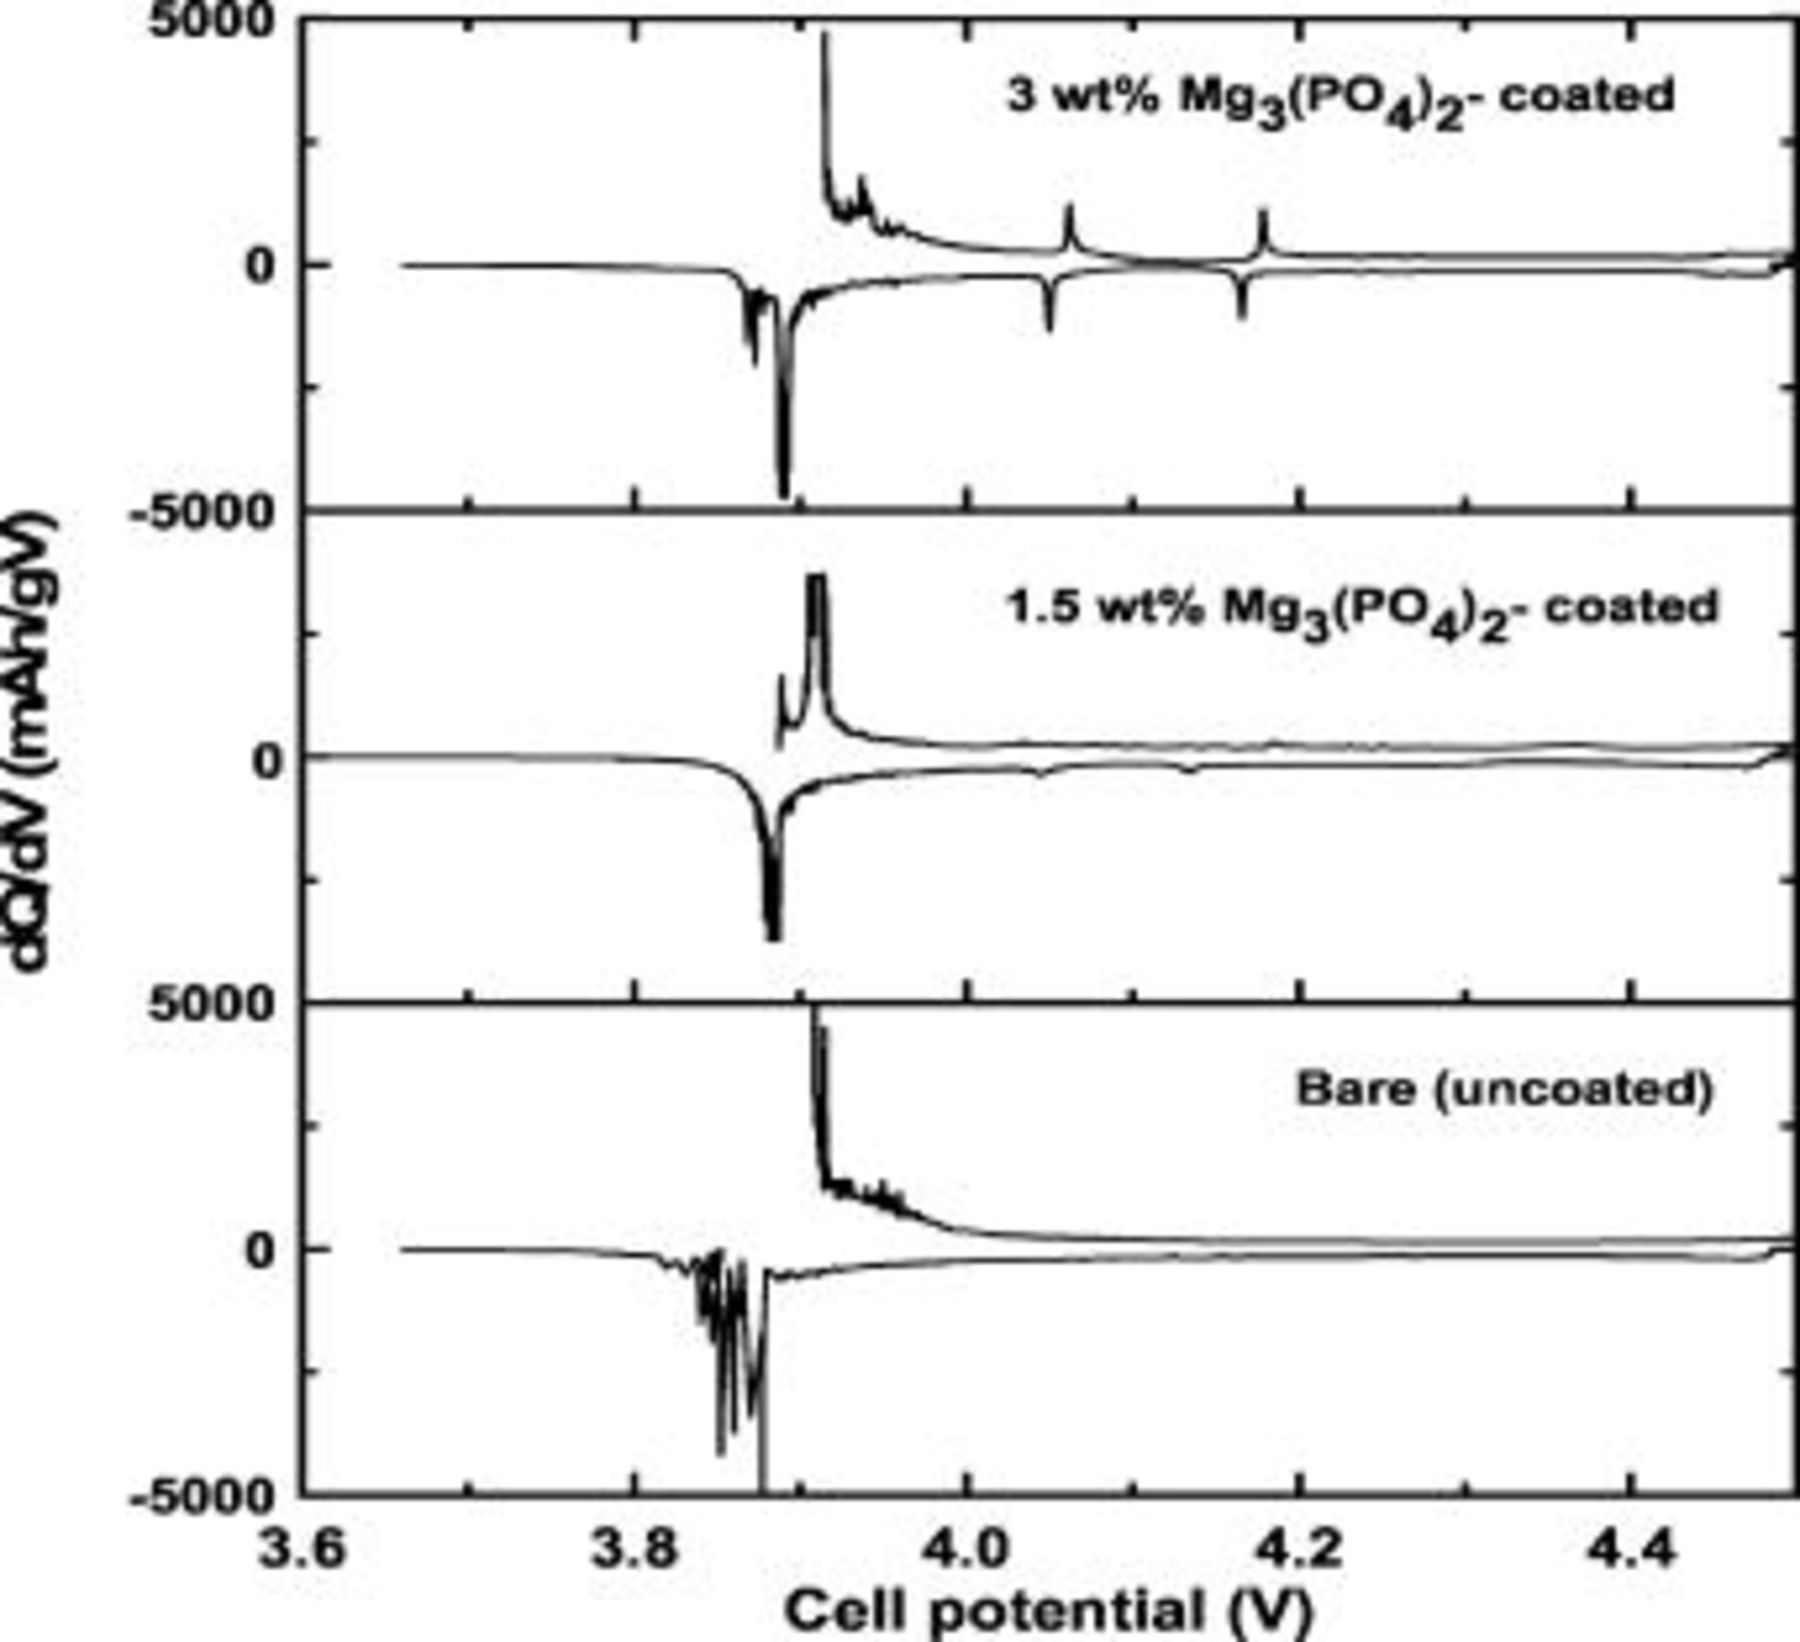
Figure 5. Differential voltage profiles for the uncoated 3, and 
 -coated cathodes in coin-type half cells.
The capacity retention of the  and
and  -coated samples (
 coating) was 84 and 90%, respectively, after 50 cycles. The decreased capacity retention with the
  coating relative to
  coating occurred because the nonuniform coating layer with coated nanoparticles
  in size impedes Li-ion diffusivity into the bulk particle. A similar result was observed in the
  and
and  -coated
  cathodes.15 When the coating concentration of the
  coating decreases to
  , the first discharge capacity is slightly larger than that of the
  coating, at
  . However, the capacity retention at 1C rate cycling decreases to
  , which is comparable with that of
  -coated
  . Table II summarizes the capacities of the uncoated, coated, and doped cathodes at different rates and after 30 and 50 cycles of the samples. Overall, the coated samples demonstrate enhanced capacity retention at 1C rate cycling. It is believed that
  nanoparticles exist as an amorphous solid solution on the particle surface with a partial reaction of bulk
  during an annealing process at
  , which may enhance both Li-ion and electronic conductivities. However, in the case of the
 -coated cathode consisting of both a thin coating layer
  and abnormally large nanoparticles with size of
  , these large nanoparticles may serve as abso lute insulators, leading to decreased conductivities. The
  -coated cathode
  does not show such large particles on the surface and has a uniform coating thickness of
  , although the reason for more a uniform coating layer formation than
  coating needs further investigation. The enhancement of electronic conductivities of the coated samples may be due to the formation of electronic holes in the solid solution near the particle surfaces, according to the reaction
  .21, 22 Based upon the above results, a more uniform coating is beneficial for both Li ion diffusivity and electronic conductivity. It is well known that large internal strains and subsequent mechanical degradation of the cathode materials originate from the dissolution of
  and
and  ions, and that the formation of by-products between reaction-dissolved ions and electrolytes at the interface enhances the structural degradation of the cathodes.20, 21 This effect becomes evident during storage at elevated temperatures.16 A previous TEM result showed that an uncoated cathode charged at
  showed a structural transformation into the spinel phase at the particle surface after storage at
  for
for  .16, 17
Table II. Comparison of the first discharge capacities of  (
( and Mg) and
  and
and  nanoparticles-coated
  at 0.1, 0.2, 0.5, and 1C and at 1C after 30 and 50 cycles
  . Units are
  .
.
| Material | 0.1C | 0.2C | 0.5C | 1C | 1C, 30 cycles | 1C, 50 cycles |
|---|---|---|---|---|---|---|

| 186 | 183 | 174 | 163 | 125 | 100 |

| 175 | 164 | 151 | 139 | 79 | |

| 175 | 169 | 155 | 141 | 79 | |
 coating coating | 179 | 174 | 166 | 159 | 143 | 133 |
 coating coating 
| 187 | 178 | 162 | 156 | 140 | 131 |
 coating coating 
| 187 | 182 | 176 | 171 | 159 | 153 |
Storage behavior of the cathode at  , especially at the charged state, is different from that at room temperature due to accelerated reactions between the cathode surface and the electrolytes. Many Li-ion manufacturers have regarded the storage test at
  as the most severe test condition among the various test methods to verify the structure stability of the cathode. At this test condition, cathode material is believed to play a major role in swelling of the Li-ion cells. Accordingly, it is important to provide the storage results of the cathode materials such as XRD and dissolved metal contents. Figure 6 shows XRD patterns of the uncoated sample after charging to
  as well as that after
  storage at 1 day. After storage at
  for 1 day, peaks assigned to
  ,
,  spinel phases, and
  phases are observed; these had significantly increased in size. Moreover, unknown phases with strong intense peaks are observed, and the development of similar peaks was observed in the
  cathode after storage at
  .17 At a higher voltage, the
  ions in the
  attack and oxidize the carbonate groups of the solvent molecules due to their acidic/nucleophilic properties and are reduced to
  .22 In addition, the formation of
  simultaneously accompanies the formation of
  , leading to a continuous increase of HF content, according to the reaction
  .23 The
  source is the cathodes, and uncoated and coated cathodes had 120 and
  , respectively, as measured by a Karl–Fisher moisture titrator. Hence, it is important to blacken the
  dissolution initially. In addition, the dissolved
  ions are solvated and combine with
  -oxidized solvent molecules to form lithium-containing organic products. As shown in Table III, the Co content in the uncoated sample after storage was
  (before storage its amount was negligible). The
  content of the uncoated sample after storage increases to
  , compared to
  before storage. In consequence, the charged uncoated cathode undergoes severe structural instability at
  . The low-magnification TEM images of the uncoated cathode after storage at
  in Fig. 7a show the presence of rough surfaces and different contrasts near the surfaces, which indicates the presence of a highly defected phase. Essentially, the high-resolution image in Fig. 7b shows the formation of the amorphous phase that resulted from the severe dissolution of Li and Co at
  .
.
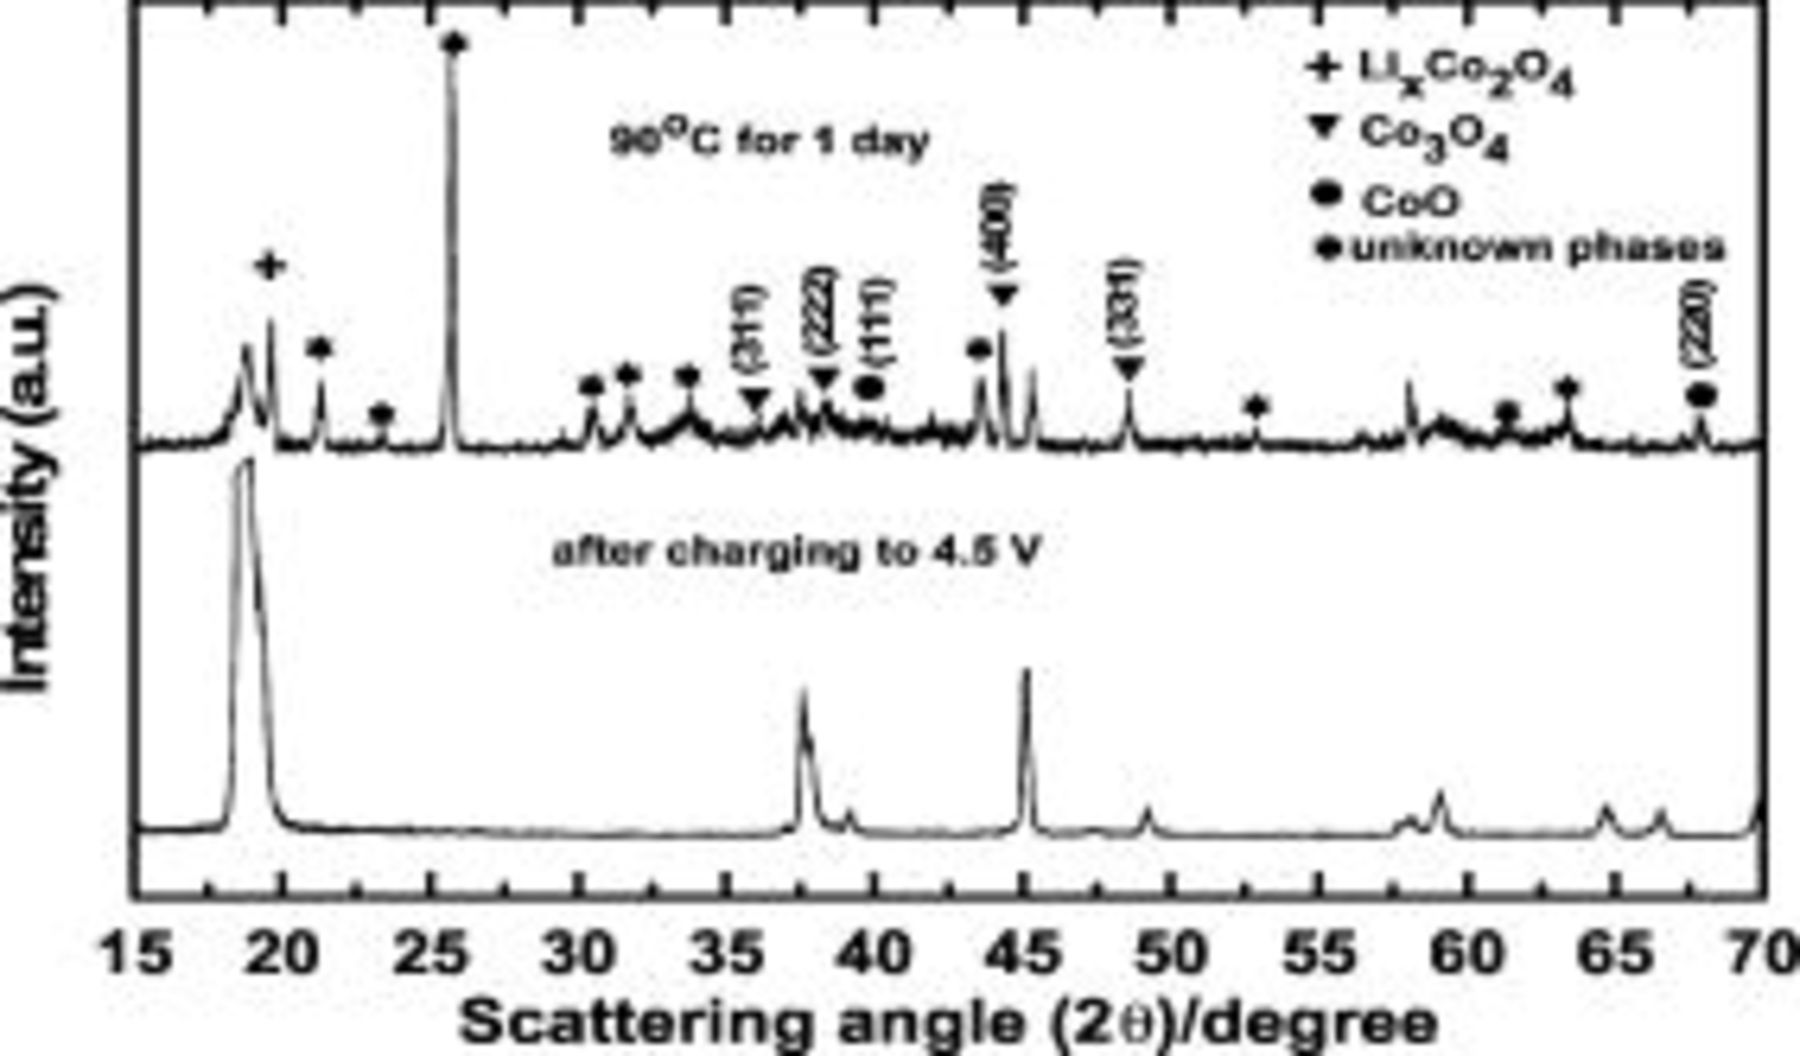
Figure 6. XRD patterns of a uncoated  electrode after a
  charge and after storage at
  for
for  . After charging the cell, the electrode was separated from the cell and kept in the electrolyte in a vial.
Table III. Amounts of the dissolved  ions into the electrolytes and
  contents in
  (
( and Mg) and
  and
and  nanoparticle-coated
  during storage at
  after 1 day after charging to
  vs lithium metal.
| Material | Co | HF before storage (ppm) | HF after storage (ppm) |
|---|---|---|---|

| 3000 | 200 | 900 |

| 270 | 190 | 350 |

| 900 | 210 | 500 |
 coating coating 
| 70 | 90 | 30 |
 coating coating | 90 | 100 | 50 |
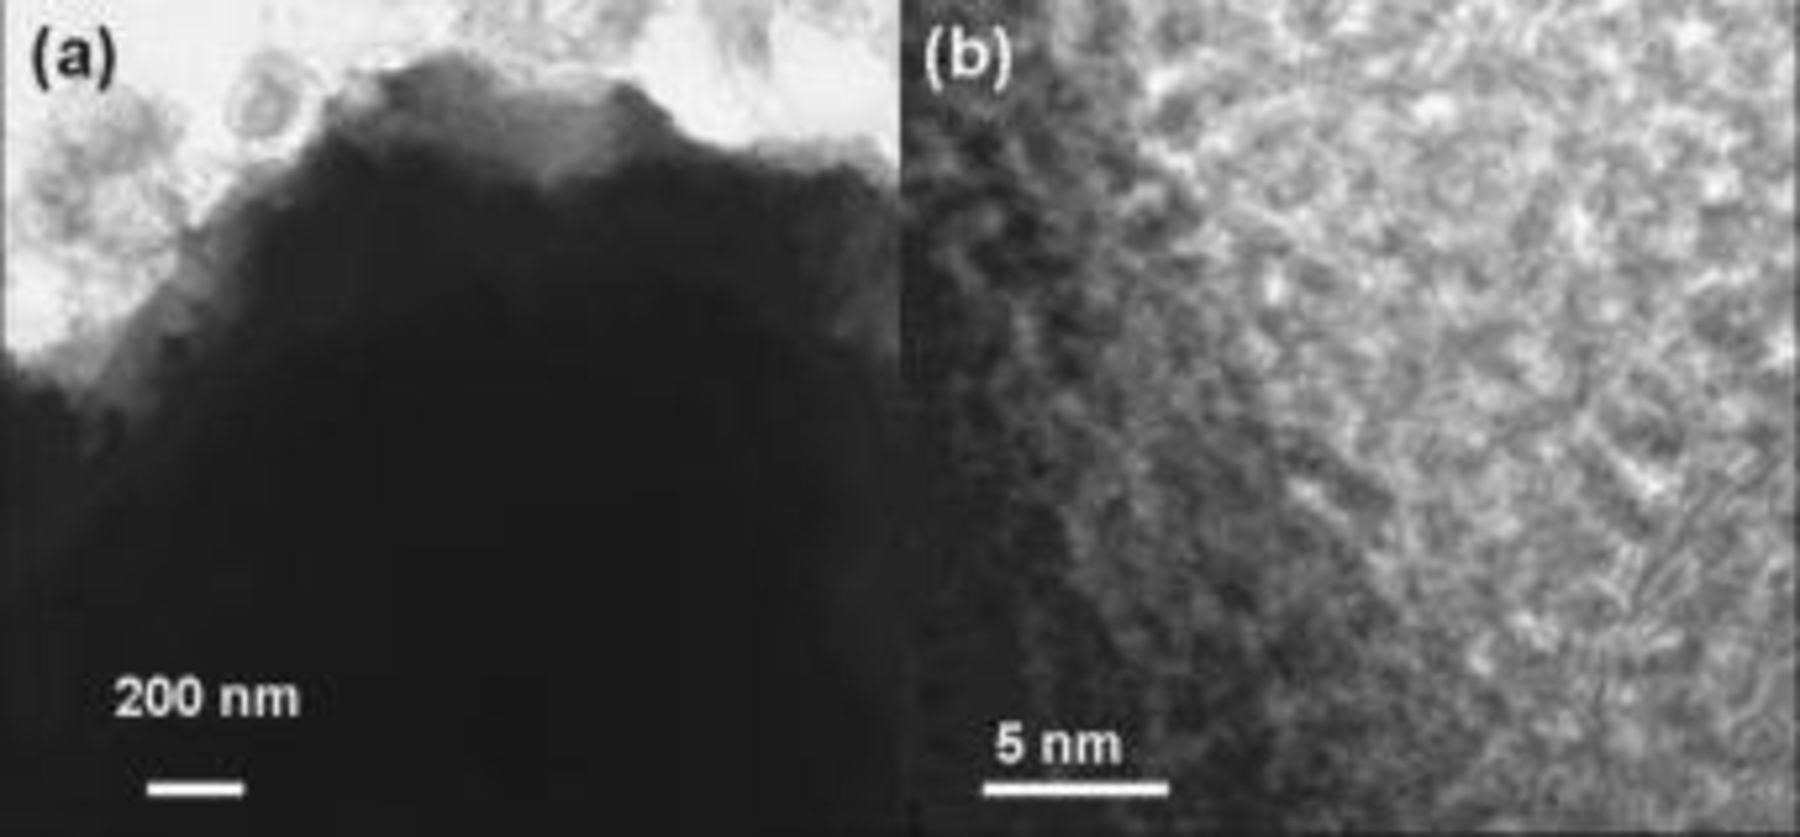
Figure 7. TEM images of uncoated electrodes after storage at  for 1 day at
  .
.
XRD patterns of the doped cathodes are, however, quite different from those of the uncoated cathode after storage at  (Fig. 8). XRD patterns of the charged
  electrode stored at
  show that the peak intensities of unknown phases are significantly decreased, although
  and
and  peaks continue to be present. For
  , unknown peaks including
  and
and  phases are not observed, except for a slightly increased peak-broadening effect, compared to that of the charged cathode. This result indicates that Zn or Mg doping into the
  causes an improvement in structural stability and reduces surface reactivity with the electrolyte, although Zn doping leads to a better result. This result is further supported by the amount of dissolved Co content in the electrolyte at
  . The
. The  contents of the Mg- and Zn-doped cathodes after storage were 900 and
  , respectively. Similarly, the
  content decreased in the doped cathodes; they were measured at 500 and
  , respectively, as shown in Table III. This result agrees with the XRD patterns of the doped cathodes kept at
  , as shown in Fig. 6. The TEM image (Fig. 9) of the
  electrode shows the formation of the
  phase at the particle surface, while that of the
  electrode shows a pristine layered phase.

Figure 8. XRD patterns of the  (
( and Mg) and
  and
and  nanoparticle-coated
  electrodes after a
  charge and storage at
  for
for  . After charging the cell, the electrode was separated from the cell and kept in the electrolyte in a vial.
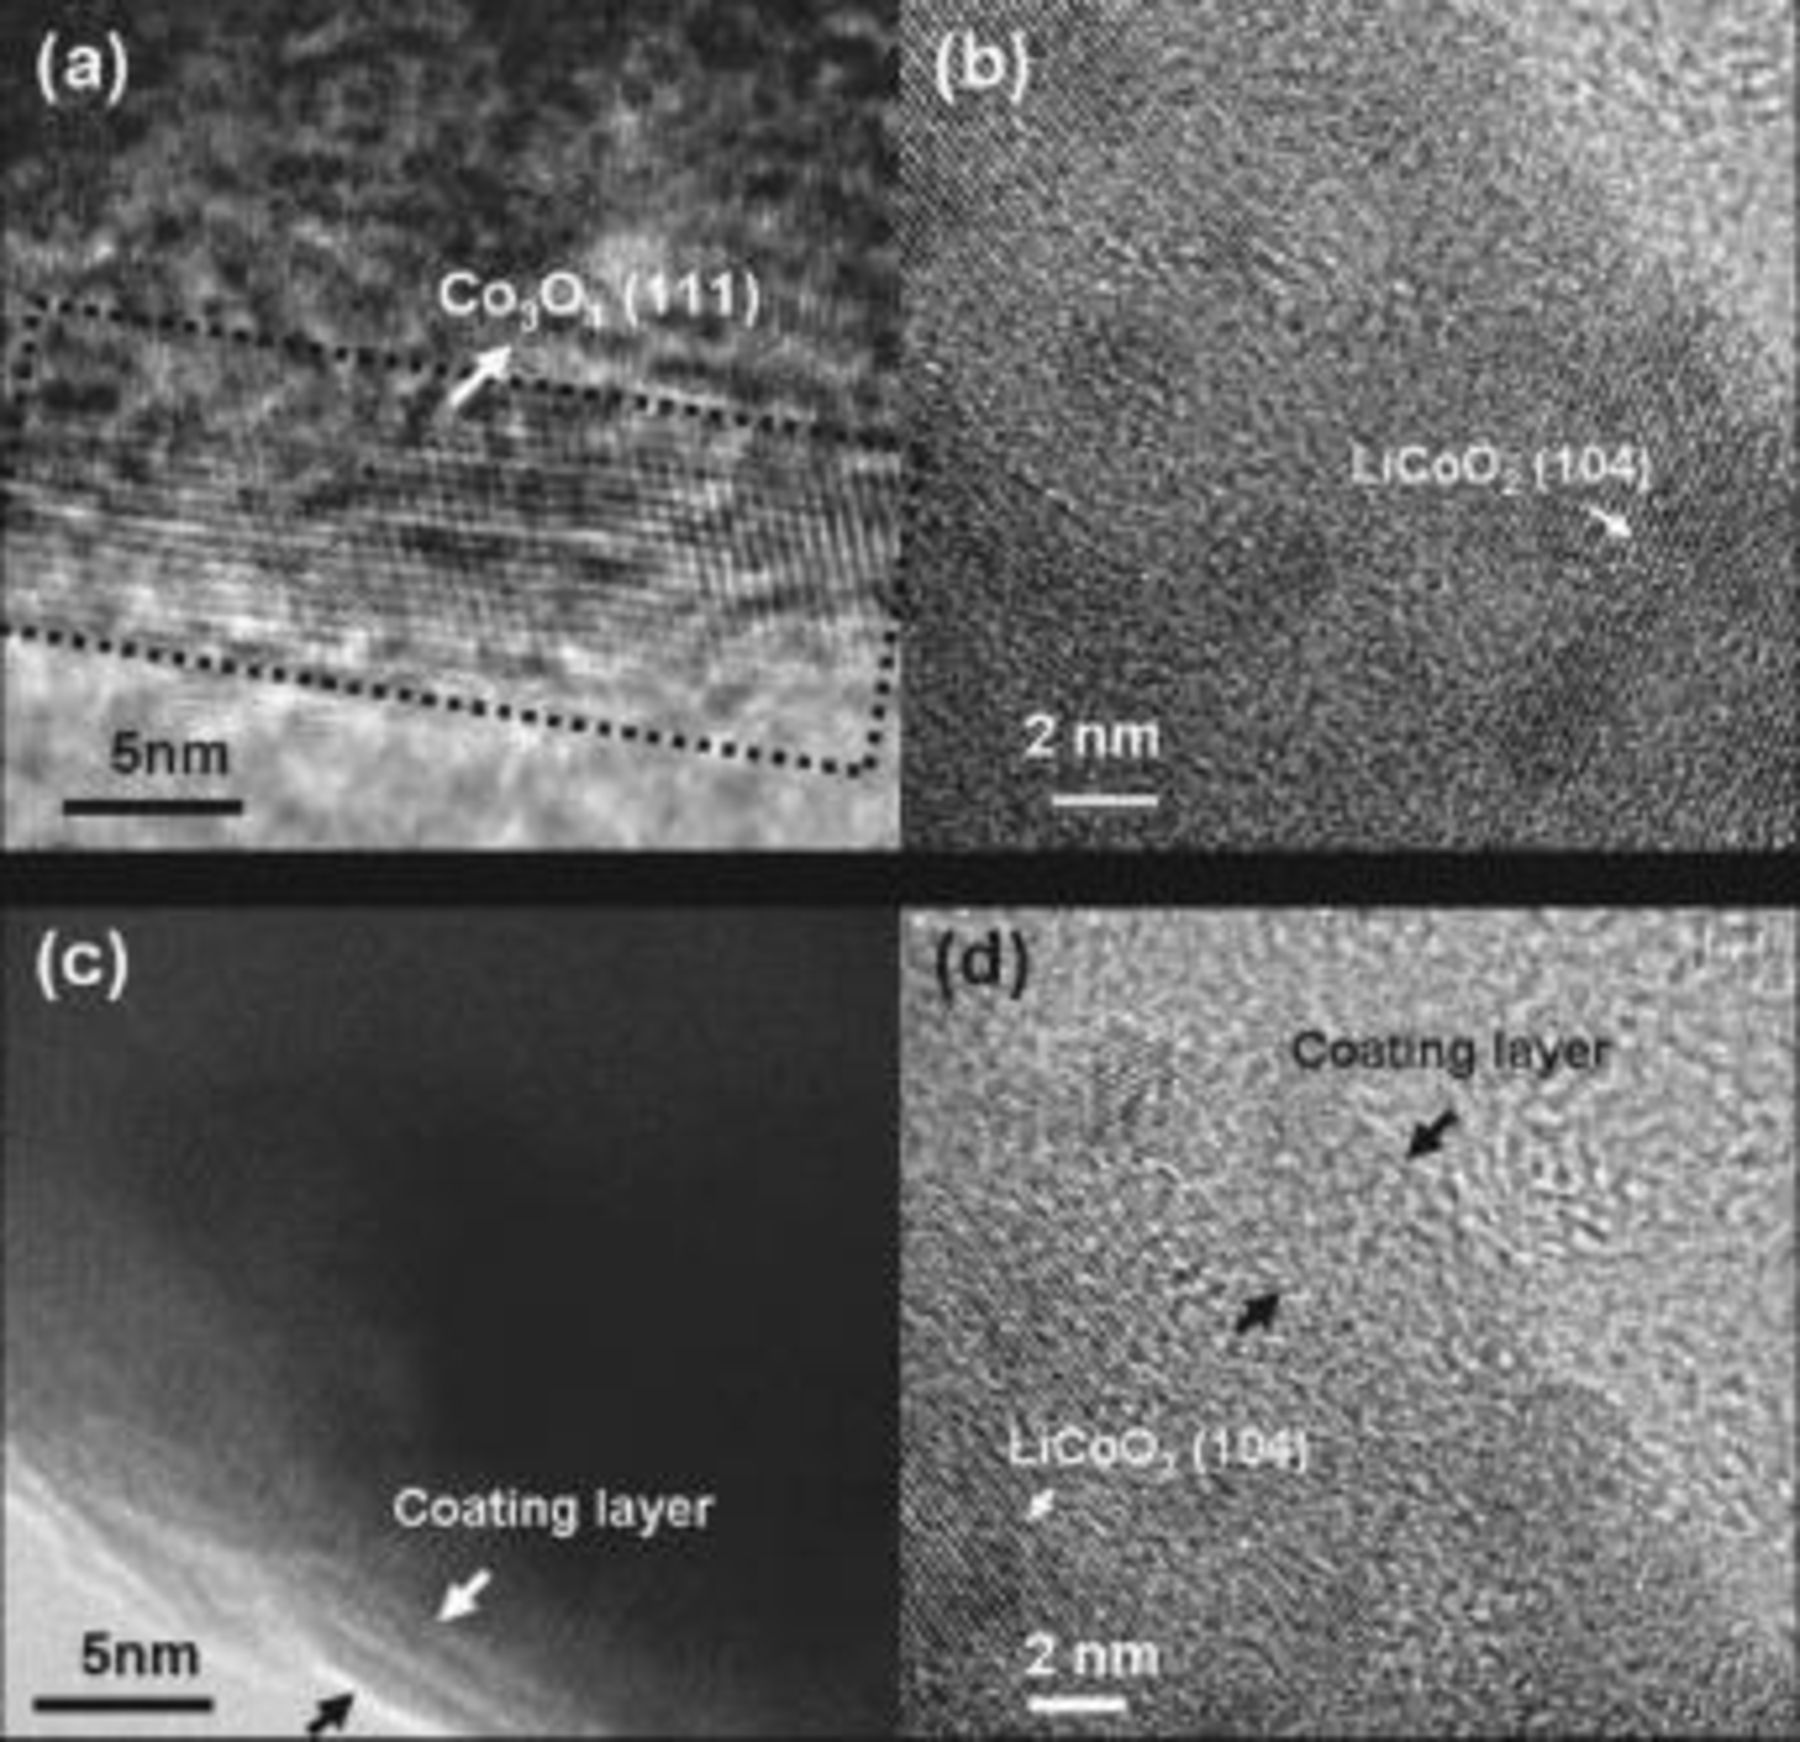
Figure 9. TEM images of (a)  and (b)
  electrodes, after storage at
  for 1 day at
  and (c)
  and (d)
  nanoparticle-coated
  electrodes, after storage at
  for 1 day at
  .
.
As shown in Fig. 8, XRD patterns of the coated cathode after storage exhibit no peak spectral changes relative to those of the cathodes charged to  , indicating that the surface coating layer effectively reduces the reactions with the electrolytes. It has been reported that the coating layers act as an
  scavenger.24 As shown in Table III, the
  content after storage was significantly decreased to 30 and
  for the
  and
and  coatings, respectively. This result is consistent with other studies that concluded that the surface coating layer gettered
  ions from
  .24–27 TEM images of the stored samples support the XRD spectral results in Fig. 8, and neither coated sample shows the formation of the spinel phase while maintaining the original layered phase. TEM images of both coated samples are similar to the Zn-doped cathode, with a coating layer that does not show damage. In contrast to the uncoated cathode, the TEM image of the
  -coated cathode shows a smooth surface, which is indicative of the absence of a development of defect phases.
Conclusions
In terms of electrochemical cycling and storage characteristics at  , coated samples showed much-improved results relative to doped cathodes. In contrast to the doped cathodes, the coated samples were effective in retarding direct reactions between the electrolyte and the cathode surface that consisted of highly oxidized
  ions. Overall,
  -coated cathodes showed a first discharge capacity of
  and excellent capacity retention at 1C rate after 50 cycles, as shown by a
  measurement. This result indicates that the amorphous-like coating layer was effective for improving electrochemical activity and that it decreased side reactions with the electrolytes at
  as well.
Acknowledgments
This work was supported by Ministry of Information and Communication (MIC) and Institute for Information and Technology Advancement (IITA) through the Information Technology (IT) Leading Research and Development Support Project.
Kumoh National Institute of Technology assisted in meeting the publication cost of this article.