
Abstract
Aqueous corrosion behavior of the dual-phase  iron aluminide was investigated in
 using a microelectrochemical technique and scanning Auger electron spectroscopy (SAES) to explore corrosion and passivation behavior of the individual phase, i.e.,
  and
and  . The corrosion resistance of the matrix
  phase evaluated in terms of electrochemical parameters such as corrosion current density, passive current density, and critical current density were found superior to that of the carbide phase. The passive film formed on the matrix phase was more stable compared with that on the carbide phase. Low Al content and presence of C in the carbide phase were attributed to its poor passivation behavior.
Export citation and abstract BibTeX RIS
In recent years, in development of iron aluminide, the carbon containing dual-phase iron aluminides have been shown to possess advantages over the single-phase iron aluminides due to their superior hydrogen embrittlement resistance and enhanced high-temperature strength,1–4 which have been the main obstacles for commercialization of iron aluminides.5, 6 Though these dual-phase iron aluminides have been developed mainly for structural applications at elevated temperatures, considering their low cost and avoiding the use of strategic elements such as Cr and Ni, these materials are also being considered for room-temperature applications. Hence, intensive research on this material has been carried out over the last seven years to understand its aqueous corrosion behavior.7–11 Iron aluminides display complex aqueous corrosion behavior. For instance, these alloys show low passive current density  and wide passive potential range in mild acid electrolyte compared to its alloying elements, Al and Fe, while corrosion rate of the alloy is higher than that of Fe or that of Al.9, 11 The presence of a second phase, such as carbide, makes electrochemical corrosion behavior of the alloy further complex. A survey of the previous works shows that an increase of C content in
  based iron aluminide leads to an increase in current density of the alloy in the passive region, which was linked to the increase in the volume fraction of the carbides in the alloy.12, 13 On the other hand, on reducing the Al content from
  in
in  alloy, the corrosion resistance of the alloy is affected by
  phase rather than
  phase. This is because
  phase converts into FeAl
  phase while the stoichiometry of
  phase remains unchanged.13, 14 In addition, there are still many questions to be answered, including the interfacial corrosion behavior at matrix and carbide phases, the galvanic effect between both phases, and whether the carbide is active or nobler to the matrix phase, and is able to be passivated.
So far, conventional large-scale (macro) electrochemical techniques such as potentiodynamic, potentiostatic measurements, and surface analysis have been used to examine the aqueous corrosion behavior of dual-phase iron aluminide.12, 14 These techniques give only global information, which is simply the sum of contributions of the different grains and phases, multiplied by their individual degree of coverage, and hence cannot distinguish the corrosion/passivation behavior of each phase. Accordingly, an electrochemical device, a capillary-based droplet cell (Fig. 1), is a powerful technique to resolve the problem because it allows electrochemical examination on a microregion. Small electrolyte droplets positioned on the sample surface with a capillary tip of  diameter can enable the investigation of the corrosion and passivation behavior of individual phase in matrix/carbide composite. This technique has been used in the past to resolve the corrosion behavior of duplex stainless steels (DSS) and polycrystalline alloys such as Al and Ta and aluminides.15–17
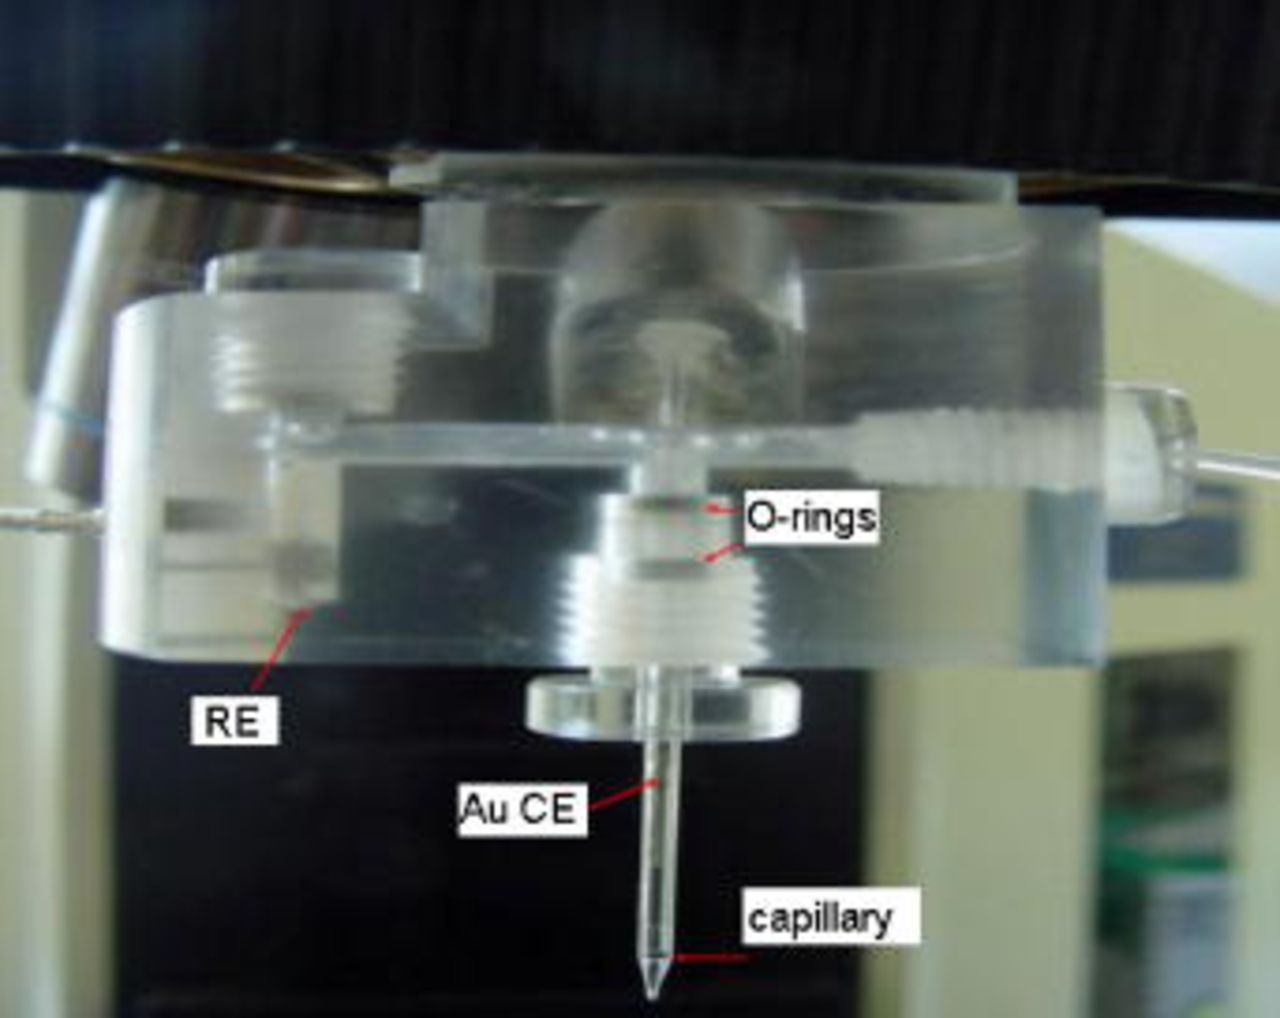
Figure 1. (Color online) General view of microcell used in the present study.20
The chemical compositions of the passive film formed on the surface of individual phase are important parts of information needed to understand the corrosion mechanism of dual-phase iron aluminide. A surface sensitive technique such as scanning Auger electron spectroscopy (SAES) can be an excellent tool for such studies. This technique has been used to analyze compositions of the passive film formed on the ferrite and austenite phases of a duplex stainless steel.18
In this paper, we elucidate the electrochemical corrosion behavior of individual phases, i.e., matrix and carbide of the dual-phase iron aluminide in 
 solution, using the microelectrochemical technique. The surface chemistry of the passive film formed on each phase will be studied by SAES. The results obtained by means of microelectrochemical and SAES are expected to enhance the present understanding on the aqueous corrosion behavior of C containing dual-phase iron aluminides.
Experimental
The iron aluminide used in this study has a nominal composition of Fe–16Al–0.5C (wt %). It was prepared by air induction melting followed by electroslag refining process.19 Specimens for the microstructural analysis, electrochemical studies, and surface analysis were obtained by polishing them on successive grades of SiC papers starting from 220 down to 2000 grit, followed by a finish with  diamond paste and ultrasonically cleaned in methanol. For metallographic observation the specimen was etched in an etchant consisting of
  by volume.
For electrochemical studies, 
 electrolyte was prepared by using analytical grade
  in distilled water. For macroelectrochemical studies a typical three-electrode cell was used, which consists of a Pt as counter electrode, saturated calomel electrode (SCE) as a reference electrode, and specimen as a working electrode. A diagram of microelectrochemical cell used in the present study is shown in Fig. 1, which is similar to that reported by Lohrengel et al.20 The cell consists of Au wire counter electrode,
  reference electrode, and working electrode. The potential values obtained from microelectrochemical studies are presented after converting into SCE values. The tip size of the capillary was estimated from the plateau current in cyclic voltammograms on pure Al in a pH 6 acetate buffer solution at a scan rate of
  and converting the measured plateau current to the capillary area.21 A plateau current of
  corresponds to a specimen exposure area of
  . A capillary with an inner diameter of
  (area
(area  ) was used for the measurement. All the polarization experiments were conducted with a scan rate of
  .
.
SAES measurements were performed by using Perkin-Elmer PHI 660 model with a primary electron beam energy of  and a beam current of
  , which yielded
  spot size for analysis. The electron gun bombarded the surface at 30°. The Ar gun was operated at
  with a beam current density of
  . A Hewlett-Packard model 4500 induction coupled plasma mass spectrometry (ICP-MS) was used to analyze the dissolved cations from the alloy or/and elements released during dissolution of oxide layer into the electrolyte. The instrument was calibrated by external calibration method with multielement standards.
Results
Microstructural and phase analysis
It was previously repor ted12 that the dual-phase iron aluminide with a composition of Fe–16Al–0.14C (wt %) provides optimum corrosion resistance for a range of C content from 0.05 to 1%. However, the size and volume fraction of the carbide phase in this alloy is too small to examine its corrosion behavior by a microelectrochemical technique. Hence, the C content in the alloy was increased from 0.14 to 0.5% to increase size and volume fraction of the carbide. Figure 2 shows a secondary electron microscope (SEM) image of the microstructure of an etched surface of alloy Fe–16Al–0.5C, used in the present study. Distribution of the carbide particles in the matrix can be seen in the micrograph, phases were confirmed by compositional analysis using energy dispersive X-ray analyzer attached to SEM. The appearance of white edges around the carbide particles is due to topology difference between carbide and matrix phases. X-ray diffraction analysis revealed the presence of two phases in this alloy as  and
and  corresponding to matrix and carbide, respectively.4

Figure 2. Microstructure (SEM) of the alloy Fe–16Al–0.5C, showing distribution of the carbides in the matrix phase.
Macroelectrochemical investigation and ICP analysis of the Fe–16Al–0.5C alloy
The polarization behavior of the alloy measured by macroelectrochemical technique in 
 is shown in Fig. 3. This polarization curve serves as a reference for the polarization behavior to be obtained from the microelectrochemical technique. A descriptive analysis of the polarization curve can be found elsewhere.12 The dissolved cations from the
  exposure of iron aluminide electrode in electrolyte, after polarization, have been analyzed by the ICP method; results are shown in Table I. These results show low concentration of Al compared with that of Fe in dissolved ions. However, comparing the ratio of dissolved ions with the ratio of atoms present in the bulk of the alloy it seems that the dissolution of both the elements occurs at a similar rate. No trace of C atoms was found in solution: this excludes the speculations of conversion of C atoms into organic acid, e.g., HCOOH or into dissolved gases such as
  ,
,  after reaction with acid
  .
.
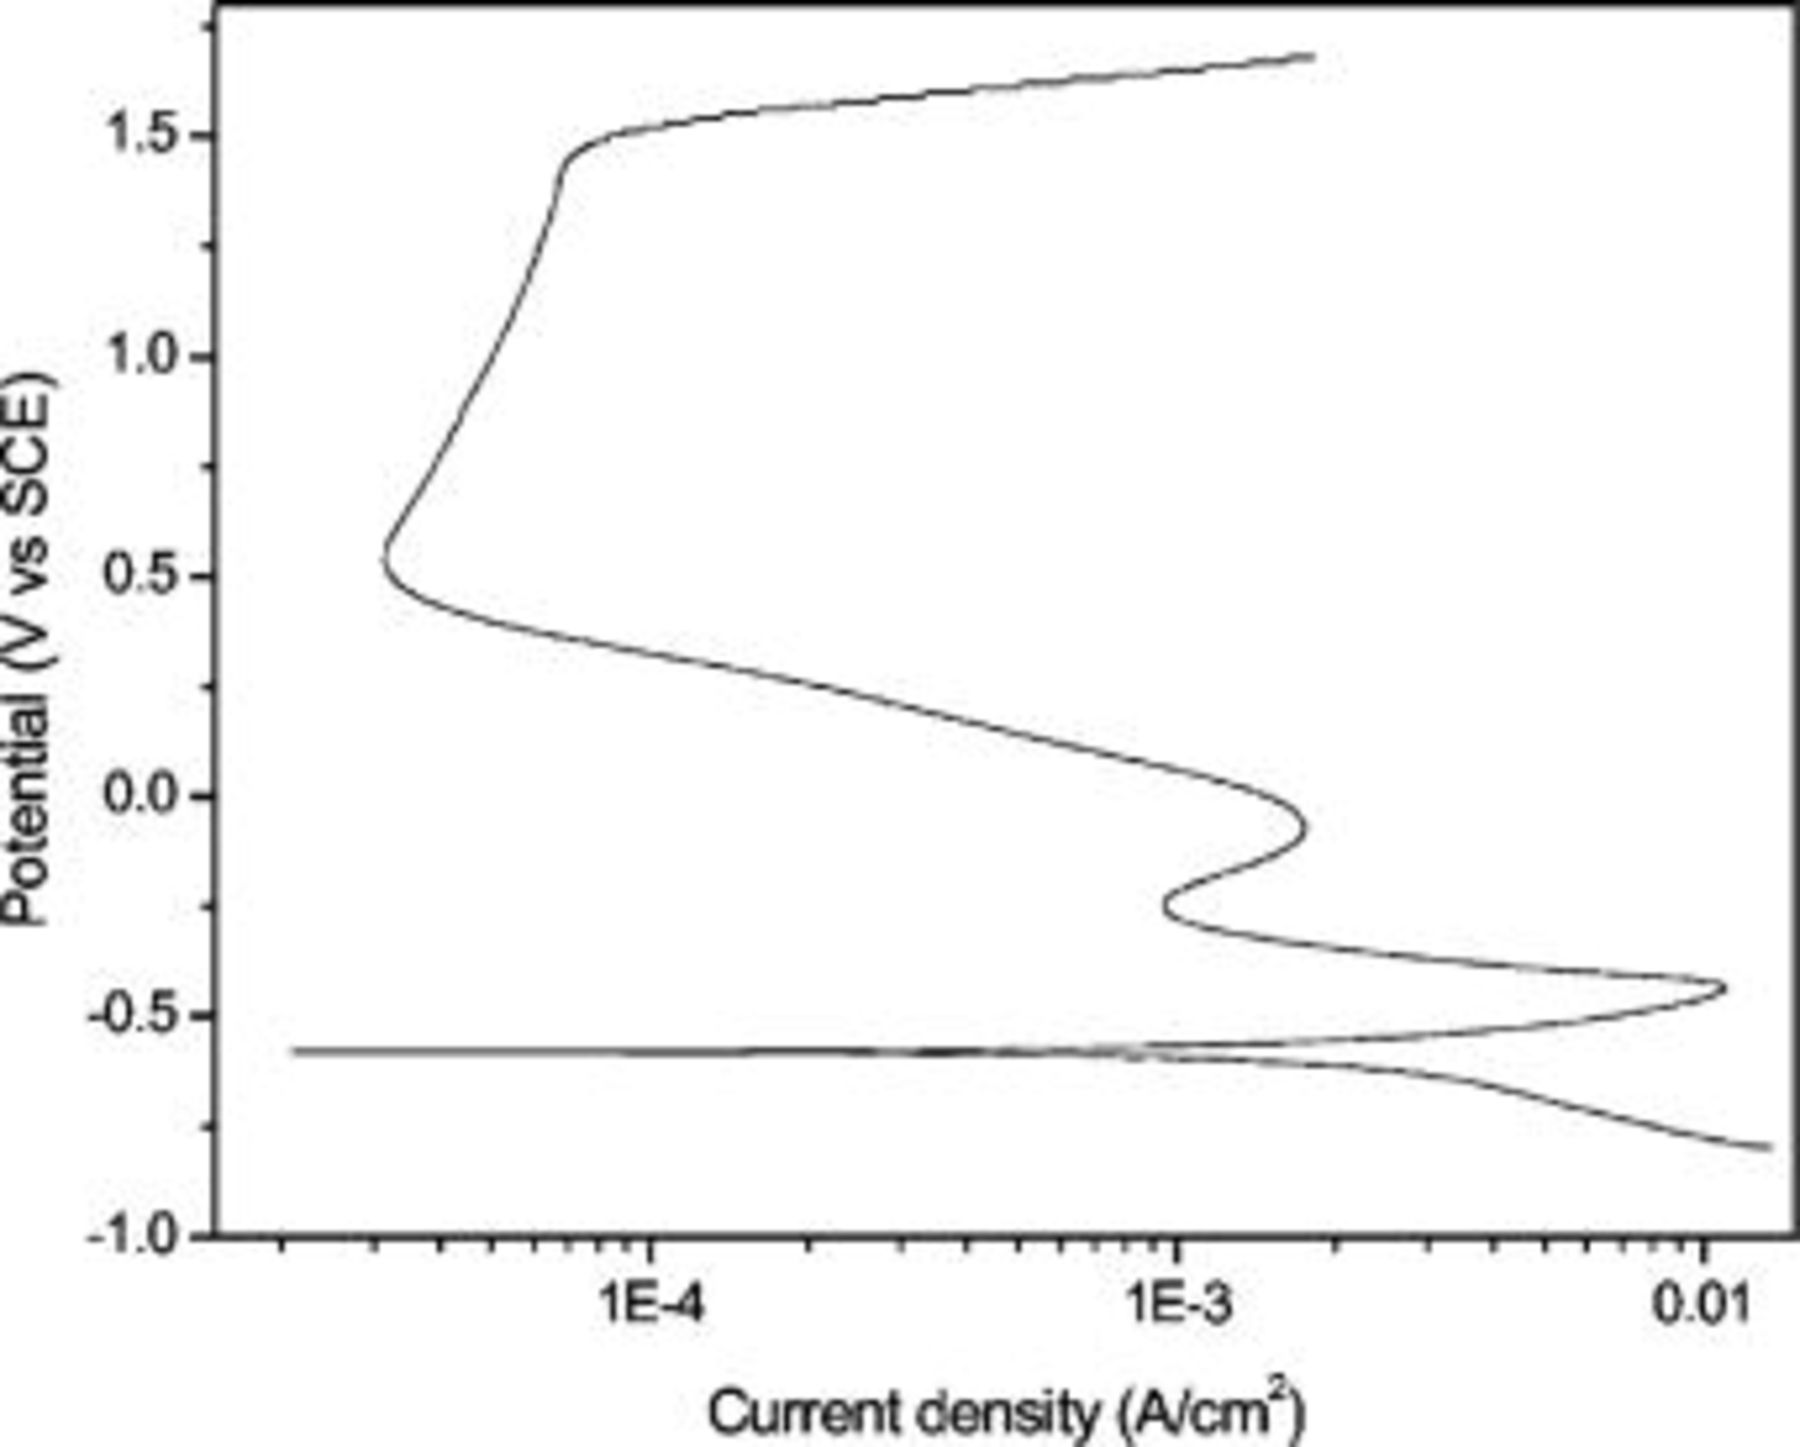
Figure 3. Potentiodynamic polarization curve of alloy Fe–16Al–0.5C in 
 obtained from macroelectrode technique.
Table I. ICP quantification of dissolved cations from iron aluminide after polarization in 

 .
.
| Elements | Mass | Concentration (ppm) | RSD (%) |
|---|---|---|---|
| Al | 27 | 0.6 | 2 |
| Fe | 57 | 2.7 | 28 |
| C | 12 | 0 |
Microelectrochemical investigation of the  phases in Fe–16Al–0.5C alloy

Polarization curves of the individual phases,  and
and  , in
, in 
 obtained from the microelectrochemical cell, are shown in Fig. 4a and 4b, respectively. As noticed in the microstructure of alloy (Fig. 2), there is enough wide space in the matrix phase to position the microcell tip, whereas in the carbide phase it is not so. The carbides are closely distributed, which makes it difficult to set the cell tip on a single carbide segment. Hence, for measurement of the polarization behavior of carbide phase, the region was selected where total volume fraction of the carbide was more than 80%. Figure 4a shows polarization behavior of the matrix phase that was measured on two different places. There is reasonable reproducibility in results obtained from the matrix phase, which is evident from curve i (solid line) and curve ii (broken line). Basically, these results show similar current-potential behavior obtained by macroelectrochemical technique (Fig. 3). However, any variation in the current density and in the potential between micro and macrotechniques is assumed to affect equally the matrix and the carbide phase.
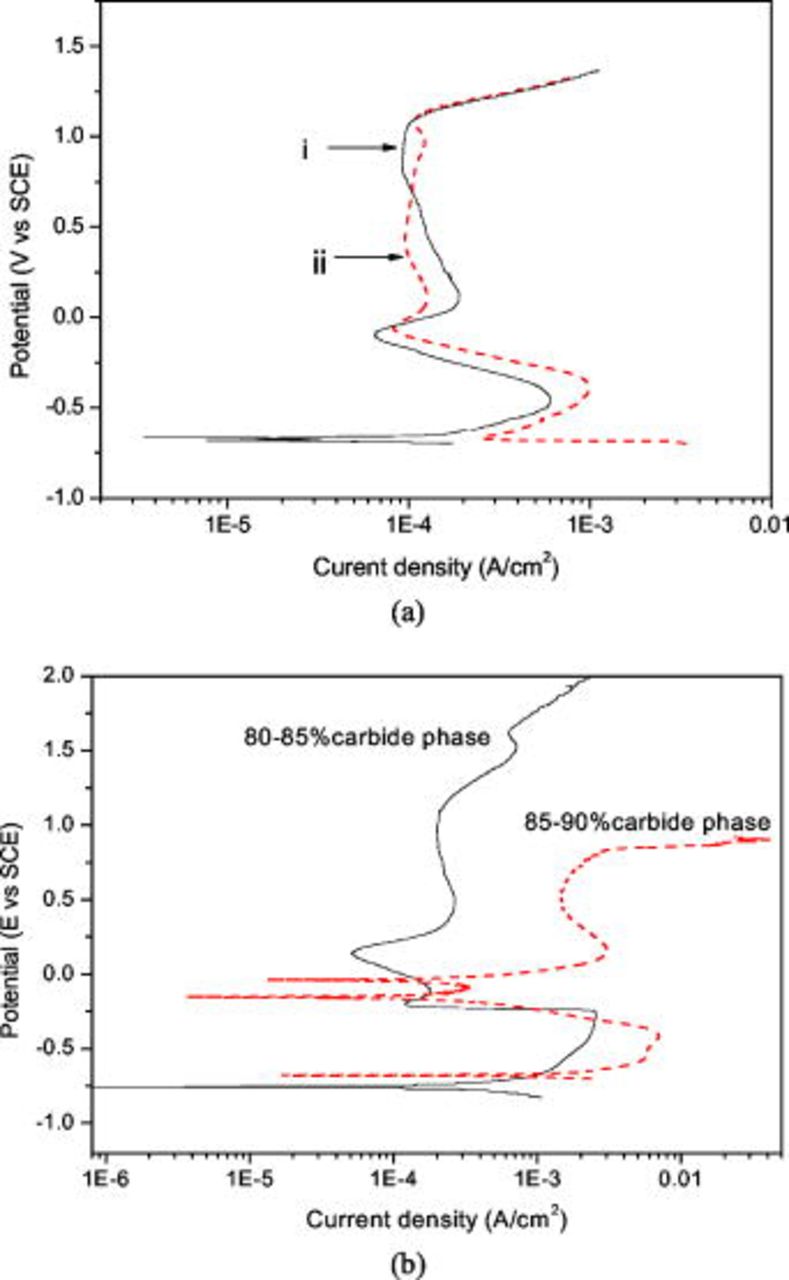
Figure 4. (Color online) Potentiodynamic polarization curves obtained from microcell technique of alloy Fe–16Al–0.5C in 
 : (a) matrix phase and (b) carbide phase.
Figure 4b shows the polarization behavior obtained from the carbide phase for different volume fractions of the carbide. In which, the curve with solid line corresponds to 80–85% of carbide phase and that with dashed line to 85–90% carbide. Unlike polarization curves obtained from the matrix phase, there is a large variation in these polarization curves. Virtually, this is due to different volume fraction of the carbides and the presence of matrix-carbide interface. Compared to the matrix phase, the carbide phase displays poor passivation behavior in terms of passive potential  as well as current density in the passive region. A noticeable difference in polarization behavior of both the phases is that there is a prepassivation region in the matrix phase and a gradual decrease in current density from critical current density to passive region, while in carbide phase there is no prepassive region and a rapid current transition from active to passive potential occurs. The former resembles to typical current transition in iron aluminide alloys, while the later give the impression of polarization curve for the ferrite in steels. A sudden drop in current density from active region is a characteristic of being insufficient Al ions on the surface to form
  passive film. Indirectly, it reflects that Al content in the carbide phase is below the critical concentration required for passivation. From a general comparison among the polarization curves in Fig. 3, 4a and 4b, it is evident that the typical active-passive transition behavior in dual-phase iron aluminide is due to the matrix phase and overall corrosion behavior is dominated by the matrix phase rather than the carbide phase for the Fe–16Al–0.5C alloy. For a detailed analysis, electrochemical parameters such as corrosion current density
  ,
,  , critical current density
  , corrosion potential
  and
and  calculated from the polarization curves in Fig. 3, 4a and 4b have been tabulated in Table II and are discussed in the next section. An SEM image taken from the carbide phase after microelectrochemical polarization is shown in Fig. 5, which shows dissolution of the carbide phase in
 media during polarization. The creation of porosity due to dissolution of carbides can also be seen through this micrograph.
Table II. Electrochemical corrosion parameters of Fe–16C–0.5C alloy, and its indivisible phases obtained from the polarization curves in Fig. 3, 4a and 4b.
| Techniques | Phases |


|


|


|
 V(SCE) V(SCE) |
 V(SCE) V(SCE) |
|---|---|---|---|---|---|---|
| Macro electrochemical | Overall alloy surface | 2.5 | 19.7 | 0.05 |

|

|
| Micro electrochemical | Matrix (average of curve i and curve ii) | 0.2 | 0.75 | 0.104 |

|

|
| Carbide (80–85)% | 0.96 | 2.5 |
 0.05 0.05 |

|

| |
| Carbide (85–90)% | 1.6 | 6 | ND |

| ND |

Figure 5. Micrograph (SEM) of Fe–16Al–0.5C alloy after polarization over the carbide phase using microcell technique.
SAES analysis of the passive films formed on the matrix and carbide phases
For SAES analysis of the passive film, the alloy was passivated at  in
in 
 for
for  . The current flow during the passivation process is shown in Fig. 6. There is a gradual increase in the current density during passivation with time, and after about
  it sharply increases. Figures 7a and 7b show SAES depth profiles of O, C, Fe, and Al obtained from the passive film formed on the surface of matrix phase and carbide phase, respectively. The O profile is initially high on the carbide phase compared to the matrix phase. With an increase in sputtering time, there is a smooth decay in O profile on the matrix, whereas on the carbide phase it sharply decays, and finally reaches asymptotically in both the phases. A calculation from Fig. 7a and 7b shows that the sputtering time for O profile to reach 5% of initial value takes more than
  in the matrix phase, whereas in the carbide phase it takes about
  . In the C profile, a very high intensity on matrix as well as carbide phase before
  sputtering time is assumed to be an artifact due to contamination. After a sharp decay, it shows about 25% C in the upper surface of the passive film formed on the matrix phase while 40% C on the carbide phase, and in both cases it gradually decreases with sputtering time. Throughout the passive film C concentration is high on the carbide phase compared with that on the matrix phase. C spectra show its enrichment on overall surface of the alloy, which could occur through the dissolution of the carbide phase (Fig. 5). The Fe atomic percentage in the passive film of the carbide phase is low compared with that of the matrix phase, due probably to more enriched C atoms on the carbide surface. However, Fe profile gradually increases with the sputtering time in carbide as well as matrix phase. These spectra also represent the presence of less Fe atoms in the passive film compared with the bulk of the alloy. SAES spectra do not provide any noticeable difference in Al profiles of the passive film formed on the matrix and the carbide phases. Nevertheless, it does indicate high Al content in the matrix phase
  compared with that in the carbide phase
  after complete sputtering of the passive film.
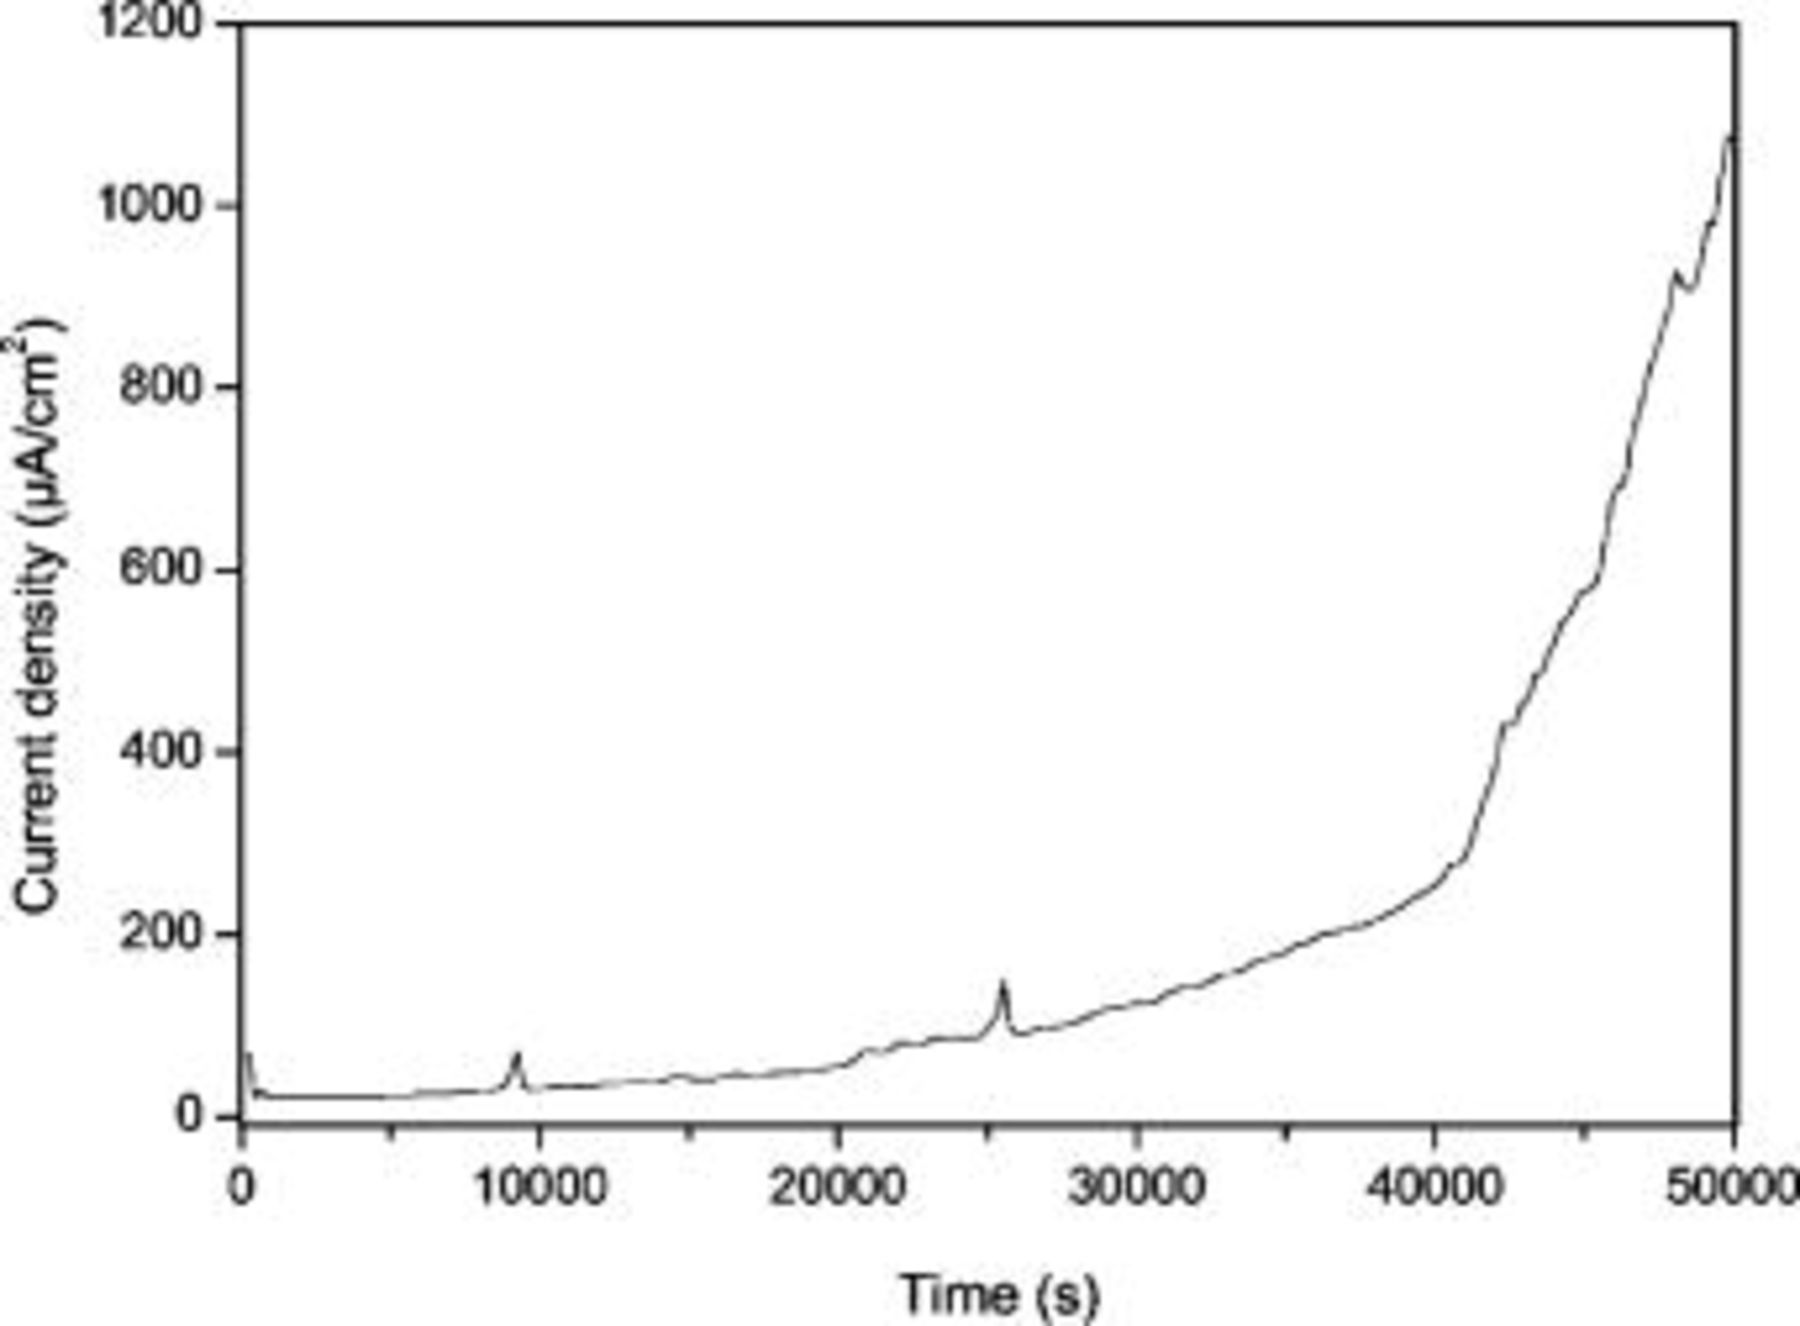
Figure 6. Potentiostatic polarization curve of alloy Fe–16Al–0.5 C at  in
in 
 .
.
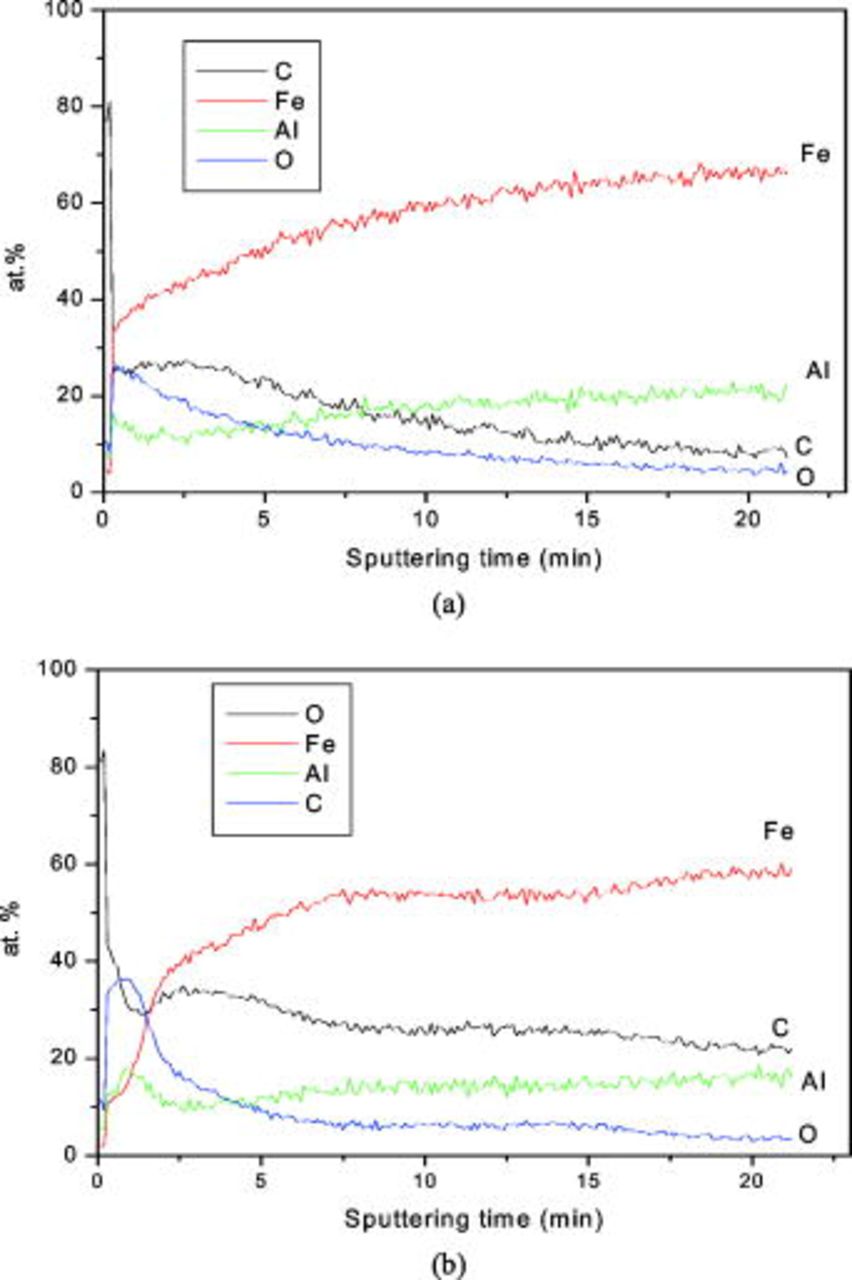
Figure 7. (Color online) AES depth profiles of the passive film formed at passive potential of  in
in 
 : (a) matrix phase and (b) carbide phase.
The AES line profile of C, O, and Al after  of sputtering across the carbide matrix and matrix-metal interface for a range of
  is shown in Fig. 8. From the C signal it is easy to differentiate the matrix, carbide, and interface regions. There is a sudden drop in C profile of the matrix region, which is obviously due to minimal C content in this phase. On the other hand, O profile displays high intensity in the region where the intensity of the C profile is low. In agreement with the spectra in Fig. 7a and 7b, this finding corroborates the formation of a strong oxide film on the matrix phase. The Auger electron line scan of Al does not provide any major difference in its intensity on the passive film of carbide and matrix phases, as this profile is consistent across matrix to carbide. The AES spectra taken on the matrix and carbide phases after complete sputtering off the oxide layer are shown in Fig. 9. No peaks other than the major constituent elements Fe, Al, and C are visible in these spectra, which indicate high-purity iron aluminide. The intensity of the C peak is high in the carbide phase compared with the matrix phase and it is ascribed to the
  ,4 while the presence of carbon in the matrix phase based on the Fe–Al–C phase diagram for
  Al content can be attributed to the solid solution carbides in the
  matrix.22
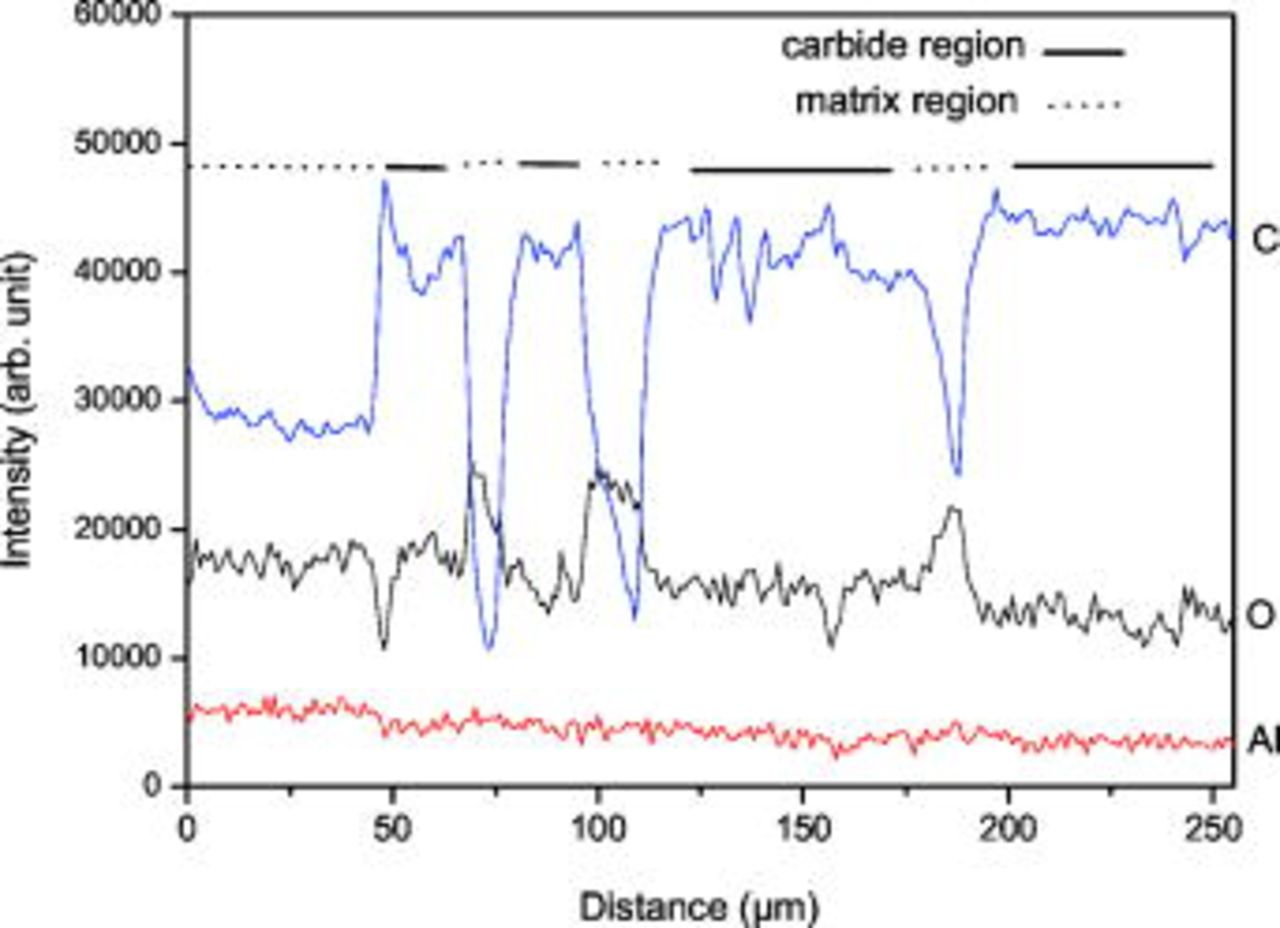
Figure 8. (Color online) Scanning Auger line profile of the passive film formed on the surface of alloy Fe–16Al–0.5 C in 
 .
.
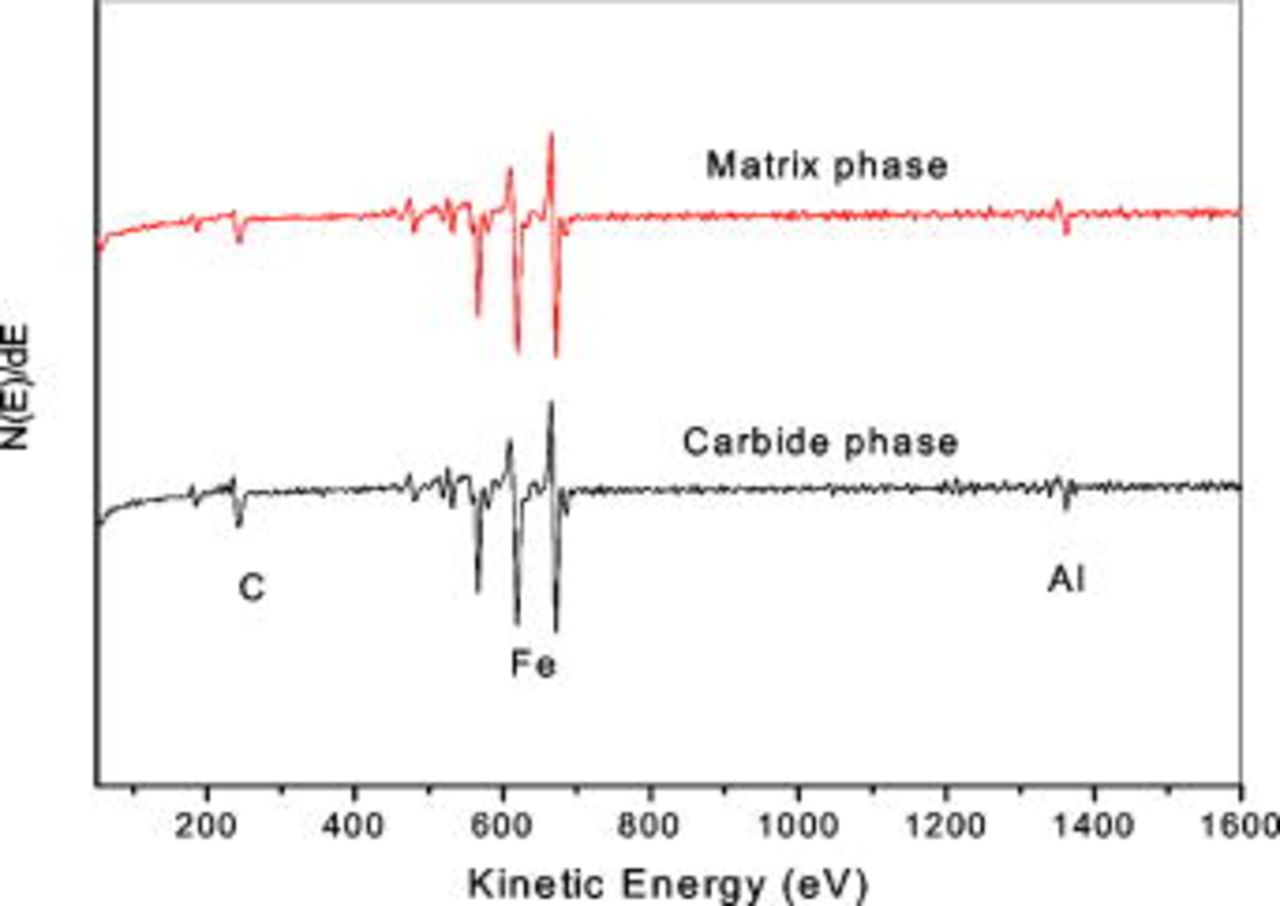
Figure 9. (Color online) Auger spectra obtained from the surface of Fe–16Al–0.5 C alloy after complete removal of the passive film by sputtering from matrix phase and carbide phase.
Discussion
The alloy Fe–16Al–0.5C displays typical active-passive-transpassive behavior in sulfuric acid media. However, it appears from the slop of the passivation line in the passive region (Fig. 4) and also from the increase in the current density during passivation process with time (Fig. 6) that the passive film formed during the passivation process is not very stable. In contrast, the passivation behavior of single-phase iron aluminides without C content is reported to have a stable passive region.11, 23 In the work of Frangini et al. ,23 the current density in the passive region of FeAl-based iron aluminide in  sulfuric acid electrolyte constantly decreased with time before attaining a steady state, which demonstrates an excellent passivation behavior of the FeAl. This comparison highlights that the presence of C in iron aluminide is detrimental to its passivation behavior. Analysis of the anodic polarization curve obtained from the microelectrochemical test of each phase lends further credence to this fact, as the polarization behavior of the matrix phase (Fig. 4a) is stable in the passive region, whereas the carbide phase shows an instability in the passivation behavior (Fig. 4b). Note only that, the passivation behavior of even high volume fraction carbide is poorer than the low volume fraction carbide phase (Table II). This is in agreement with the previous work that passive current density of iron aluminide increases with an increase in volume fraction of the carbides in the alloy.12
Compositionally, the carbide phase appears to be noble to the matrix phase, because of its lower Al content than the matrix phase, and C is noble to Fe and Al. Nonetheless, selective dissolution of the carbide phase suggests that the dissolution of the carbide phase (Fig. 6) is due to its weak chemical composition rather than any galvanic effect. This is unlike DSS, where the high dissolution rate of the ferrite phase is attributed to the galvanic effect between ferrite and austenite phase, because ferrite is considered as an anode.24, 25 A possible chemical reaction for dissolution of the carbide phase is given by Eq. 1. The dissolution of the carbide causes release of C on the surface

At the same time, dissolution of the matrix phase cannot be ruled out and the chemical Reaction 2 is suggested for this

It is possible that the dissolution of the matrix and the carbide phase occurs simultaneously. The higher dissolution rate of the carbide phase that of the matrix phase is due primarily to its higher  value than the latter. A plausible explanation for this could be low Al content in the carbide phase, which causes formation of less tenacious
  passive layer. The generation of the porosity in the carbide phase with release of C further lends credence to this fact. However,
  as well as
  values of overall alloy are high irrespective of the matrix or carbide phase. This fact suggests that coexistence of two phases in
  iron aluminide cause a synergetic effect in corrosion rate. It would be risky to make any comments on
  values for different reasons, including (i) the difference between
  values of matrix and carbide phase is very minimal, (ii) the use of different reference electrodes in macro and microtechnique, though conversion of
  to saturated calomel electrode (SCE) was taken care, and (iii) the OCP of iron aluminide itself is not very stable like other passivating alloys.
On the other hand, the matrix phase has lower  value than is the overall alloy. This can be attributed to the high Al content in the matrix phase compared with that in the overall alloy. However, for the same reason,
  should also be lower in case of matrix phase, but it is not so. A plausible explanation for this could be the use of fine capillary tip in microelectrochemical cell. The formation of oxide and/or deposition of C on the surface close to the capillary tip provide resistance to the flow of current during active to passive transition. In the same manner, Birbilis et al.26 reported that the fine capillary tip has limited access of ionic species to and from the electrode surface during anodic polarization. In addition, blocking of the capillary tip mouth with corrosion products develops an ohmic resistance between the working and counter electrode, which affects the polarization behavior.
There is some difference between polarization curves obtained from micro and macrotechniques with respect to appearance of the secondary anodic peak. This peak appears in the active-passive transition region of the polarization curve obtained from macroelectrochemical techniques, while in polarization curve obtained from microelectrochemical technique it appears in lower passive region. In the macroelectrochemical study, it was attributed to the oxidation of the trapped H atoms at metal-carbide interface either during immersion or polarization in acid solution.12 The existence of secondary anodic peak in the passive region was also reported in DSS using macroelectrochemical study as well as microelectrochemical techniques. Nevertheless, there is a lack of common understanding on the appearance of this peak. In the macroelectrochemical study this was attributed to the dissolution of the two different phases namely α and γ phases,27 while in the microelectrochemical study this was considered to the oxidation of ions in solution from  to the
  oxidation state.15
Like any other passivating alloy, specifically DSS, the difference in passivation behavior of carbide phase and matrix phase in dual-phase iron aluminide may be linked with the chemistry of passive film formed on each phases. In DSS, a difference in corrosion resistance of austenite phase and ferrite phase is attributed to the difference in Cr and Ni atoms in each phase and their enrichment on the surface.28 Resembling Cr in stainless steel, Al is responsible for the passivation behavior of iron aluminides. Frangini et al.11 investigated the chemical structure of the passive film formed on B2 single-phase iron aluminide in 
 media. According to them, a strong enrichment of Al ions on the surface occurs. Moreover, they considered the structure of the passive film as bilayered with the outer layer composed of precipitated mixed aluminum–iron oxy-hydroxide and the inner layer composed of aluminum-rich oxide. In the present study, we found an excellent agreement in SAES analysis with the results obtained from microelectrode technique, as the carbide phase displays poor passivation behavior because the chemistry of the passive film is inferior to matrix phase. What is surprising in this study is that the matrix phase, which having sufficient Al content still does not enrich Al ions on the surface during the passivation process, causing formation of a skinny passive film. On the other hand, a high C concentration on the carbide phase is expected due to dissolution of the carbide phase; however, the presence of high C profile in the matrix phase is unusual. This indicates that the C, which is enriched on the surface after dissolution on the carbide phase, is spread spatially over the matrix surface. A depth profile of C shows its presence not only on the surface but also within the passive film. It is reasonable to conclude that the stagnation of C atoms on the surface causes low intensity of Al ions on the surface and interferes in passive film formation. Note that this behavior is very different from the film formation during oxidation process at high temperature, where C does not interfere with the oxide formation. No trace of C was found in the oxide film formed on the surface of Fe–16Al–1C alloy after oxidation under
 at
at  for
for  .29
.29
High-field ion conduction model30 and place-exchange model31 are widely used to explain the passivation behavior of stainless steels. These models have also been envisaged for the passivation behavior of iron aluminide.8 In the previous study,32 the repassivation behavior of iron aluminide in 
 initially follows the place-exchange model, and then the ion-conduction model. However, no attempt was ever made to verify these models for the passivation behavior of dual-phase iron aluminide. A very first step in these models for formation of passive film is adsorption of atoms on the surface. For subsequent growth of the film, according to the place-exchange model, cooperative rotation of MO pairs is required; an event which becomes less probable with increase of thickness. Due to the accumulation of C atoms at the solution-metal interface in
  alloy, there are limited Al atom sites for the adsorption of O ions for the formation of Al–O pair. Furthermore, the growth of the passive film is blocked due to the presence of surrounding C atoms, which restricts the rotation of Al–O pair. This provides a plausible explanation for the formation of weak passive film on the C containing dual-phase iron aluminide over the single-phase iron aluminide.
Conclusions
Based on the microelectrochemical technique and the SAES analysis we were able to differentiate the corrosion behavior between matrix phase and carbide phase of a dual-phase  alloy in
 . The following conclusions are drawn from this study.
The matrix phase possesses better passivation and corrosion resistance behavior than does the carbide phase. The overall electrochemical corrosion behavior of the alloy is mostly controlled by the matrix phase.
From the SAES analysis, it was revealed that the corrosion resistance of the matrix phase is superior to that of the carbide phase, due primarily to the higher stability of passive film formed on the matrix phase than that on the carbide phase.
Dissolution of the carbide phase causes enrichment of C on the surface and spreading over the matrix phase. The enriched C on the surface interferes in the formation of passive film.
ICP analysis revealed that both Fe and Al dissolve at a similar rate from the alloy during polarization in an acid electrolyte. The dissolution rate of the carbide phase is higher than that of the matrix phase.
Acknowledgments
V.S.R. thanks Professor V. S. Raja of IIT, Bombay, India and Dr. R. G. Balgidad of DMRL, Hyderabad, India for providing the material. This work was partly supported by the Brain Korea 21 project.
The Korea Advanced Institute of Science and Technology assisted in meeting the publication costs of this article.