
Abstract
Kinetic Monte Carlo simulations are used to investigate nucleation and early stages of growth during metal electrodeposition at low overpotentials, where the kinetics of attachment of atoms to the electrode surface is rate-limiting. The surface diffusion energy barriers and deposition rate constants were varied to determine their effects on the deposition of metal onto a (111)-oriented facet of a face-centered cubic substrate material. The cluster density, average cluster size, and average cluster height were obtained from simulations. Over the range of parameters investigated here, the highest cluster densities were achieved when the metal-on-substrate surface diffusion rate was low relative to the metal-on-metal surface diffusion rate. It was found that the cluster density was highest after 0.3 equivalent monolayers had been deposited.
Export citation and abstract BibTeX RIS
While many theoretical studies of nucleation and growth during electrodeposition have been carried out for the case of diffusion-limited conditions, there is growing interest in kinetically limited behavior under which, for example, small metal clusters can be formed at low applied overpotentials or in the presence of additives. Such phenomena are important for advanced on-chip interconnect technology where achievement of high nucleation density is required as feature dimensions shrink. In addition, while most current theoretical methods for diffusion-controlled behavior during nucleation and growth of electrodeposits are based on continuum equations, the growing focus on atomic-scale phenomena suggest that stochastic methods should be developed to track the details of surface reactions and transport processes associated with deposition and shape evolution processes. In this work, a kinetic Monte Carlo (KMC) approach has been used to simulate kinetically limited electrodeposition of a metal onto the surface of a substrate.
Continuum theories for nucleation and growth during electrodeposition are used to analyze experimental measurements of current or potential transients, following methods pioneered by Fleischmann and Thirsk1 and by Scharifker and Hills.2 Considerable literature based on continuum theory has been developed for diffusion-limited systems.3–7 Several recent articles review advances in the use of continuum theory for extraction of nucleation rates from various transient measurements carried out under diffusion-limited conditions,8–13 including island growth.14 A relatively smaller number of investigations has been reported on kinetically limited nucleation. Tsakova and co-workers15 used continuum theory along with Monte Carlo simulations to track behavior of random deposition sites during progressive nucleation under combined charge-transfer, diffusion, and ohmic limitations to investigate how the nucleation kinetics affected the spatial distributions of clusters on the surface. Recently, Cao and West16 performed continuum simulations of progressive nucleation under kinetically limited conditions and found that the time when the peak in the current transient occurs increases as the nucleation rate constant decreases.
It has been recognized in nonelectrochemical applications that KMC simulation methods provide powerful simulation tools for understanding nucleation and growth processes,17 as well as crystal growth phenomena associated with device fabrication.18, 19 Numerical studies have been carried out with the KMC method to investigate the effect of temperature on the nucleation process during deposition from the gas phase.20 In addition, various KMC simulation models have been used to simulate nucleation onto patterned substrates,21 as well as self-organized island growth22 and evolution of nanoporosity during dealloying in nonelectrochemical systems.23 In applications where surface reaction and transport processes are critically important, such as molecular beam epitaxy24, 25 and chemical vapor deposition,26  solid-on-solid KMC models have been used to simulate deposit growth and surface roughness. Monte Carlo models have also been used to interpret experimental data obtained during early stages of nanocluster nucleation and growth on semiconductors,27 in which the model parameters were chosen to fit the available information.28
Alkire, Braatz, and co-workers have recently developed a multiscale approach to integrate simulations with experimental data in order to investigate the effect of surface additives on mesoscale morphology evolution during copper electrodeposition.29, 30 A KMC code was used with coarse-graining in a simulation domain that had the same pixilation as images of surface roughness obtained from experiments with an atomic force microscope (AFM). The mesoscale KMC code was externally coupled to a continuum-scale finite difference code that simulated diffusion and migration of species from the bulk solution to the surface. Parameter sensitivity simulations31 were used to target the key parameters associated with proposed complex surface reaction mechanisms that involve solution additives, and experimental data generated with use of a D- optimal design procedure were used to estimate values for the most sensitive parameters. The parameters were then used in additional codes to simulate shape evolution during infill of sub-sub-micro meter trenches encountered in fabrication of on-chip interconnects in microelectronic devices,32 as well as wafer-scale processes.33
In the current study, we extend the foregoing methodology to the atomic scale in order to address kinetically limited nucleation and growth during early stages of electrodeposition on a dissimilar substrate in the absence of additives. The method provides the ability to evaluate the effect of the overpotential and surface diffusion energetics on surface reaction and transport processes associated with surface morphology evolution during nucleation and overgrowth during electrodeposition.
Description of the Simulation Model
The simulation model represents an idealized system in order to focus on interactions between the deposited metal (M) and substrate (S) for several limiting cases of behavior involving relative rates of charge transfer and surface diffusion. The geometric details of the substrate and deposited metal were purposely kept simple, as was the reaction chemistry. The objective is to simulate the range of deposit morphologies that arise for various combinations of the rate of deposition and surface diffusion. The following paragraphs summarize the procedures; additional details are available elsewhere.34
The initial configuration of the surface was an atomically flat (111) facet of a face-centered cubic substrate (S). Atoms deposited on the surface are placed at sites that represent an extension of the fcc substrate with the same spacing. A metal atom deposited on the surface has a minimum coordination number of three, i.e., threefold hollow sites. A  solid-on-solid KMC algorithm was constructed for simulating deposition, several features of which were originally developed for coarse-grained simulation studies on larger systems.35 By this approach, the lattice consists only of 2D "interface" sites on the surface; the roughness is accounted for in the "
 " component.36 Only the atoms on the
  surface are tracked by the KMC code; neither atoms buried in the deposit nor species in the solution are tracked. An atom is "buried" when all its attachment points are occupied, i.e., when its coordination number is
  . An atom in a terrace site has a coordination number of 9: three near neighbors in the plane below and six near neighbors in the terrace. In principle, a terrace atom can jump onto the terrace to become an adatom (coordination number 3); however, the activation energy is very large
  and hence the probability is very low. An atom in a terrace with at least one near-neighbor atom in the plane above is precluded from jumping onto the terrace. However, if the atoms in the plane above diffuse away, then the atom has a probability, albeit very low, of jumping onto the terrace.
The reaction mechanism involves the electrochemical reduction of  ions in solution and the diffusion of metal atoms (M) on the surface. Simulations were performed under conditions of low applied potential and short duration for which depletion of
  due to diffusion limitations was insignificant. Therefore, a constant
  concentration was used at all surface sites for all times during the simulations.
Metal ions at the electrode surface were reduced on either the substrate S or previously deposited metal M atoms. There are no adsorbed metal ions; that is, metal ions in solution were not explicitly included in the simulation, other than that they were available to be reduced to metal adatoms. It was assumed that the system is sufficiently far from the equilibrium potential that anodic dissolution can be neglected. The deposition rate of M on M was computed35 by
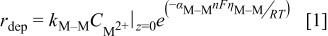
where all symbols are defined at the end of the text, with  being the concentration of
  ions in solution at the electrode solution interface. The overpotential
  is defined as the difference between the applied potential and the equilibrium potential for the
  couple. In an analogous manner, the deposition rate of M on S was computed by
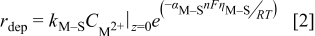
where the overpotential  is defined as the difference between the applied potential and the nucleation overpotential which, for the present example, was assumed to be offset by
  from the equilibrium potential (see Table II for parameter values). The difference between Eq. 1, 2 is in the values of
  and
and  , and the overpotential; the transfer coefficients were assumed to be the same for the results reported below. If an ion reacts where it has both S and M attachment points, the overpotential was taken to be the arithmetic average based on the number of attachment points.
Table II. Base case physicochemical parameters used in the KMC simulations.
| Parameter | Value |
|---|---|
Deposition rate constant for M on M, 
|
|
| Equilibrium potential for M deposition on M |

|
Charge-transfer coefficient for M deposition on M, 
| 0.5 |
Deposition rate constant for M on S, 
|
 to to 
|
| Nucleation overpotential for M deposition on S |

|
Charge-transfer coefficient for M deposition on S, 
| 0.5 |
Jump frequency for M surface diffusion on M, 
|
|
Energy barrier for breaking a M–M bond, 
|

|
Jump frequency for M surface diffusion on S, 
|

|
Energy barrier for breaking a M–S bond, 
|
|
Temperature, 
|

|
| Applied potential |

|
 concentration at surface concentration at surface |

|
The deposited metal atoms are permitted to surface diffuse on either the substrate S or on previously deposited metal atoms. The KMC approach captures the essential physics of surface thermodynamics. For example, compare an adatom on a terrace with an atom in a step. The barrier for the adatom to attach to the step is the same as to diffuse across the terrace, so thermodynamically, one sees no difference. However, the barrier to jump back off the step onto the terrace is much larger, making this rate smaller. In equilibrium, the ratio of concentration of atoms on the step to the terrace is equal to the ratio of the rate of hopping off the step to hopping on the step. This observation exemplifies the requirement of microscopic reversibility, which is not violated by the rate laws used here. The rate of metal-on-substrate surface diffusion35 was computed by
where  is the sum of the energy barrier contributions between species M and species S for all of the nearest neighbor atoms. The activation energy for surface diffusion was assumed to be related to the number of near-neighbor bonds that have to be broken, an assumption that is used in a wide variety of models in chemical systems. An atom in a kink site has a lower probability than an adatom of jumping to an adjacent site. As a metal atom gains more nearest neighbors, it becomes more energetically unlikely for the metal atom to diffuse. An analogous equation was used to compute the rate of metal-on-metal surface diffusion. For metal atoms on the substrate coordinated also to previously deposited metal atoms in the same plane, the arithmetic average based on the number of attachment points was used. Diffusing metal atoms were restricted to making hops either in the same plane to a nearest-neighbor site or up or down one atomic step in a single KMC iteration.
A consequence of these assumptions is that the critical nucleus size is determined by the rate of attachment of metal atoms on the substrate, the rate of attachment of metal atoms to growing metal islands, and the rate of surface diffusion.
Method of Solution and Postprocessing
In the system there are N particles representing metal ions in solution and metal atoms on the substrate that can undergo  transition events,37 each of which has an associated rate,
  . Table I lists the transition events and the energy barriers associated with particular configurations. The energy barrier for a hop depends only on the current configuration of the
  surface at the start of each KMC time step. The crystallography is included in the model, so that an adatom on a terrace has three bonds, an atom in a terrace has nine bonds, etc.
  is a bond energy and
  is the activation energy for diffusion.
Table I. Transient events and energy barriers for particular configurations encountered in KMC actions.
| Energy barriers for surface diffusion | Value |
|---|---|
| Lone M on substrate |

|
| M on substrate with one M nearest neighbor |
|
| M on substrate with two M nearest neighbors |
|
| M on (above) one M |

|
| M sitting on a trio of Ms |

|
| M that is part of a complete monolayer of M |
|
| M that is part of a complete second M layer |

|
The  particles are partitioned over the possible transition events. Once the rates of the events are calculated, a list of transition probabilities was constructed in terms of the rates in such a way that there is a dynamic hierarchy established between the rates. The individual transition probabilities are
where  . A sufficiently large system was used to maintain the independence of the events, which was verified by computing the autocorrelation function of output parameters of the simulations.
The KMC algorithm is similar to those described by Levi and Kotrla38 and Battaile et al. :39
- (1)Choose a random number,
 , from a uniform distribution in the range (0,1).
 - (2)Select the transition event from the list by selecting the first index for which .
- (3)Proceed with.
- (4)Update all that have changed as a result of making the move.
- (5)Advance the time in the simulations by Δτ, where


and  is the number of particles out of
  that are capable of undergoing a transition event with rate
  , the subset of all rates consisting of the unique values for each event type in that set.40, 41 This algorithm decreases the simulation time by binning the rates by type. Each time a rate is selected, an instance of that rate is executed. The instance of the rate is selected based on the same random number generated to select which rate is executed.
The KMC algorithm can be implemented in several different ways. The goal is to implement the algorithm in a computationally efficient manner so that a large simulation domain can be used. The following describes details on how the algorithm is coded, including the storage and search algorithms that are used.
- (1)Information about each rate is stored in a matrix. The site number is unique for each site on the surface. Periodic boundary conditions are used in the and directions.
- (2)At the beginning of the simulation, all of the rates for all possible moves are tabulated and cataloged. These rates are only recalculated when a move occurs at a site or one of its eight nearest-neighbor sites.
- (3)All of the possible rates in the system are binned to create a list that is used to select which events occur.
- (4)The rates are normalized and a random number is generated on the interval.
- (5)Once the random number is generated, the appropriate event is selected from the list.
- (6)An instance of that event is selected from the bin for that rate and the action is executed.
- (7)The appropriate neighbor rates are updated in the site list depending on the action that is taken.
- (8)The time in the system is updated and the process is repeated from steps 3–8 until the user-specified deposition time has been reached.


All simulations were run on the IA32 Linux Cluster at the National Center for Supercomputing Applications (NCSA), University of Illinois. Most simulations required less than an hour to complete.
The KMC simulations produced a variety of outputs, including snapshots of the surface morphology and statistical data. A simulation data postprocessor computed the cluster density, cluster size distribution (based on the number of atoms in a cluster), the average and standard deviation of the cluster size, the cluster height distribution (the cluster height was defined as the maximum height at any point on a cluster), the average and standard deviation of the cluster height, the cluster aspect ratio distribution (the aspect ratio was defined to be the ratio of the cluster height to the cluster size), and the average and standard deviation of the cluster aspect ratio. For the purposes of analysis, a cluster was defined as a group of two or more adjacent metal atoms.
Physicochemical Parameter Values and Sensitivity to Lattice Size
Physicochemical parameter values
Table II lists the values of the base case physicochemical parameters used in the simulations. The results reported here consider the specific case of deposition of a divalent metal ion such as  . Some of the physicochemical parameters required to simulate the mechanism were available either from the literature or from experimental data. Unknown parameters were estimated and varied in the simulations to determine their effect on the outputs. The value of the rate constant for metal-on-metal deposition
  was determined from experiment.42 The rate constant for metal-on-substrate deposition
  was varied from
 to
to 
 , and these values were estimated from experimental data.42 The transfer coefficients for metal ions on substrate
  and on metal
  were assumed to be 0.5. The value of the equilibrium potential for the
  couple was set to a reference value of zero, and the nucleation overpotential was offset from the equilibrium value by
  . The value for the jump frequency for surface diffusion of metal atoms on M islands
  was taken from literature values for copper.43 The same value was assumed for the jump frequency for metal atoms on the substrate, the energy barrier for metal-on-metal surface diffusion
  44 was varied from
 to
to 
 . The energy barrier for metal-on-substrate surface diffusion
  was also varied from
 to
to 
 .44
.44
Effect of lattice size
Five different lattice sizes ( ,
,  ,
,  ,
,  , and
, and  ) were used with the KMC simulation code and the physicochemical parameters listed in Table II. For each lattice size, twenty simulations were run, each with a different seed number in the random number generator in order to reduce the noise from a single KMC simulation and to allow computation of better statistics. Figure 1 depicts simulation outputs for several characteristic features of the deposited clusters over the range of 0.1–0.5 equivalent monolayers (ML). The error bars at each point denote the standard error (which was computed as the standard deviation divided by the square root of the number of simulations). It may be seen in Fig. 1a, 1b and 1c that the cluster density, average cluster size, and average cluster height do not vary appreciably with the choice of lattice size. However, Fig. 1d indicates that the average aspect ratio of the islands varies appreciably with the lattice size but approaches an asymptote for the larger lattice sizes. Since the
  simulations require three times more computational time than the
  lattice simulations, and the difference in the outputs of the two lattice sizes was not statistically significant, a
  lattice was used in the simulations described below.
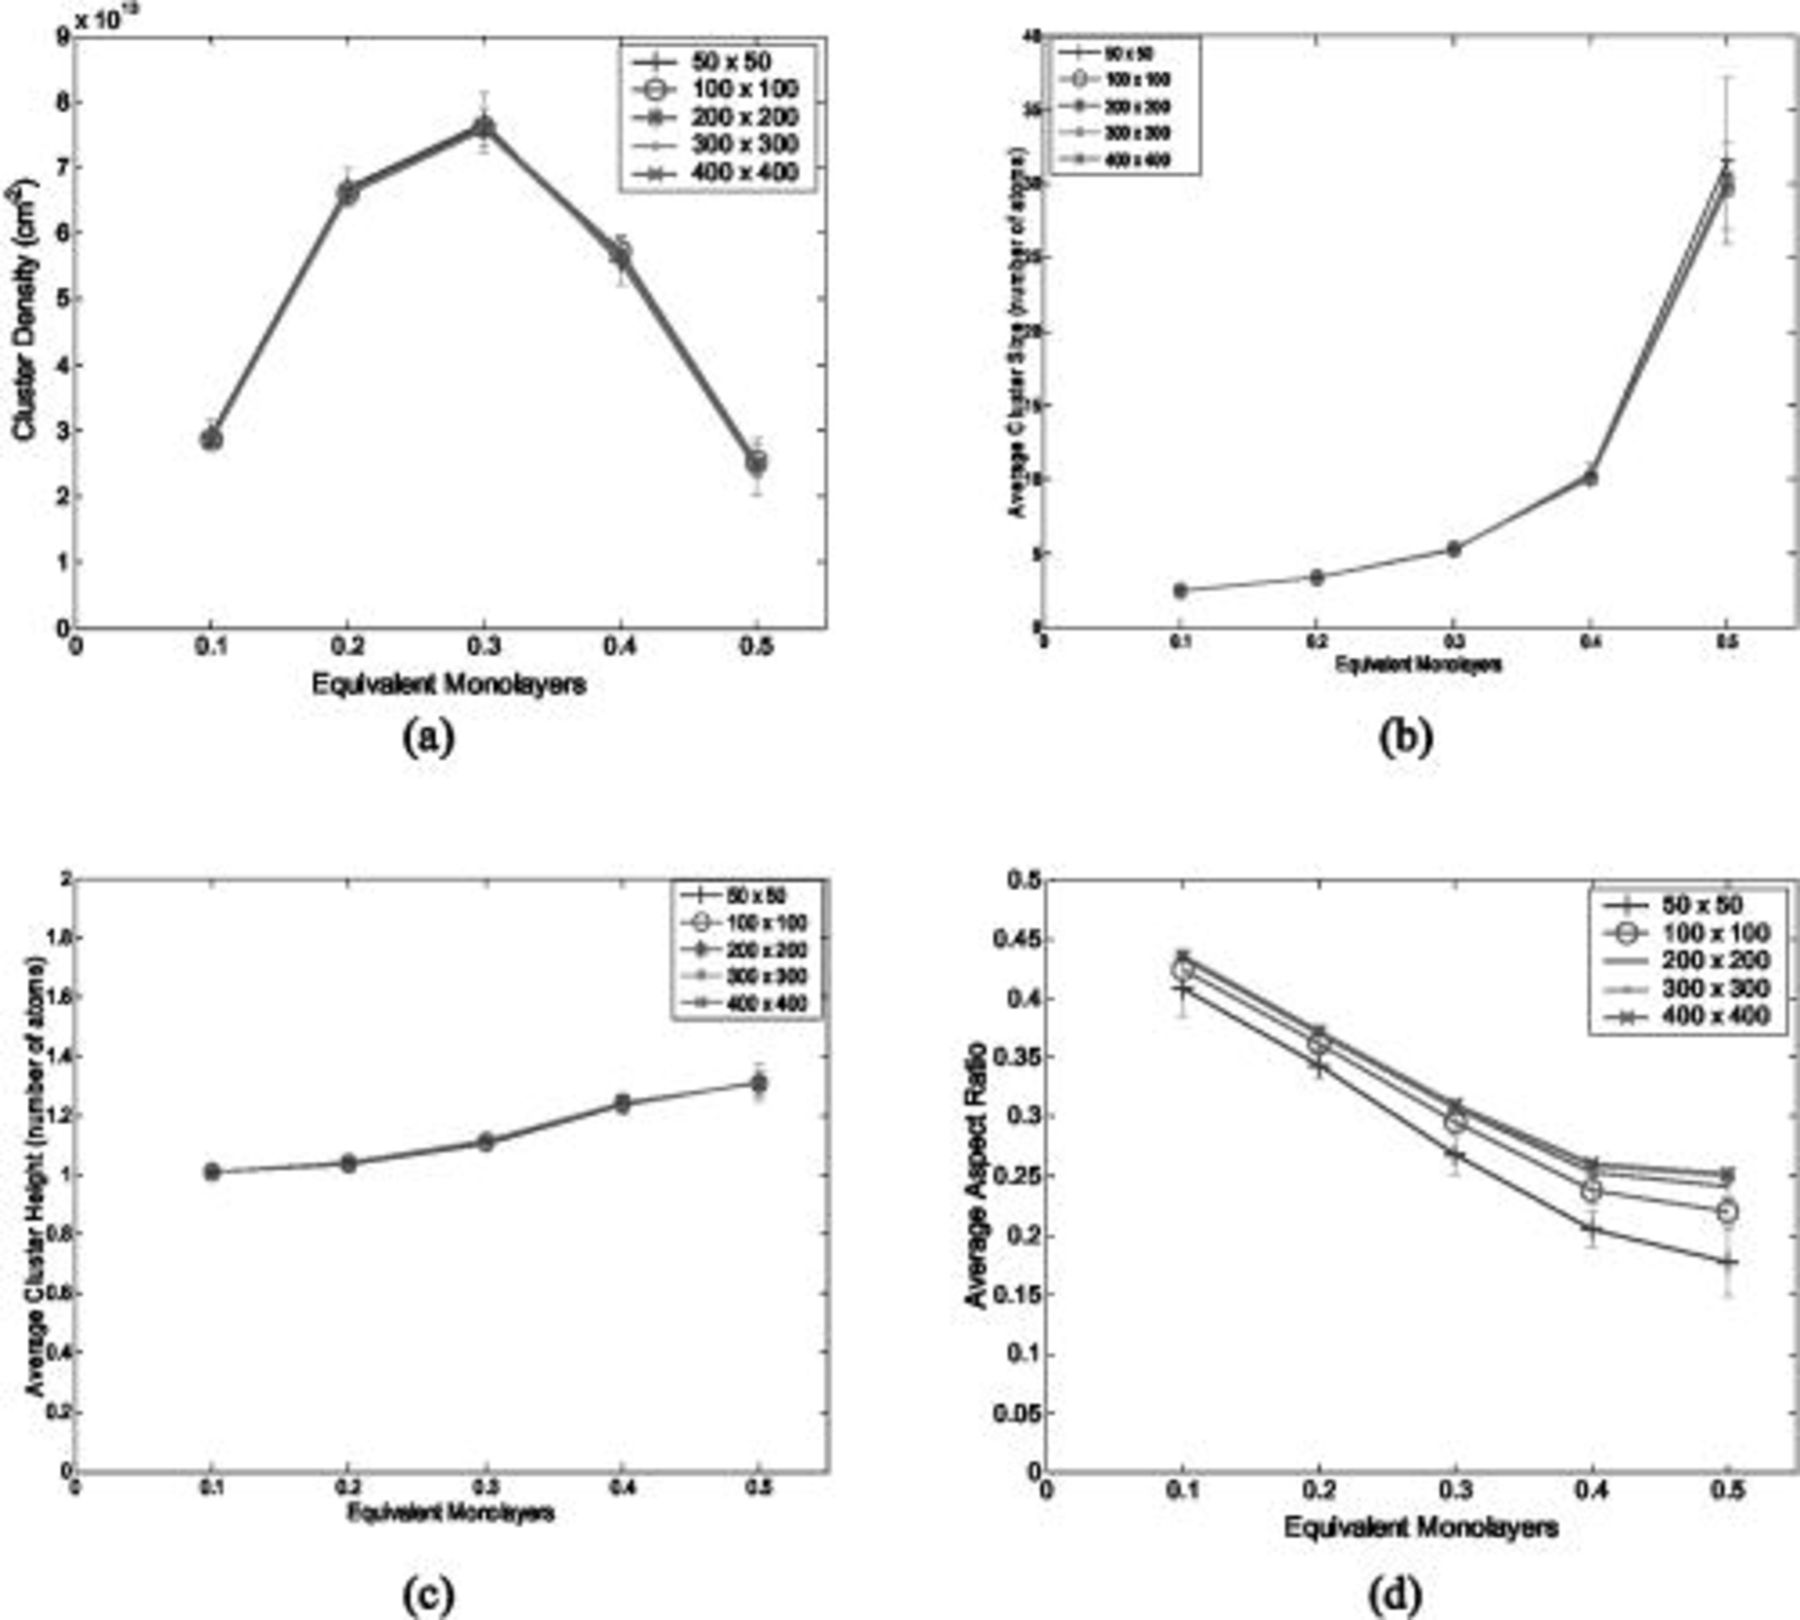
Figure 1. Effect of lattice size on simulation outputs: (a) cluster density, (b) average cluster size, (c) average cluster height, and (d) average cluster aspect ratio.
Simulation Results and Discussion
The initial parameters used in the simulations are for metal atoms deposited onto a (111) substrate. In the first set of simulations, all parameters available from the literature or experiment were fixed and all unknown parameters were perturbed around known or estimated ranges of the parameters. In the second set of simulations, the parameters that did not have a significant effect on the simulation outputs in the original ranges were varied over wider ranges.
Simulations of metal deposition onto a (111) substrate
Simu lations of metal deposition onto a (111) surface were performed for 0.5 equiv ML of metal deposited. Three parameters were perturbed in these simulations: the rate constant for metal-on-substrate deposition  , the energy barrier for metal-on-substrate surface diffusion
  , and the energy barrier for metal-on-metal surface diffusion
  . Table III provides data on the cluster density as a function of the surface diffusion energy barriers for a metal-on-substrate deposition rate constant,
  and as a function of the amount of deposited metal. By comparing entries in rows 1 and 3, or 2 and 4, it may be seen that the cluster density does not vary appreciably as a function of the energy barrier for metal-on-metal surface diffusion
  over the range of 0.1 to 0.3 ML. After 0.4–0.5 ML have been deposited, the rightmost two columns indicate that the cluster density becomes higher for lower values of
  . For lower values of
  the metal atoms that deposit on the metal clusters can more readily diffuse onto the substrate. If the metal-on-substrate diffusion rate is faster than the metal-on-metal rate, then the atoms could diffuse away and form more clusters.
Table III. Cluster density as a function of the M–M  and M–S
  surface diffusion energy barrier for M–S deposition rate constant
  after (a) 0.1, (b) 0.2, (c) 0.3, (d) 0.4, and (e) 0.5 ML of deposition.
| Surface diffusion energy barrier (eV) | Cluster density 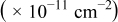
| |||||
|---|---|---|---|---|---|---|

|

| 0.1 ML | 0.2 ML | 0.3 ML | 0.4 ML | 0.5 ML |
| 0.26 | 0.26 |

|

|

|

|

|
| 0.46 | 0.26 |

|

|

|

|

|
| 0.26 | 0.46 |

|

|

|

|

|
| 0.46 | 0.46 |

|

|

|

|

|
During the early stages of electrodeposition (see Table III for 0.1 ML), the cluster density is higher for low values of the energy barrier for metal-on-substrate surface diffusion  . For higher values of
  , the metal atoms diffuse less after deposition on the substrate, which leads to a high concentration of metal adatoms on the surface. Because single metal atoms are not counted as clusters, the cluster density is lower for large values of
  during the early stages of deposition. During the latter stages of deposition (see Table III, 0.2–0.5 ML), the cluster density is highest when the energy barrier for metal-on-substrate surface diffusion
  is largest. Under these conditions the metal atoms cannot readily diffuse to low-energy sites on the substrate surface, such as kink sites, to incorporate into existing clusters. The cluster density reaches a maximum upon deposition of 0.2–0.3 equiv ML, after which the clusters begin to coalesce and the number of individual clusters on the surface is reduced.
Table IV presents simulation data showing the dependence of the cluster density, average cluster size, average cluster height, and the average cluster aspect ratio on the energy barriers for metal-on-metal  and metal-on-substrate
  surface diffusion, under the conditions that with
  after deposition of 0.5 equiv ML. It may be recognized that the average cluster size is largest when
  is small and
  is large, a result which seems reasonable because larger clusters form when surface diffusion of the metal-on-substrate is fast in comparison to the rate of metal-on-metal diffusion. It is also seen that the average cluster height is largest for fast metal-on-substrate surface diffusion rates and is relatively unaffected by the variation in the rate of metal-on-metal surface diffusion. For fast metal-on-substrate surface diffusion (small
  ), the metal adatoms can readily diffuse to clusters, resulting in a higher average cluster height. Also, it is seen that the average cluster aspect ratio is largest for slow metal-on-substrate surface diffusion (large
  ) and is relatively unaffected by the rate of surface diffusion on the clusters
  . The aspect ratio of the clusters is largest for slow metal-on-substrate surface diffusion where the clusters are small. For fast metal-on-substrate surface diffusion the clusters are somewhat higher but have many more atoms per clusters, resulting in a higher aspect ratio.
Table IV. Four simulation outputs: (a) cluster density, (b) average cluster size, (c) average cluster height, and (d) average cluster aspect ratio as a function of the M–M  and M–S
  surface diffusion energy barrier for M–S deposition rate constant
  after 0.5 ML of deposition.
| Surface diffusion energy barrier (eV) | Output parameter at 0.5 ML | ||||
|---|---|---|---|---|---|

|

| Cluster density 
| Average cluster size | Average cluster height | Average aspect ratio |
| 0.26 | 0.26 |

|

|

|
|
| 0.46 | 0.26 |

|

|

|
|
| 0.26 | 0.46 |

|

|

|
|
| 0.46 | 0.46 |

|

|

|
|
Table V provides simulation results for the dependence of cluster density on the metal-on-substrate deposition rate constant  for various energy barriers after deposition of 0.5 ML. By looking across entries in each row, it may be seen that the cluster density is relatively insensitive to changes in the value of
  over the range of parameters.
Table V. Cluster density as a function of the M–M  and M–S
  surface diffusion energy barrier for M–S deposition rate constant
  =(a)
=(a)  , (b)
, (b)  , and (c)
  after 0.5 ML of deposition.
| Surface diffusion energy barrier (eV) | Cluster density  at 0.5 ML at 0.5 ML | |||
|---|---|---|---|---|

|

|
 Deposition rate constant Deposition rate constant 
|
 Deposition rate constant Deposition rate constant 
|
 Deposition rate constant Deposition rate constant
|
| 0.26 | 0.26 |

|

|

|
| 0.46 | 0.26 |

|

|

|
| 0.26 | 0.46 |

|

|

|
| 0.46 | 0.46 |

|

|

|
The simulations reported in Tables III, IV and V show that when the energy barriers for surface diffusion of metal atoms on the islands  or on the substrate
  are sufficiently large, there is negligible influence on the parameters that we use to characterize the islands (density, height, etc.). That is, there are threshold values of these parameters; the trends reported in the tables are for values at just above the threshold. We interpret these thresholds to indicate that when the energy barrier is sufficiently large the diffusion time is long in comparison to the deposition rate and hence surface diffusion does not significantly influence island nucleation and growth. The threshold energies, however, are not unique values because they depend on the deposition rates
  and
and  . In this paper our intention is to explore the range of behavior in this system, and in particular, the regimes where the nucleation and growth is influenced by either kinetics and/or surface diffusion.
Multiple parameter perturbation simulations
The foregoing results indicated that for the range of parameter values investigated in this work, simulation outputs were sensitive to the energy barrier for metal-on-substrate surface diffusion  but insensitive to the rate constant for metal-on-substrate deposition
  . In general, however, neither of these parameters are known. In the following paragraphs, these two parameters were varied over a wider range of parameter space to determine under what conditions higher cluster densities might be achieved. For these simulations, the energy barrier for metal-on-metal surface diffusion
  was set to
 . The value of
  was selected in such a way that metal islands were hemispherical or spherical segments. All other parameters were set at the values listed in Table II. The energy barrier for metal on substrate surface diffusion
  was varied over the range of
 to
to 
 . The rate constant for metal-on-substrate deposition
  was varied over the range of
  to
to  . In addition to intellectual curiosity, the range of parameters considered here was investigated because their effective values might be achieved by introducing additives into the electrochemical solution.
The following results are reported in terms of the ratio of rate constants  and the ratio of energy barriers for surface diffusion
  . Table VI provides simulation results for the cluster density vs the rate constant ratio and the surface diffusion energy barrier ratio as a function of the amount of metal that has been deposited. For 0.1 ML, the cluster density is lowest for large
  , where
  is small. Under these conditions, there are few clusters on the surface and the metal atoms have time to diffuse to the clusters before more metal atoms are deposited. The highest cluster density is attained for small
  (large
  ), where the atoms are deposited onto the substrate surface and cannot easily diffuse to existing clusters. Moreover, for large values of both
  and
and  , smaller cluster densities are formed because the metal atoms on the substrate diffuse slowly and are captured in clusters by depositing metal atoms. At the highest values of these ratios, the adatom concentration is large.
Table VI. Cluster density as a function of the deposition rate constant ratio and the surface diffusion energy barrier ratio for  (or
(or  ) after deposition of (a) 0.1, (b) 0.2, (c) 0.3, (d) 0.4, and (e) 0.5 ML.
| Ratio | Cluster density 
| |||||
|---|---|---|---|---|---|---|
Surface diffusion energy barrier ratio 
| Deposition rate constant ratio 
| 0.1 ML | 0.2 ML | 0.3 ML | 0.4 ML | 0.5 ML |
| 1.05 | 1000 |

|

|

|

|

|
| 0.35 | 1000 |

|

|

|

|

|
| 1.05 | 0.1 |

|

|

|

|

|
| 0.35 | 0.1 |

|
 
|

|

|

|
The data in Table VI show that the highest cluster density was attained after deposition of 0.3 equiv ML. Subsequently, the clusters begin to coalesce and the cluster density decreases. As deposition proceeds to 0.5 ML, the highest cluster density is achieved when the rate constant ratio  is high and the surface diffusion energy barrier ratio
  is low. The table values at 0.5 ML also show that high cluster densities are obtained for small
  independent of
  .
.
Table VII provides simulation results for the dependence of deposit characteristics (cluster density, average cluster size, average cluster height, and the average cluster aspect ratio) on the parameter ratios (surface diffusion energy barrier ratio  , and rate constant ratio
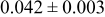
  ) after deposition of 0.5 equivalent ML. Figure 2 provides images of the surface after deposition of 0.5 equiv ML; the four snapshots represent "closeup" views of a portion of a
  lattice for a single seed number. The four images correspond to values of parameters in the four rows of Table VII. In Fig. 2a, the cluster density is the highest. For these conditions, nucleation by M-on-S deposition is hindered, and surface diffusion of adatoms on S is slow, resulting in the highest nucleation density of the four cases investigated here. Only by the direct deposition of three adjacent adatoms is a threefold hollow site likely to be formed, on which subsequent M-on-M deposition would occur readily. In Fig. 2c, M-on-S deposition is facile, and surface diffusion of adatoms on S is slow, with the result that threefold hollow sites form more readily, onto which subsequent M-on-M deposition can take place although the rate constant is relatively slow; the cluster density is high but not as high as in Fig. 2a. Figure 2b corresponds to the case where
  is large and
  is small. Deposition of adatoms on S is facile, and the adatoms are mobile so they can readily form clusters. The M-on-M rate constant for deposition on the threefold hollow sites, however, is relatively low so that clusters grow primarily by accretion of mobile adatoms. The cluster density is seen to be low. In Fig. 2d, a single pyramidal cluster has formed on the surface; a single adatom can also be seen on the surface. For this case where both
  and
and  are large, adatoms nucleate with difficulty on S, but then move with ease over the surface. As adatoms join to form threefold hollow sites, direct deposition of M-on-M also occurs. Clusters continue to grow by continued accretion of mobile adatoms as well as by direct deposition of M-on-M. The single cluster in Fig. 2d is seen to have a pyramidal shape, which has been observed experimentally in the copper–gold system.45 The average cluster size is largest for large
  , that is, larger clusters form when metal-on-substrate surface diffusion is fast. The highest nucleation density is found for small ratios of
  and large ratios of
  .
.
Table VII. Four simulation outputs: (a) cluster density, (b) average cluster size, (c) average cluster height, and (d) average cluster aspect ratio as a function of the M–M  and M–S
  surface diffusion energy barrier for various M–S deposition rate constant ratios and M–S surface diffusion energy barrier ratios.
| Ratio | Output parameter at 0.5 ML | ||||
|---|---|---|---|---|---|
Surface diffusion energy barrier ratio 
| Deposition rate constant ratio 
| Cluster density 
| Average cluster size | Average cluster height | Average aspect ratio |
| 1.05 | 1000 |

|

|

|

|
| 0.35 | 1000 |

|

|

|
|
| 1.05 | 0.1 |

|

|

|
|
| 0.35 | 0.1 |

|

|

|
|
Figure 2. Snapshots of the surface after 0.5 ML of deposition for the cluster density as a function of the deposition rate constant ratio and the surface diffusion energy barrier ratio. The conditions correspond to the parameter values given in Table VII: (a)  ,
,  ; (b)
; (b)  ,
,  ; (c)
; (c)  ,
,  ; (d)
; (d)  ,
,  .
.
The use of dimensionless parameter ratios may be helpful because they can indicate the relative importance of two phenomena, and may thus facilitate the engineering design of systems to achieve certain cluster morphologies. Based on the simulation results obtained in this work, decreasing the surface diffusion energy barrier ratio  would promote high nucleation densities and thus the rapid formation of continuous thin films, as required for applications such as superfilling of small trenches and vias during fabrication of on-chip interconnects.
Conclusions
A stochastic simulation model of kinetically limited electrodeposition of metal atoms onto a (111) substrate was developed and the effects of physicochemical parameters on the simulation outputs were observed. The energy barrier for metal-on-substrate surface diffusion had the strongest effect on the cluster density in the parameter regimes investigated here, while the energy barrier for metal-on-metal surface diffusion had a weak effect. The metal-on-substrate rate constant  had a strong effect on the formation of metal clusters when its value was perturbed over several orders of magnitude. The cluster density was the highest after deposition of 0.3 equiv ML, which is when the clusters begin to coalesce and the number of individual clusters on the surface is reduced. The highest cluster densities were achieved when the surface diffusion energy barrier ratio
  is low (i.e., slow metal-on-substrate diffusion relative to metal-on-metal surface diffusion). Electrochemical systems where these conditions can be met can be expected to have high cluster densities.
KMC simulations like those performed here provide a computationally inexpensive way to determine the effect of atomistic interactions on the cluster morphology during electrodeposition. KMC simulation codes make possible the study of nucleation during electrodeposition at low applied potentials, where attachment-limited kinetics prevail, as opposed to diffusion-limited regimes where most theoretical studies have been performed.6 Within the context of on-chip interconnect applications, electrodeposition under kinetic control offers the promise of fabricating thin metal films by achieving high nucleation density of metal nanoclusters.
The simulation approach presented in this work has the potential to contribute well beyond the pristine examples described here for its initial development. For example, the approach may be extended to investigate more complicated initial substrate configurations, as well as more complex reaction mechanisms involving additives. It would also be worthwhile to extend the methodology to the analysis of diffusion-limited regimes, for example, by coupling a bulk diffusion code with the surface KMC code. Such extensions, which rely on increased computational power, offer the promise for improved electrodeposition systems based on rational engineering design procedures.
List of Symbols

| concentration of  ions in solution at the electrode solution interface (assumed to be constant in the simulations performed here), M ions in solution at the electrode solution interface (assumed to be constant in the simulations performed here), M |

| surface diffusion energy barrier for breaking an M–M bond, J |

| surface diffusion energy barrier for breaking an M–S bond, J |

| Faraday's constant, C/equiv |

| rate constant for deposition of species  on surface M, on surface M, 
|

| rate constant for the deposition of species  on surface S, on surface S, 
|

| number of charge equivalent, equiv |

| number of particles that can undergo  transition events in KMC code transition events in KMC code |

| number of particles out of  that are capable of undergoing a transition event with rate that are capable of undergoing a transition event with rate 
|

| random number in the range  , dimensionless , dimensionless |

| rate of deposition event in the KMC simulation code, 
|

| rate of surface diffusion event in the KMC simulation code, 
|

| rate of transition event 
|

| ideal gas constant, 
|

| temperature, K |

| jump frequency for surface diffusion of species M on surface S, 
|

| jump frequency for surface diffusion of species M on surface M, 
|

| probability of transition event  occurring, Eq. 4, dimensionless occurring, Eq. 4, dimensionless |

| Cartesian coordinate system for 2D surface  and normal coordinate and normal coordinate 
|
Greek

| charge-transfer coefficient for the deposition of species  on surface S, dimensionless on surface S, dimensionless |

| charge-transfer coefficient for the deposition of species  on surface M, dimensionless on surface M, dimensionless |

| scaling parameter which, when selected sufficiently large, ensures that the transition probabilities are small enough to simulate correctly the dynamics, 
|

| overpotential in Eq. 1, difference between the applied potential and the equilibrium potential for the  couple, V couple, V |

| overpotential in Eq. 2, difference between the applied potential and nucleation overpotential, V |
| Δτ | time step in KMC algorithm, Eq. 5, s |
Acknowledgments
Funding for this work was provided by an IBM Faculty Partnership and the National Science Foundation under grants ACI 96-19019 , CTS-0135621 , and CTS-0438356 as well as via the National Computational Science Alliance under NRAC MCA-01S022. Any opinions, findings, and conclusions or recommendations expressed in this material are those of the authors and do not necessarily reflect the views of the National Science Foundation. The first author received funding from the H. G. Drickamer Fellowship from the Department of Chemical and Biomolecular Engineering at the University of Illinois.
University of Illinois at Urbana-Champaign assisted in meeting the publication costs of this article.