
Abstract
This paper describes the application of a conducting diamond film as a transparent electrode for attenuated total reflectance infrared (ATR-IR) spectroscopy during electrochemical experiments. The electrode consists of a conducting polycrystalline thin film of diamond (4-6 μm) deposited on a silicon wafer (∼50 μm). The electrode is pressed onto a ZnSe ATR crystal with the silicon side in contact with the crystal; electrolyte (0.5 M  is in contact with the diamond film. We then electrochemically polarize the electrode and observe IR changes at the diamond-electrolyte interface. Before polarization, the IR spectra clearly show the presence of water and
  bands of the electrolyte. After conditioning the diamond film with cyclic voltammetry, two IR features appear in the spectra, and we have assigned to them the formation of –OH groups on the surface. One feature appears at
  (O–H stretch) and the other appears at
  (C–O stretch). These features clearly change with polarization potential, but may also depend on the amount of time spent at a critical potential. Because of their wide potential window for electrochemical reactions and their wide spectral transparency, diamond electrodes should be useful in many other spectroelectrochemical studies. © 2001 The Electrochemical Society. All rights reserved.
Export citation and abstract BibTeX RIS
In situ infrared (IR) spectroscopy is a powerful technique to elucidate the mechanisms of electrochemical reactions. Researchers have developed a number of methods to perform such spectroelectrochemical measurements using transmission, external reflection, and internal reflection configurations.1 2 The internal reflection techniques [also known as attenuated total reflectance (ATR)] are particularly powerful because they exclusively probe the electrode-electrolyte interface and the near surface region. Because very few conducting materials are also IR transparent, most researchers coat the internal reflection element with a very thin (10-100 nm) metallic film.2 When the electrode is IR transparent, however, the metal film is not necessary (e.g., conducting silicon3).
Diamond is also IR transparent, and some researchers have used nonconductive diamond in ATR measurements for either understanding diamond surface chemistry,4 5 6 or for protecting an internal reflection element from corrosion.7 In unrelated research, authors have begun using diamond films heavily doped with boron as an electrochemical electrode and studying its various properties; Ref. 8 9 10 review much of this work. If these electrochemical films are kept thin enough (<10-100 μm), however, these boron-doped diamond films are IR transparent,11 12 thus raising the possibility of diamond being applied as a transparent electrode for in situ infrared spectroelectrochemistry.
As a first test of this method, we have chosen an unresolved research question in diamond electrochemistry: how boron-doped diamond electrodes gain surface oxygen upon polarization in 0.5 M  13
14
15
16 Ex situ X-ray photoelectron spectroscopy (XPS) shows an oxygen increase for both polycrystalline and single-crystal electrodes. Unfortunately, ex situ XPS cannot typically provide any information on the character of the oxygen termination nor if the termination changes during polarization.
13
14
15
16 Ex situ X-ray photoelectron spectroscopy (XPS) shows an oxygen increase for both polycrystalline and single-crystal electrodes. Unfortunately, ex situ XPS cannot typically provide any information on the character of the oxygen termination nor if the termination changes during polarization.
We present here the measurements using a conductive diamond film as not only an ATR element, but as an electrode for spectroelectrochemistry. By coupling in situ ATR-FTIR spectroscopy with stepwise polarization, these preliminary measurements provide some information on the types of oxygen groups added to the diamond surface by polarization. These results will improve our understanding of the diamond surface termination during polarization as well as develop conducting diamond films as a new material for optically transparent electrodes.
Experimental
Figure 1 contains a schematic of the ATR electrochemical cell. The ATR cell consists of a single reflection, ZnSe internal reflection element ( Harrick Scientific) with an electrochemical cell pressed onto its upper surface. Sandwiched between the electrochemical cell and the ZnSe crystal is a conductive diamond film deposited onto a thin (∼50 μm) silicon wafer. The boron-doped, polycrystalline diamond films are grown by hot-filament assisted chemical vapor deposition using a 1%
  in
in  mixture with trimethyl boron and BN as the boron sources. Reference 15 summarizes further growth details. The substrates are double-sided polished silicon wafers (Virginia Semiconductor) doped to a conductivity level of 10-20 Ω cm (p-type). Prior to growth, we spray the silicon wafer with a 0.1 μm diamond powder slurry and then grow for 24 h at a filament temperature of 2050°C. This procedure forms a heavily doped (∼6000 ppm) film approximately 4-6 μm thick. Because of the compressive stress of the film, the wafer becomes deformed with the diamond side of the wafer in a convex shape. This deformed shaped introduces no obvious complications for the ATR measurements, however, because the wafer remains flexible enough to be pressed flat during measurements.
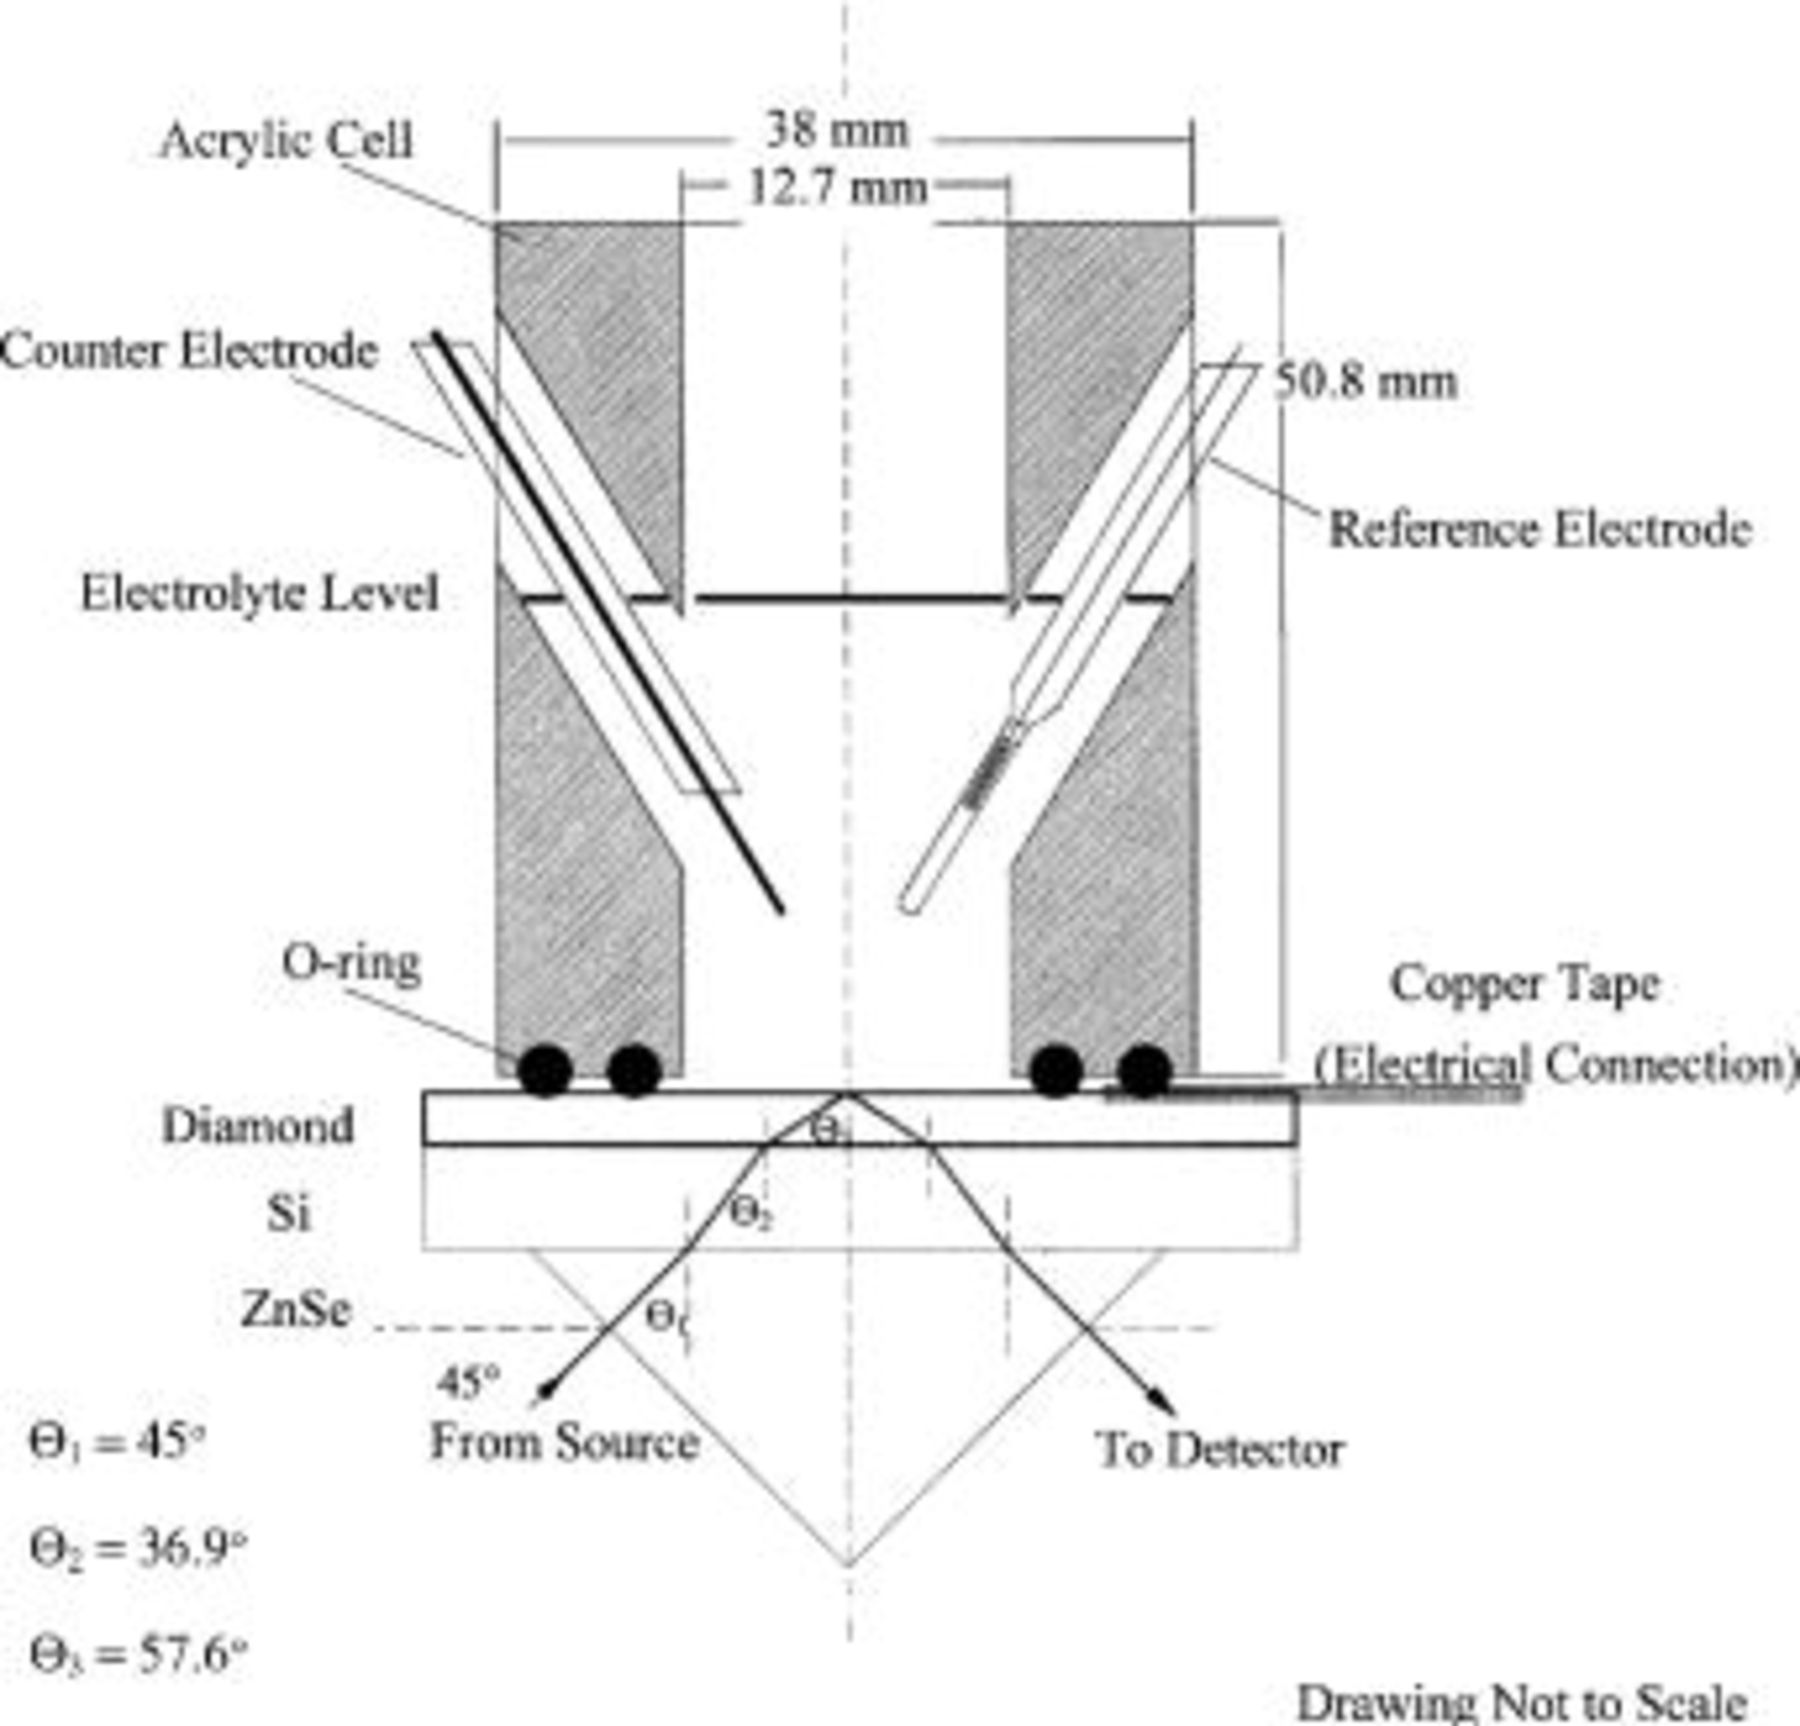
Figure 1. Schematic diagram of the spectroelectrochemical cell. Note that the diamond thin film is 4-6 μm thick and the silicon wafer is ∼50 μm thick.
The diamond-coated silicon wafer is the working electrode in the electrochemical cell. The acrylic cell presses the wafer onto the ATR prism for good optical contact and a leaktight seal with the electrolyte; the O-ring makes the only contact to the diamond (Fig. 1). The exposed circular area of the ZnSe crystal is ∼1.5 cm2. A hand screw mounted onto the assembly provides the pressure to make the seal without breaking the diamond-coated wafer. The electrical connection is copper tape attached to the diamond with silver conductive epoxy; the tape is masked where necessary to avoid grounding. Point-contacting these wafers would shatter them; therefore, the copper tape connection is kept relaxed. A second, larger diameter O-ring on the acrylic cell presses down on the tape, so that the diamond will not be affected if the tape were pulled.
The counter electrode (Pt wire) and the reference electrode (a dynamic hydrogen reference) entered the electrolyte via angled holes in the acrylic cell. The electrolyte was 0.5 M  (Fisher) and was inserted into the cell by pipette through the angled holes. In this work, the diamond electrode was conditioned with cyclic voltammetry (CV) using an EG&G PAR model 283 potentiostat; the potential was swept between −1.5 and +3.0 V vs. standard hydrogen electrode (SHE) at 200 mV/s for at least 10 min. During infrared measurements on the conditioned electrode, the potential was held at some constant value between these extremes. In all cases, the maximum current was 1 mA. Figure 2 contains a sample voltammogram for the diamond film electrode after performing at least 10 min of CV.
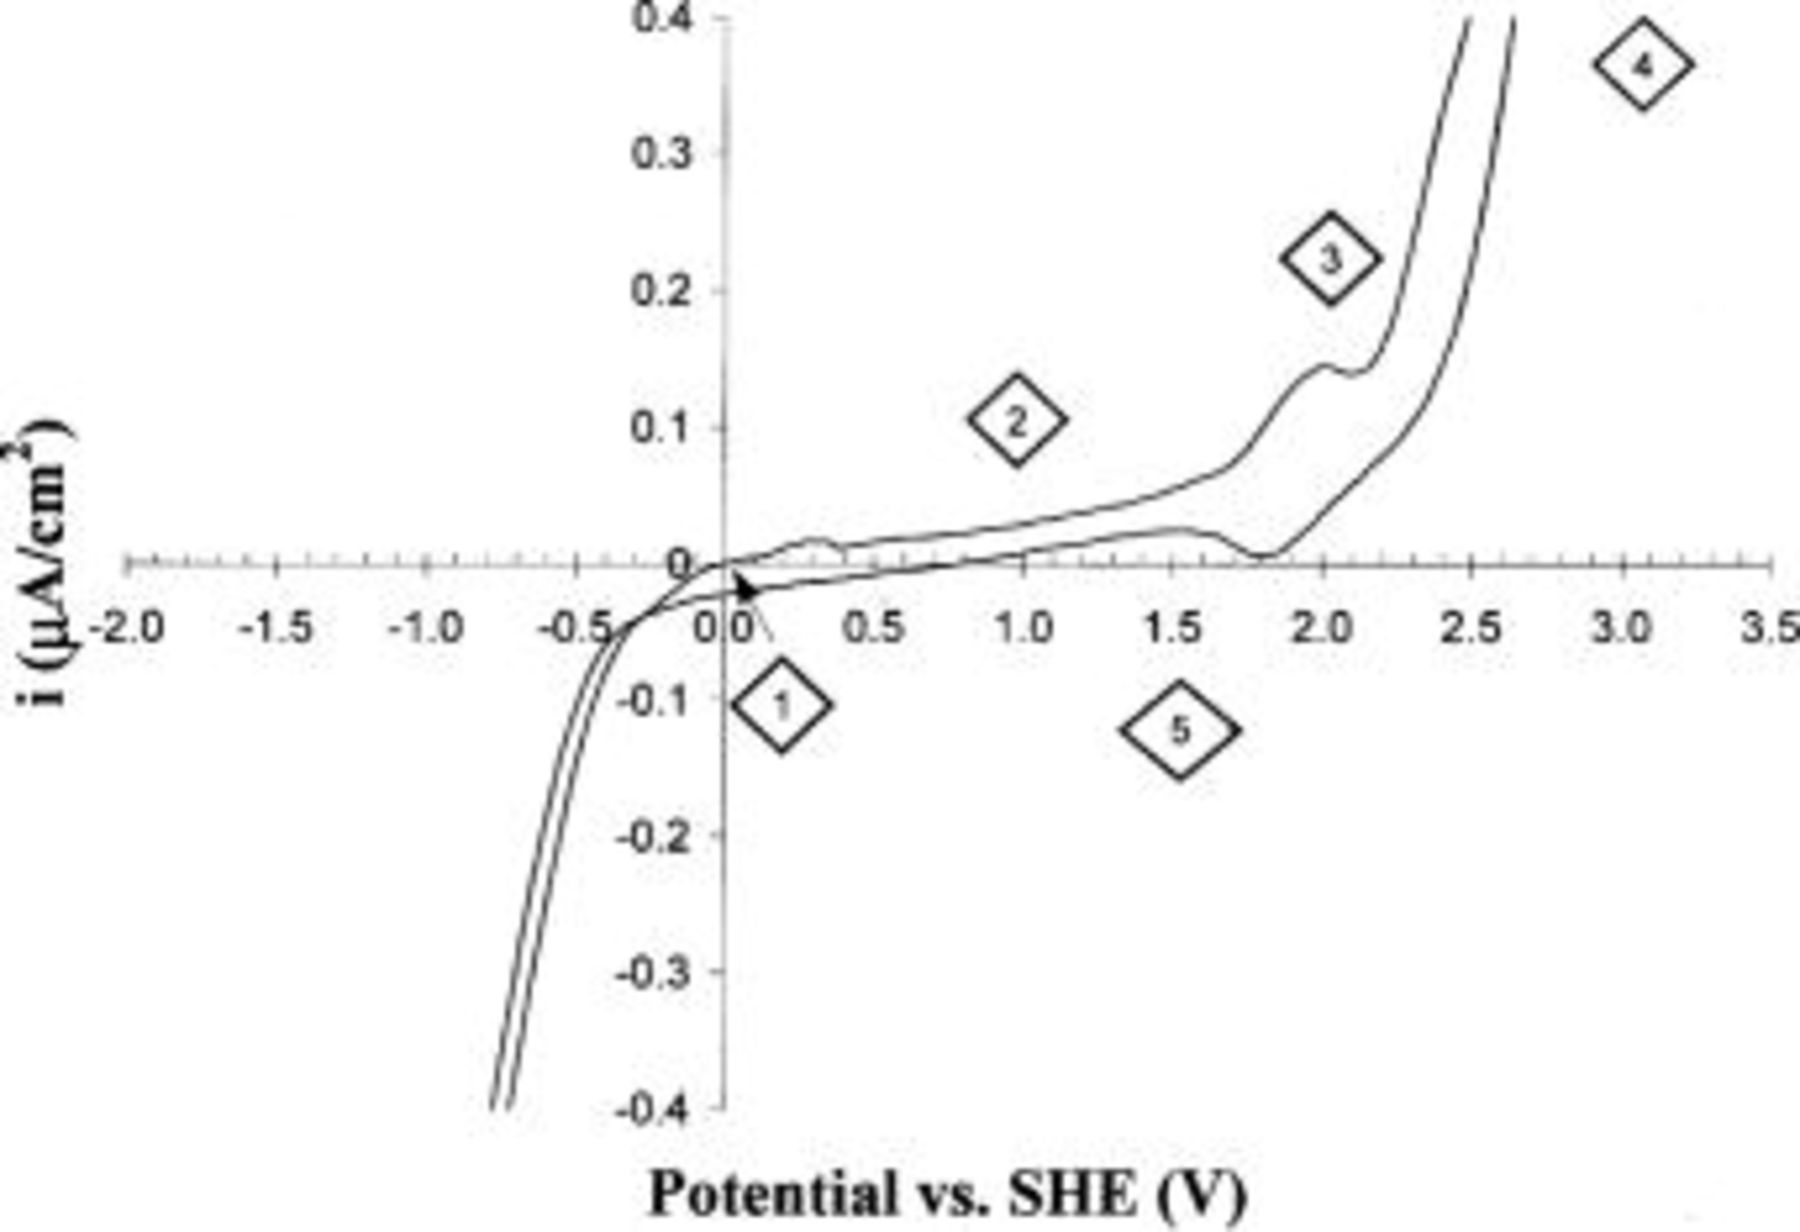
Figure 2. CV of the diamond electrode after conditioning with at least 10 min of scans at 200 mV/s. The marked points correspond to potentials (order indicated) at which infrared spectra are collected.
Figure 1 also shows a schematic of the optical path through the system. The IR light enters the ZnSe crystal and undergoes a series of refractions until it internally reflects at the diamond-electrolyte surface (angle of incidence 58° while diamond-water critical angle 33°). The Fourier transform infrared (FTIR) spectrometer is a Bomem 151 interferometer operated at 8 cm−1 resolution using a mercury cadmium telluride (MCT) detector. Spectra are obtained as interferograms using GRAMS/386 software (Galactic Industries) and then Fourier transformed to yield single beam spectra between 550 and 4000 cm−1; the ZnSe crystal sets the lower wavenumber limit. In a typical FTIR measurement, we polarized the conditioned diamond electrode to 0.0 V vs. SHE (point 1 in Fig. 2), and then collected 500 scans (∼6 min) of the ATR reflectance as a reference spectrum. We then stepwise polarize the electrode to the desired voltage (e.g., points 2-5 in Fig. 2) and then ratio the desired spectrum to the reference spectrum (point 1).
Results and Discussion
Figure 3a shows the infrared spectra of water and electrolyte when placed directly onto the ATR prism (no film in optical path). In this figure, the reference spectrum is the air-ZnSe interface. Both of these spectra show the characteristic absorption features of water: OH scissoring at 1635 cm−1 and the symmetric and asymmetric O–H stretches at ∼3320 cm−1. In the electrolyte spectrum, two new features arose due to the S=O stretches (1050 and 1190 cm−1) of the sulfuric acid in the electrolyte. Figure 3b shows the infrared spectrum taken at the diamond-electrolyte interface when the diamond-coated wafer is pressed onto the ATR prism. The electrolyte spectrum displays the same characteristic water and sulfuric acid features as for electrolyte placed directly on the ATR crystal (Fig. 3a). As a practical matter, we increased the pressure on the diamond wafer until the electrolyte bands appeared in the spectrum; this indicates that sufficient optical contact was established for unimpeded IR transmission to diamond-electrolyte interface. Note that there is a difference in the magnitudes of the IR absorption features in Fig. 3a and b, due to differences of the angle of incidence in the two experiments. In any ATR experiment, the penetration depth of the evanescent IR wave decreases as the angle of incidence increases.17 In the electrolyte-ZnSe experiment, the angle of incidence is 45°, whereas in the electrolyte-diamond measurement the angle is 58° (Fig. 1). Thus, this explains why the absorption features of Fig. 3a are larger than those of Fig. 3b.
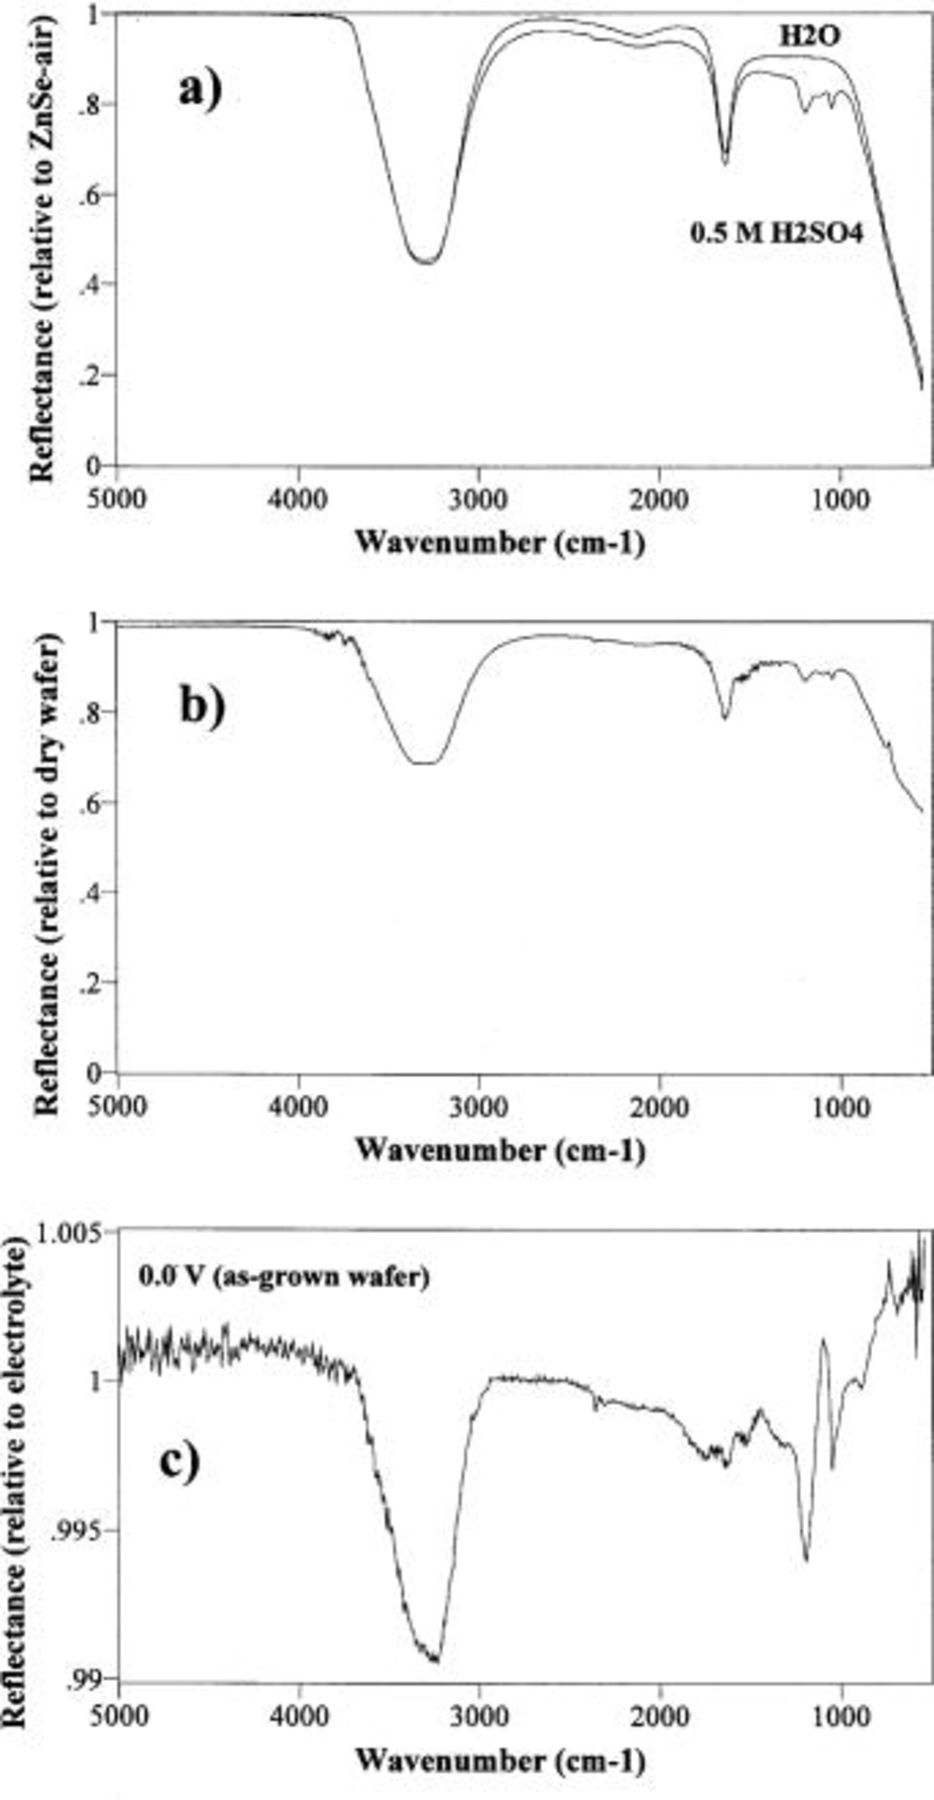
Figure 3. ATR spectra taken in the spectroelectrochemical cell. (a) ATR spectra of water and 0.5 M  electrolyte placed directly on the ZnSe prism. (b) ATR spectrum of 0.5 M
  electrolyte taken through the unconditioned diamond thin film on the silicon wafer. (c) ATR spectrum of electrolyte with unconditioned diamond electrode polarized to 0.0 V vs. SHE.
Changes to the as-grown (unconditioned) diamond surface occur as soon as we apply a potential of 0.0 V vs. SHE to the electrode (point 1 in Fig. 2). Ratioing this 0.0 V spectrum against the spectrum of the unpolarized electrolyte on the diamond (Fig. 3c) clearly shows that the amount of sulfate in the interface region has increased; in addition, a peak at 3240 cm−1 appears. Although this peak overlaps the O–H stretch of the water in the electrolyte (Fig. 3a), the corresponding OH scissoring peak of water at 1635 cm−1 did not appear. Thus, the 3240 cm−1 feature is not due to the –OH in the water, and we have assigned this peak to adsorbed OH. Note the change in scale between Fig. 3a,b and Fig. 3c.
Previous work has shown that the first voltammogram on the hydrophobic as-grown diamond electrode is usually different than later scans (when the electrode is hydrophilic).14 15 Although understanding this phenomenon is one objective of this research, we have focused our initial experiments on diamond electrodes that have been preconditioned with at least 10 min of CV to remove this effect. In this way, we can show a proof of principle for our method and qualitatively identify changes in the diamond electrode due to polarization effects with less complication from the one-time changes in the surface properties of the electrode.
After conditioning the electrode, we have applied a series of stepwise polarization potentials to the diamond electrode in the order indicated in Fig. 2. The potentials are chosen based on voltammetry features of typical diamond electrodes, including the redox couple at +1.9 V which is consistent with surface oxidation at the grain boundaries.14
15 Figure 4 shows the resulting spectra corresponding to points 2-5 in Fig. 2; each spectrum is ratioed to the spectrum taken on the conditioned electrode at 0.0 V (point 1 in Fig. 2). The spectra are offset for clarity. The spectra clearly show two new features at 3240 and 1100 cm−1 that change from points 2 to 5. [The other sharp features are due to atmospheric changes in the  (2350
(2350  and water vapor (3720 cm−1 and 1600 cm−1) surrounding our FTIR.] These features change in tandem with each other indicating that they are different modes of a common adsorbed species or are different species linked by a common chemistry. The features grow as the potential increases to +3.0 V (toward
  evolution), but, interestingly, the largest features appear at +1.5 V when the potential has been stepped back down.
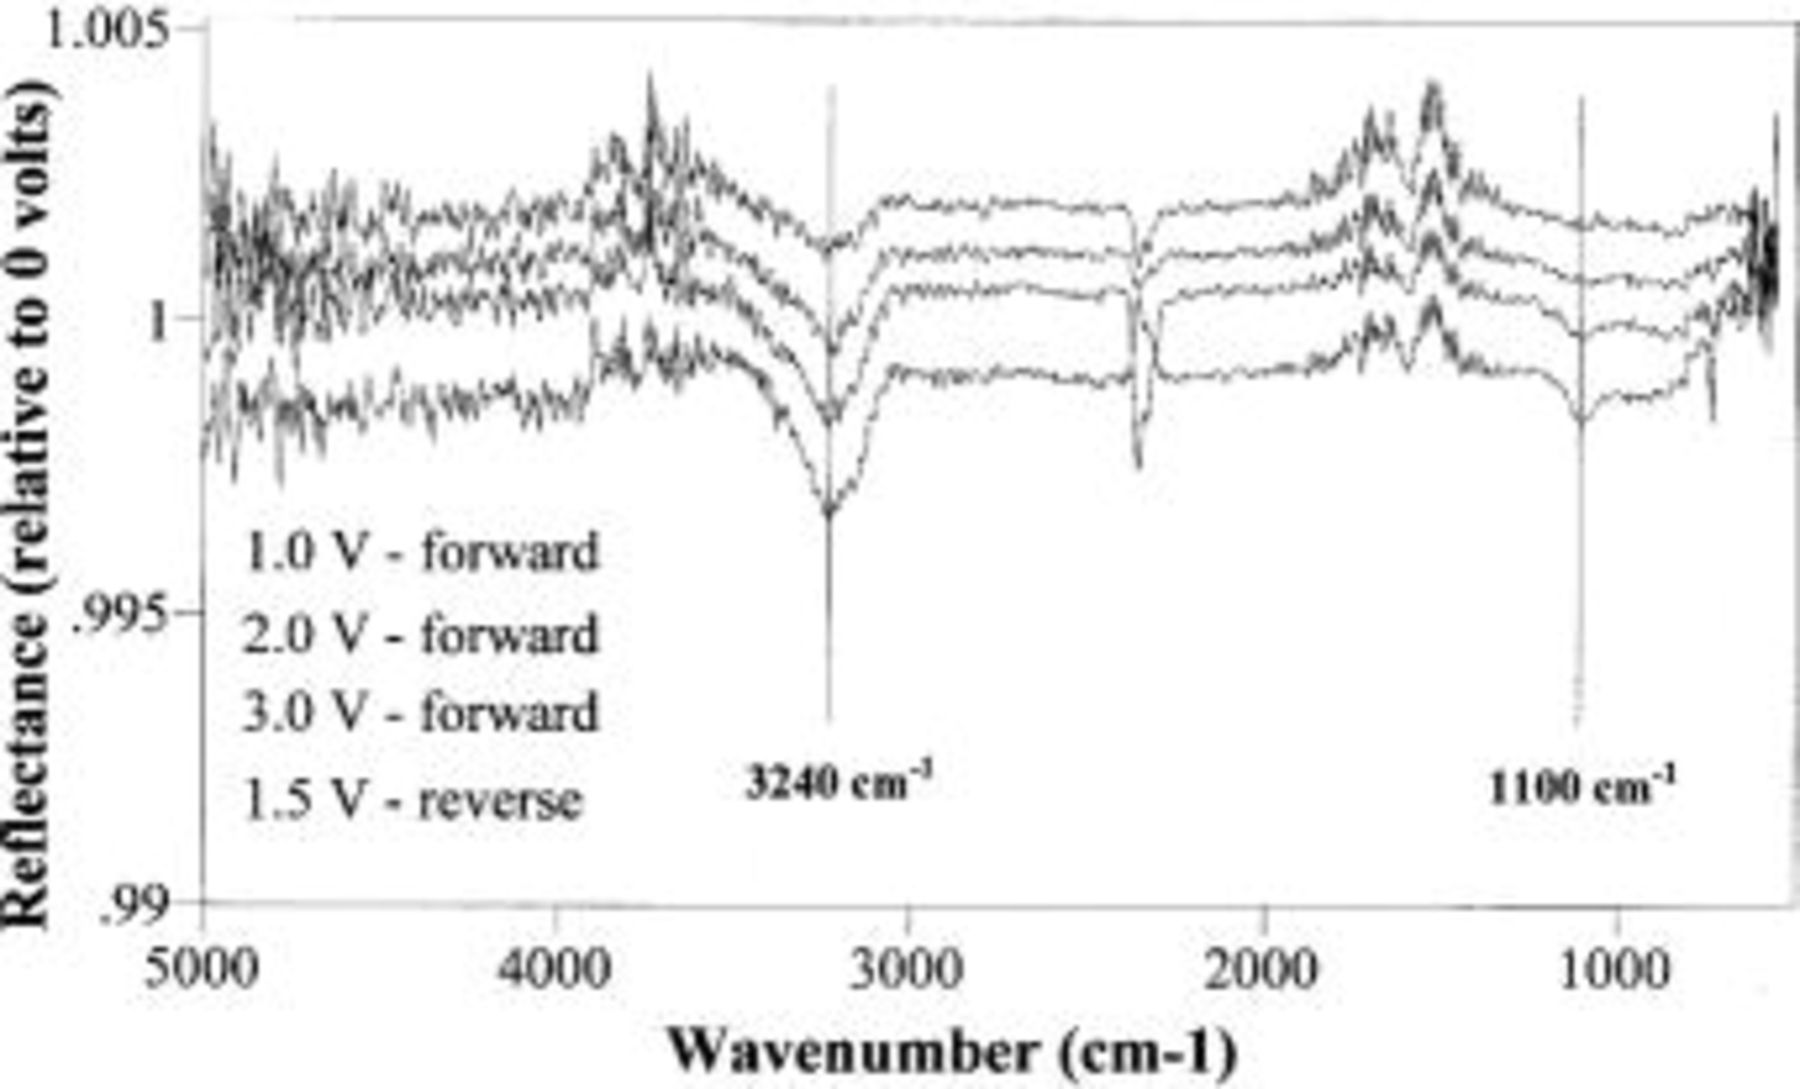
Figure 4. Infrared spectra taken during stepwise polarization of the conditioned diamond electrode at various potentials. Prior to taking these spectra, the electrode was conditioned with at least 10 min of CV as described in the text. Note that the spectra are on the same scale, but offset for clarity. The feature at 3240 cm−1 is assigned to O–H stretch while the feature at 1100 cm−1 is assigned to C–O stretch. The other features are due to atmospheric  (2350
(2350  and water vapor (1600 and 3750 cm−1) in the IR beam path. The terms forward and reverse refer to the order in which the potential is swept (see Fig. 2).
Again we assign the feature at 3240 cm−1 to the O–H stretch of adsorbed hydroxyl. Based on the observation that the C-O stretch of alcohols lies in the range of 1000-1200 cm−1, we assign the 1100 cm−1 feature to the C–O stretch of adsorbed OH on the diamond surface. Both of these assignments are consistent with other measurements of water adsorbed on diamond: Ando et al.18
19
20 observed O–H in the region 3500-3000 cm−1 while Struck and D'Evelyn4 observed the C–O stretch near 1125 cm−1 for water adsorbed on diamond (100). In addition, the above interpretation is consistent with measurements using XPS, which show oxygen addition to the surface after polarizing the electrode.15
16 On the other hand, compared to other oxidized diamond surfaces,18
19
20
21 there is no observable C=O stretch nor ether (C–O–C) stretch, but the C=O feature may be hidden underneath the  vapor bands (1600-1800 cm−1). There is no observable C–H stretch in the spectra at ∼2900 cm−1, but even if it were present, this band is expected to be very weak.4
5 The spectra also do not show any changes in the sulfate features as observed in Fig. 3c.
vapor bands (1600-1800 cm−1). There is no observable C–H stretch in the spectra at ∼2900 cm−1, but even if it were present, this band is expected to be very weak.4
5 The spectra also do not show any changes in the sulfate features as observed in Fig. 3c.
Although polarizing the electrode is critical to this oxygen addition, time probably also plays a significant role. IR measurements of a preconditioned electrode taken at 0.0 V before and after additional CV show little change in the 3240 and 1100 cm−1 features observed in Fig. 4, so some critical polarization voltage is required to activate the –OH addition. On the other hand, the amount of adsorbed –OH does not necessarily increase with the magnitude of applied potential since the diamond electrode at +1.5 V on the reverse step has more –OH than does +3.0 V. This experimental fact indicates that the amount of adsorbed –OH also depends on the amount of time the electrode is in contact with the electrolyte. Thus, +1.5 V (point 5) has larger features because it has been in contact with electrolyte longer than the previous points. (Note that each of the marked points in Fig. 2 requires ∼6 min of scan time on the FTIR.) More experiments are required to elucidate this phenomenon, however.
Conclusions
This paper reports research on the application of diamond thin films as transparent electrodes for in situ infrared measurements during electrochemical polarization. The electrode consists of a heavily boron-doped diamond film (4-6 μm) deposited on a thin silicon wafer (∼50 μm). The electrode is then pressed onto a ZnSe prism, and electrolyte is placed onto its surface. As proof of principle, we then performed a series of attenuated total reflectance experiments to examine how the infrared spectrum of the diamond-electrolyte interface changes as the electrochemical potential varies. For an unpolarized electrode, the IR absorption bands of the water and sulfate in the electrolyte are clearly observable through the electrode; polarizing the electrode also affects the IR absorption spectrum of the diamond-electrolyte interface. After conditioning the electrode for at least 10 min with cyclic voltammetry, the IR spectra recorded at different potentials show two new spectral features attributed to the O–H stretch (3240 cm−1) and the C–O stretch (1100 cm−1). These features change with potential and time.
Because of their wide potential window for electrochemical experiments and wide spectral transparency (ultraviolet to infrared), diamond electrodes should be useful transparent electrodes in many other spectroelectrochemical studies.
Acknowledgments
This research was supported by a National Science Foundation grant (CTS-9625095) (P.W.M.) and the Case School of Engineering (H.B.M.). The authors also acknowledge the experimental assistance of Wayne Schmidt, Cliff Hayman, Ram Raghavan, Dave Csuy, and Tammie Rupnik as well as useful discussions with John C. Angus and Uziel Landau.
Case Western Reserve University assisted in meeting the publication costs of this article.