Article Text

Statistics from Altmetric.com
Social media has profoundly changed the way we communicate and interact. Social media interaction brings new demands and challenges to our private and professional lives and has led to the development of completely new professions such as social media account managers, social media analysts, social media coordinators just to name a few.1 2 The main attraction of social media is that everyone can present themselves and their preferences, dislikes, opinions, etc., to a large audience, not least with the aim of influencing society, as large campaigns by political parties or companies impressively demonstrate. Successful social media influencers have several hundred thousand followers and can charge up to 200 Euro per Twitter post.3 What does this development mean for medicine and research? How do we wisely use social media to disseminate scientific data and interact with our key stakeholders? And does every good scientist nowadays have to be active on social media?
The answer to the last question is no. Although social media presence is a great way to disseminate your research, interact professionally and stay up to date, it is certainly not a requirement to be an active member of the scientific community. People who do not feel comfortable with social media or do not want to be exposed for privacy reasons have many other ways to achieve the same results without social media. Nevertheless, it is important to understand the mechanisms and processes of social media, as it has become an important part of professional life and publishing. Most journals, including RMD Open and Annals of the Rheumatic Diseases (ARD) publish Altmetric scores alongside articles. Thus, as publishing researcher you are measured by your social media presence, regardless of whether you participate actively or not. In this editorial, we explain how the Altmetric score is composed and highlight the connections between citations and social media activity. Furthermore, we outline some important take-home messages about using social media in science (see Fact Box).
Fact Box
What to tweet
Any kind of message, call and thought might be shared on twitter and can be supported by adding pictures or links to further sources of the content. In this regard, it is important to bear in mind that tweets can be read by anyone and remain online, meaning that you should remind yourself that your phrasing and content is appropriate in regard to the setting. Suggestions on content that you might find interesting to share can be news from conferences, research articles, events, awareness days, your research group, job opportunities and many more. If you tweet or re-tweet, a quick fact check including an estimation of the reliability and credibility of the data source you are using should be done.
How to tweet
After creating a twitter account, you can use twitter on your notebook or smartphone. For a twitter account that you use in your role as clinician/researcher, it is advantageous to choose a user name that makes you identifiable. Besides the standard twitter app, you might also use other apps like hootsuite or tweetdeck that provide you with more options. Tweets can encompass up to 280 characters and can be complemented with pictures, gifs, videos, places or links to websites. If you want to make one of the terms used in your tweet searchable (like a keyword) or add information to an existing topic/discussion use # (for instance #EULAR2020). If you want to make someone specific aware of your tweet, use his/her handle in the tweet (@ with the user name). You can also create twitter threads that link several of your tweets together to add additional information or arguments to your tweet.
Who to follow
Rheumatology associations (international and national ones) and their initiatives like @EULAR_org | @EULAR_Press | @EMEUNET | @EULAR_JC | @ACRheum | @ACR_Journals
Patient organisations or patient-directed platforms like @EULARYoungPARE | @ArthritisDay | @LupusEurope | @ACRSimpleTasks
Channels of journals you might be interested in like @ARD_BMJ | @Lupus_SM | @ACR_Journals | @RheumJnl
People associated with topics above, researchers and clinicians, who authored articles of interest to you, other relevant stakeholder and societies like @WHO | @EMA_news | @CDCgov
A great introduction to twitter is the EMEUNET 10 days of twitter course —#EMEU10DoT
WHAT ARE ALTMETRICS?
Most people will have noticed the coloured Altmetric donut, which is often shown next to the abstracts in the online version of scientific journals (figure 1). The colours depict different online sources by which the article was mentioned. These sources mainly are social media platforms such as Facebook, multimedia platforms like YouTube, mainstream media, public policy documents, online blogs, reference managers and peer-review platforms. From these sources, Twitter seems to be the most commonly used to circulate research findings.4

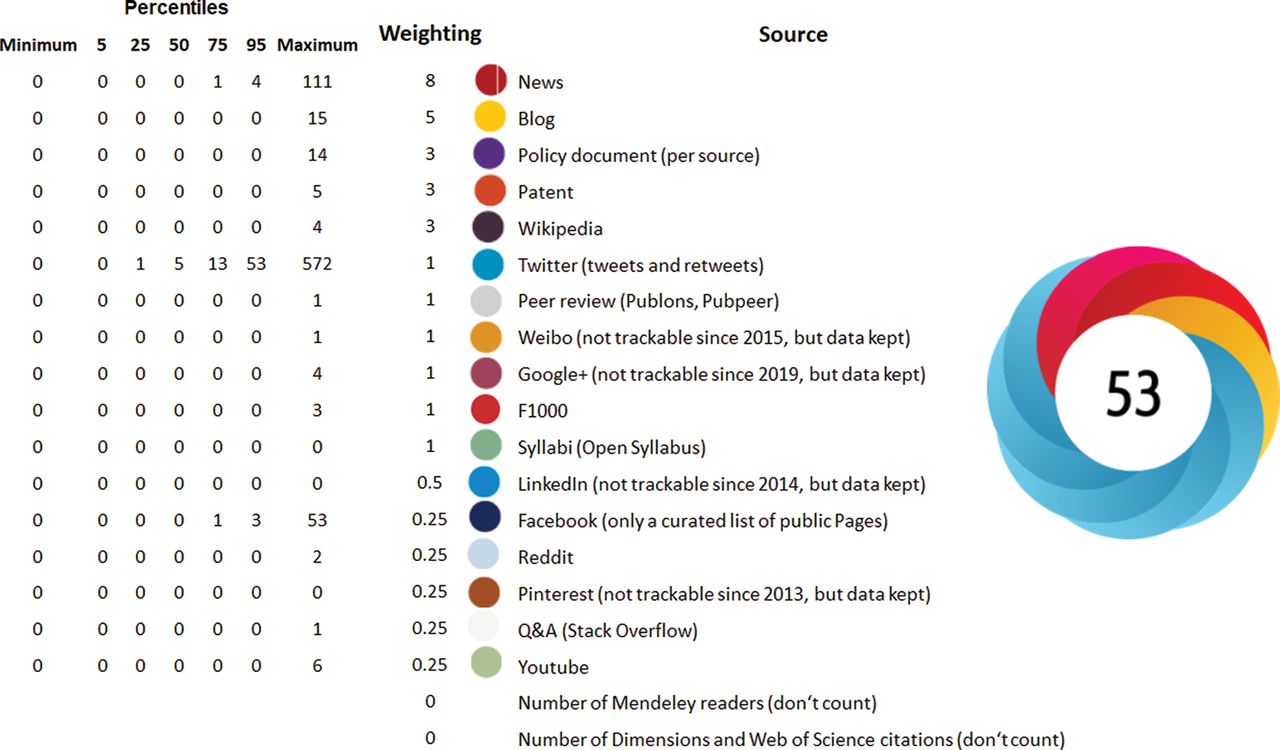
Composition of an Altmetric donut. From left to right: the distribution of scores of articles published in ARD and RMD Open, the weightings of the subcategories in the Altmetric attention score, and the index of all colours that can compose an Altmetric donut are shown. To the far right, an example of an Altmetric donut is shown. Its total Altmetric attention score is 53.
The number in the donut, the Altmetric Attention Score, reflects the attention an article has received. It is calculated according to a weighted formula that takes into account the number of mentions, their source—where, for example, a newspaper article counts more than a tweet—and the author who mentioned the article. If the mention is an automated tweet by a magazine, it contributes less to the score than if the mention comes from a scientist. Figure 1 outlines these different categories and their weighting that lead to the Altmetric score.5
While people tend to associate a high Altmetric score with good research, the connection between getting attention and the quality of the research output is of course not as direct and simple. Nevertheless, the Altmetric score is a good complementation to citations and journal impact factors to estimate the potential impact of research data. It accurately reflects the online engagement and public outreach of published science. While citations can reflect how a manuscript is received by the expert community, the Altmetric score can show the effect in the public and includes people that read, but not cite.6
CONNECTION BETWEEN ALTMETRICS AND CITATIONS
Several studies have tried to unravel the connection between altmetrics and citations. A link between these parameters seems quite probable, but various pitfalls complicate the analysis. Factors that influence this connection are for instance time of publication, field of research, accessibility of the article and habits of journals, researchers and stakeholders. Citation rates of published articles will only increase after a certain delay, whereas Altmetric scores react immediately after publication of a study. Accordingly, older articles usually have higher citation but lower Altmetric rates than newer ones. This inverse correlation introduces a strong bias in the analysis of the connection between citation and altmetrics.4 Journals that have social media strategies to disseminate their content like RMD Open and ARD actively support the positive development of the Altmetric scores of their articles and an active social media community in a specific field pushes the online dissemination of its research. Probably due to these factors, studies that analyse the link between citation and altmetrics are contradictory. Some studies found associations between social media activity and citation levels,4 7 8 while others could not confirm this.9 10
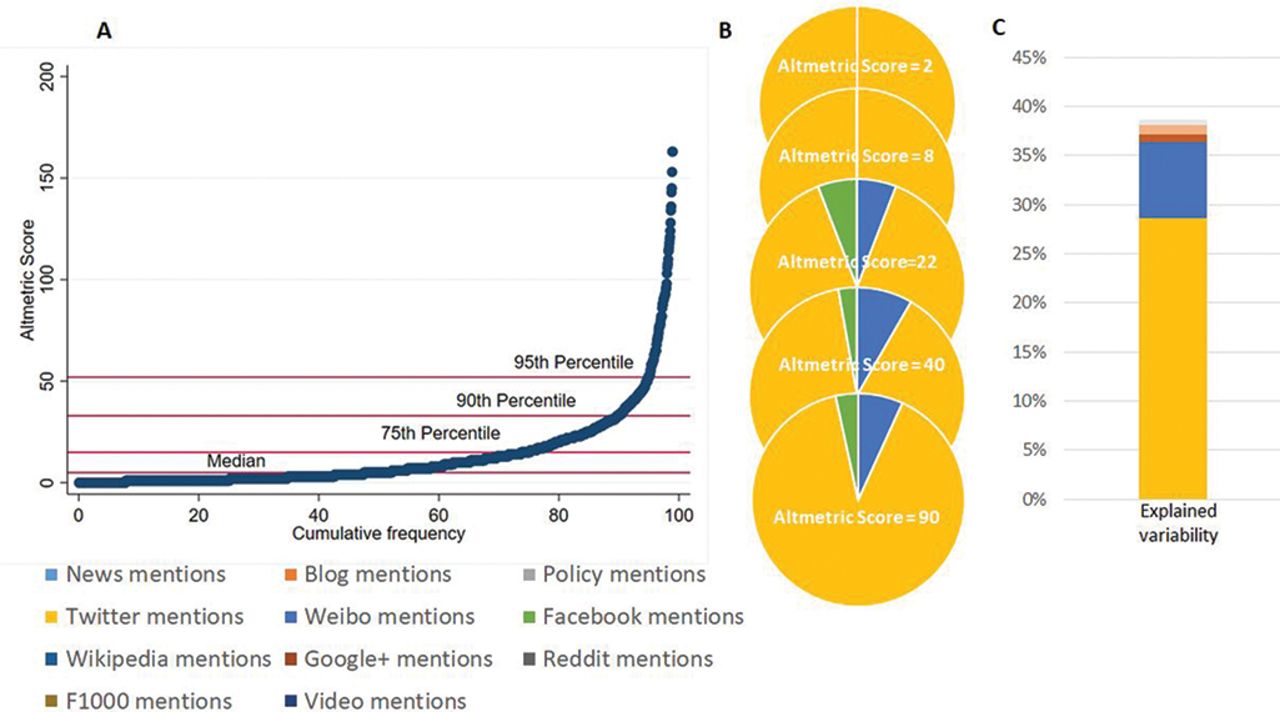
We dived deeper into exploring the influence of altmetrics on citations of journal articles using data of ARD and RMD Open of manuscripts published between January 2015 and November 2019 (1597 articles published in ARD and 409 articles in RMD Open, data provided by BMJ publishing group, London). To minimise bias of heterogeneous observation time since publication, we omitted articles published in 2019 concerning the evaluation of the potential impact of Altmetric scores on citations. We could confirm previous observations, that Altmetric scores are higher in more recently published articles11 (p=0.04; β: 1.3, 95% CI: 0.06 to 2.6 per year) and that twitter shows the highest activity of the social media platforms.4 Corresponding to our expectations, the number of citations, as assessed by Dimensions, was lower in articles published more recently (p≤0.001; β: −8.6, 95% CI: −9.8 to 7.4 per year). Twitter was by far the most used mean, that contributed to the Altmetric score of single articles, followed by news, FB, blogs and policy mentions (figure 1). Altmetric scores were not normally distributed among the included articles and to better assess the composition of subcategories leading to higher scores, articles were grouped by those with a score of 0, 1 to <5, 5 to <15, 15 to <33 and >52 (figure 2A). In a typical article with an Altmetric score <15, it was practically only twitter posts composing the score, in those articles with higher scores also news mentions added to the Altmetric score composition (figure 2B). Figure 2C outlines the contribution to the explained variability in increase of Altmetric score (assessed in a stepwise multivariable regression model). Hereby Twitter could explain 29% (B=0.015; 95% CI 0.014 to 0.016), news 7.8% (B=0.078; 95% CI: 0.068 to 0.088), Google+ 0.8% (B=−0.604; 95% CI: 0.43 to 0.778), blogs 0.9% (B= −0.296; 95% CI: −0.408 to −0.184) and policy mentions 0.6% (B=0.169; 95% CI: 0.092 to 0.246) to this explained variability. Overall twitter and news outlets did show a great impact, but single tweets had a small influence, whereas categories that rather appear for articles in the higher Altmetric score group like policy mentions had a stronger link to higher Altmetric scores.

(A) Cumulative frequency plot of Altmetric scores, including lines indicating median, 75th percentile, 90th percentile and 95th percentile cut-offs. (B) Pie charts: Fractional composition of subcategories used in the average article that composes the median Altmetric Score of this group (from top to bottom: 0 to median: Altmetric score between 1 and 4, Median to 75th percentile: Altmetric score between 5 and 14, 75th to 90th percentile: Altmetric score between 15 and 32, 90th to 95th percentile: Altmetric score between 13 and 51 and 95th percentile: Altmetric score >52. (C) Subcategories of explained variability of orderly ranked Altmetric Scores (R2 changes: Twitter: 29%, News: 7.8%; Google+: 0.8%, blogs: 0.9%, policy: 0.6%).

Subcategories of explained variability of citations for several types of articles. Variability explained by time since publication is depicted in blue, by Altmetric score depicted in orange and by open access status in grey. Types of articles are correspondence, original research, viewpoints/editorial, basic/translational and clinical/epidemiological articles.
Using forward-stepwise regression models, the most important determinant of citation rate in our overall model was the time passed since publication of the manuscript. Time could explain 10% of the variability in citation numbers, but additional 4.7% was explained by altmetrics. Further, it seems that the importance of these factors depends on the article type (figure 3). For original research and editorials, Altmetric scores significantly added to the variability of the citation count, which was not the case for correspondences. The influence of Altmetric scores on citation count of editorials added 16% to the 12% variability explained by publication time. Both factors showed similar ß-coefficients (months, β: 0.76; Altmetric score, β: 0.83). For original articles, Altmetric scores added 3.5% to the 20% explained by time. Differences in Altmetric scores as well as the impact of altmetrics on citations could also be seen, when analysing clinical science and basic/translational science articles separately. Clinical science articles had expectedly higher Altmetric scores than basic/translational articles (median (IQR): 16 (6–28) vs 4 (2–8)). This is probably related to the fact that clinical studies are easier for the general public to understand and their results are relevant to more people than specialized basic research studies. However, the use of lay language and a straightforward description of the significance of the study could help to improve the dissemination of basic research results to the wider community. Time since publication has a greater influence on citations in basic science articles (months: β: 2.9) with Altmetric scores not adding additional explanation. This may be due to the fact that basic research areas tend to have small circles of experts who know the literature in their research area and are not influenced by social media channels. For clinical publications, time since publication remained the largest factor, but Altmetric and open access positively added to variability in citation numbers (months, β: 0.9; Altmetric score, β: 0.1; open access, β: 9.7; figure 3).
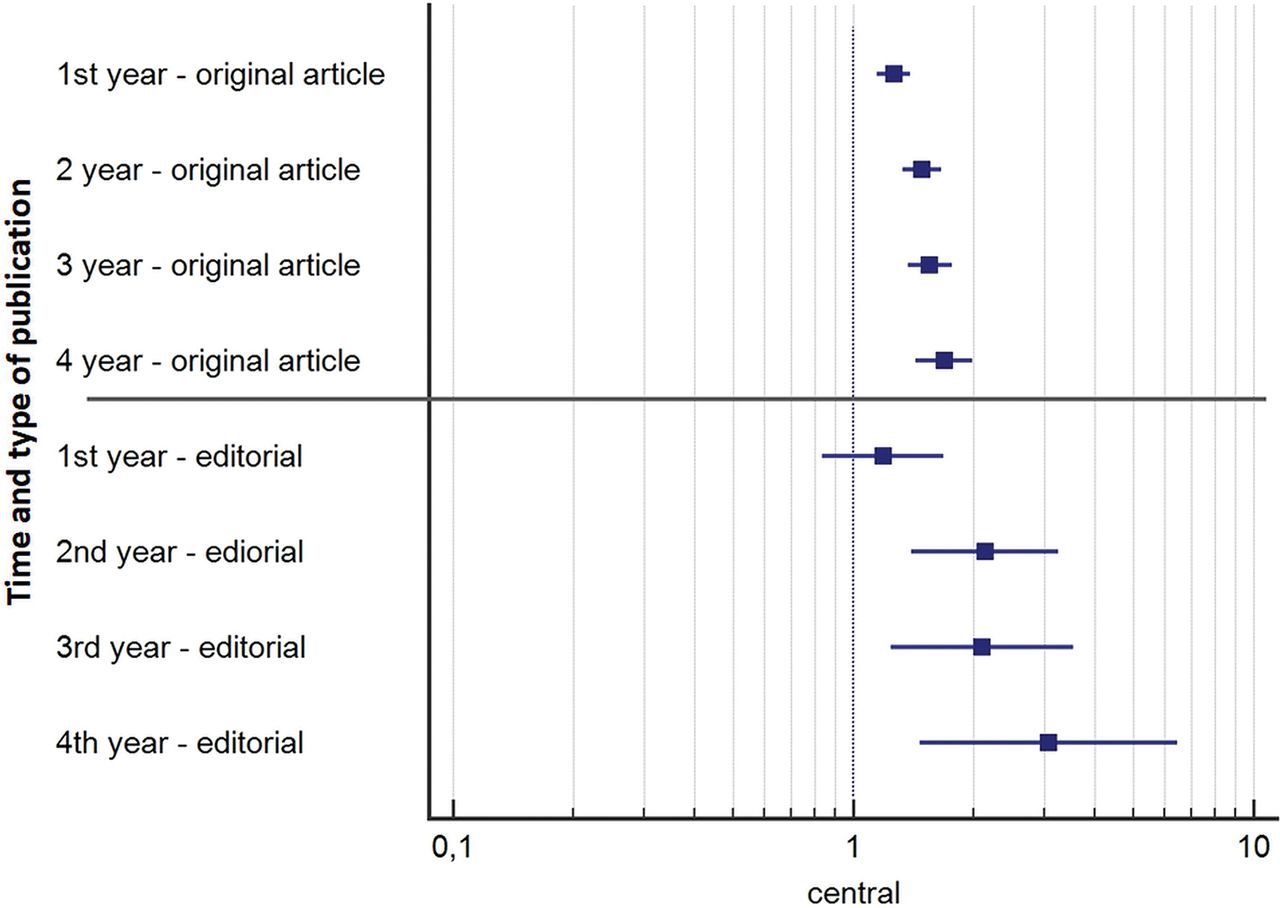
When exploring the influence of these factors on citations per publication year, we dichotomised between those among the top 25% in citation count or below. We then adjusted this cut-off for each year to the respective journal in the respective publication category and performed receiver operating curve analyses to identify an Altmetric score cut-off value coinciding with an 80% specificity of reaching the top 25% of cited articles in the respective years. We found that particularly in the first 2 years after publication, the likelihood of reaching the top 25% substantially increased for manuscripts with higher Altmetric scores (table 1). We additionally analysed this using logistic regression analyses separately by publication type. The effect was stronger for editorials or viewpoint articles than for original research articles (figure 4). Correspondence articles did not benefit from Altmetric scores.12
Cut-offs of Altmetric score (AS) needed (bold) to reach the top 25% of cited articles that coincide with the provided sensitivity in the table (italics), while keeping a specificity of ~80% for the respective articles. Every year post-publication was calculated (first year, second year, third year, fourth year) in a receiver operating curve analyses. AUC: area under the curve, outlined for each model. 95% CI: 95% CI; +LR: positive likelihood ratio, -LR: negative likelihood ratio

ORs of being among the top 25% cited articles for articles with a high Altmetric score. The analysis was performed in each year since publication. The ORs are separately depicted for original articles (upper panel) and editorials (lower panel).
In summary, our data suggest that for manuscripts published in ARD and RMD Open, there is a connection between altmetrics and the citation rate and that higher Altmetric scores are predictive for higher citation rates. An analysis using data from manuscripts published from 2010 to 2015 in Rheumatology did not find a connection between the Altmetric score and citation rate.9 This discrepancy could be due to the analysis of different journals, more probable however, due to the increasing usage of social media by Rheumatologists in recent years. A survey among young Rheumatologists in 2016/2017 showed that more than 80% were active social media users13 and during the EULAR meeting 2018 #EULAR2018 was used by over 10 000 tweets.14 Symplur reports outline a further increase with >20 000 tweets using the #EULAR2019 hashtag. Similar to the field of Rheumatology, other medical fields also discuss the impact and importance of social media in professional settings, in trainings and the impact of journals.7 15–17 In general, the outcome is positive, but with partly unclear results. Also beyond the influence of social media on the citation rate, it is becoming increasingly important to be aware of how scientific information can be communicated and disseminated via social media channels to professionals in the field and to the general public.
Acknowledgments
We thank BMJ for kindly providing citation and Altmetric reports as well as Bernard Combe, Josef S Smolen and EMEUNET for inspiration and input.
Footnotes
Twitter Paul Studenic @Stiddyo and Caroline Ospelt @CarolineOspelt.
Contributors PS, CO: interpretation of data, and drafting, editing and revision of the manuscript; PS: analyses of data.
Funding The authors have not declared a specific grant for this research from any funding agency in the public, commercial or not-for-profit sectors.
Competing interests PS and CO are both Social Media Advisors of ARD and RMD Open. CO is editorial board member of ARD and associate editor of RMD Open. PS reports grant support by Abbvie outside of the submitted work. CO received grant support from Novartis and advisory fees from Gilead Sciences, both outside of the submitted work.
Patient consent for publication No patient research partner was involved in production of this manuscript.
Ethics approval No ethical approval was required.
Provenance and peer review Commissioned; externally peer reviewed.
Data availability statement Data have been provided by BMJ. Any requests for individual data will have to be addressed to the sponsor directly.