Article Text

Abstract
Background A single variant in NAA10 (c.471+2T>A), the gene encoding N-acetyltransferase 10, has been associated with Lenz microphthalmia syndrome. In this study, we aimed to identify causative variants in families with syndromic X-linked microphthalmia.
Methods Three families, including 15 affected individuals with syndromic X-linked microphthalmia, underwent analyses including linkage analysis, exome sequencing and targeted gene sequencing. The consequences of two identified variants in NAA10 were evaluated using quantitative PCR and RNAseq.
Results Genetic linkage analysis in family 1 supported a candidate region on Xq27-q28, which included NAA10. Exome sequencing identified a hemizygous NAA10 polyadenylation signal (PAS) variant, chrX:153,195,397T>C, c.*43A>G, which segregated with the disease. Targeted sequencing of affected males from families 2 and 3 identified distinct NAA10 PAS variants, chrX:g.153,195,401T>C, c.*39A>G and chrX:g.153,195,400T>C, c.*40A>G. All three variants were absent from gnomAD. Quantitative PCR and RNAseq showed reduced NAA10 mRNA levels and abnormal 3′ UTRs in affected individuals. Targeted sequencing of NAA10 in 376 additional affected individuals failed to identify variants in the PAS.
Conclusion These data show that PAS variants are the most common variant type in NAA10-associated syndromic microphthalmia, suggesting reduced RNA is the molecular mechanism by which these alterations cause microphthalmia/anophthalmia. We reviewed recognised variants in PAS associated with Mendelian disorders and identified only 23 others, indicating that NAA10 harbours more than 10% of all known PAS variants. We hypothesise that PAS in other genes harbour unrecognised pathogenic variants associated with Mendelian disorders. The systematic interrogation of PAS could improve genetic testing yields.
- Naa10
- polyadenylation signal
This is an open access article distributed in accordance with the Creative Commons Attribution 4.0 Unported (CC BY 4.0) license, which permits others to copy, redistribute, remix, transform and build upon this work for any purpose, provided the original work is properly cited, a link to the licence is given, and indication of whether changes were made. See: https://creativecommons.org/licenses/by/4.0/.
Statistics from Altmetric.com
Introduction
Congenital anophthalmia and microphthalmia result from failure of early eye development. Clinical presentation in one-third of affected individuals is syndromic,1 2 and it is genetically heterogeneous.3 X-linked syndromic anophthalmia and microphthalmia have been shown to result from pathogenic variants in four genes: BCOR 4 (MIM:300485, MCOPS2), HCCS 5 (MIM:300056, MCOPS7), HMGB3 6 (MIM:300193, MCOPS13), and NAA10 7 (MIM:309800, MCOPS1). A fifth locus, MCOPS4 (MIM:301590, also designated as ANOP1), with linkage to Xq27-q28, was specified without identification of an associated gene. HMGB3 and NAA10 reside on Xq27-q28. A single HGMB3 variant has been reported in one family to cause syndromic colobomatous microphthalmia.6 Forrester et al 8 described a family segregating what they termed Lenz microphthalmia syndrome (LMS) and linkage to Xq27-q28. Affected individuals had severe microphthalmia, renal anomalies, high-arched palate, cutaneous syndactyly of the hands and severe intellectual disability (ID). A c.471+2T>A splice variant in NAA10 was identified as causative, the only study to date associating NAA10 variants with syndromic microphthalmia.7
The MCOPS4 locus was originally defined based on a family reported by Graham et al.9 Their manifestations included microphthalmia/anophthalmia and ID in multiple affected males. Here, we reanalysed this family using genetic linkage analysis and exome sequencing, verified our findings in two additional families and functionally characterised the variants.
Materials and methods
All DNA analyses were performed using standard techniques.
Linkage and haplotype analyses
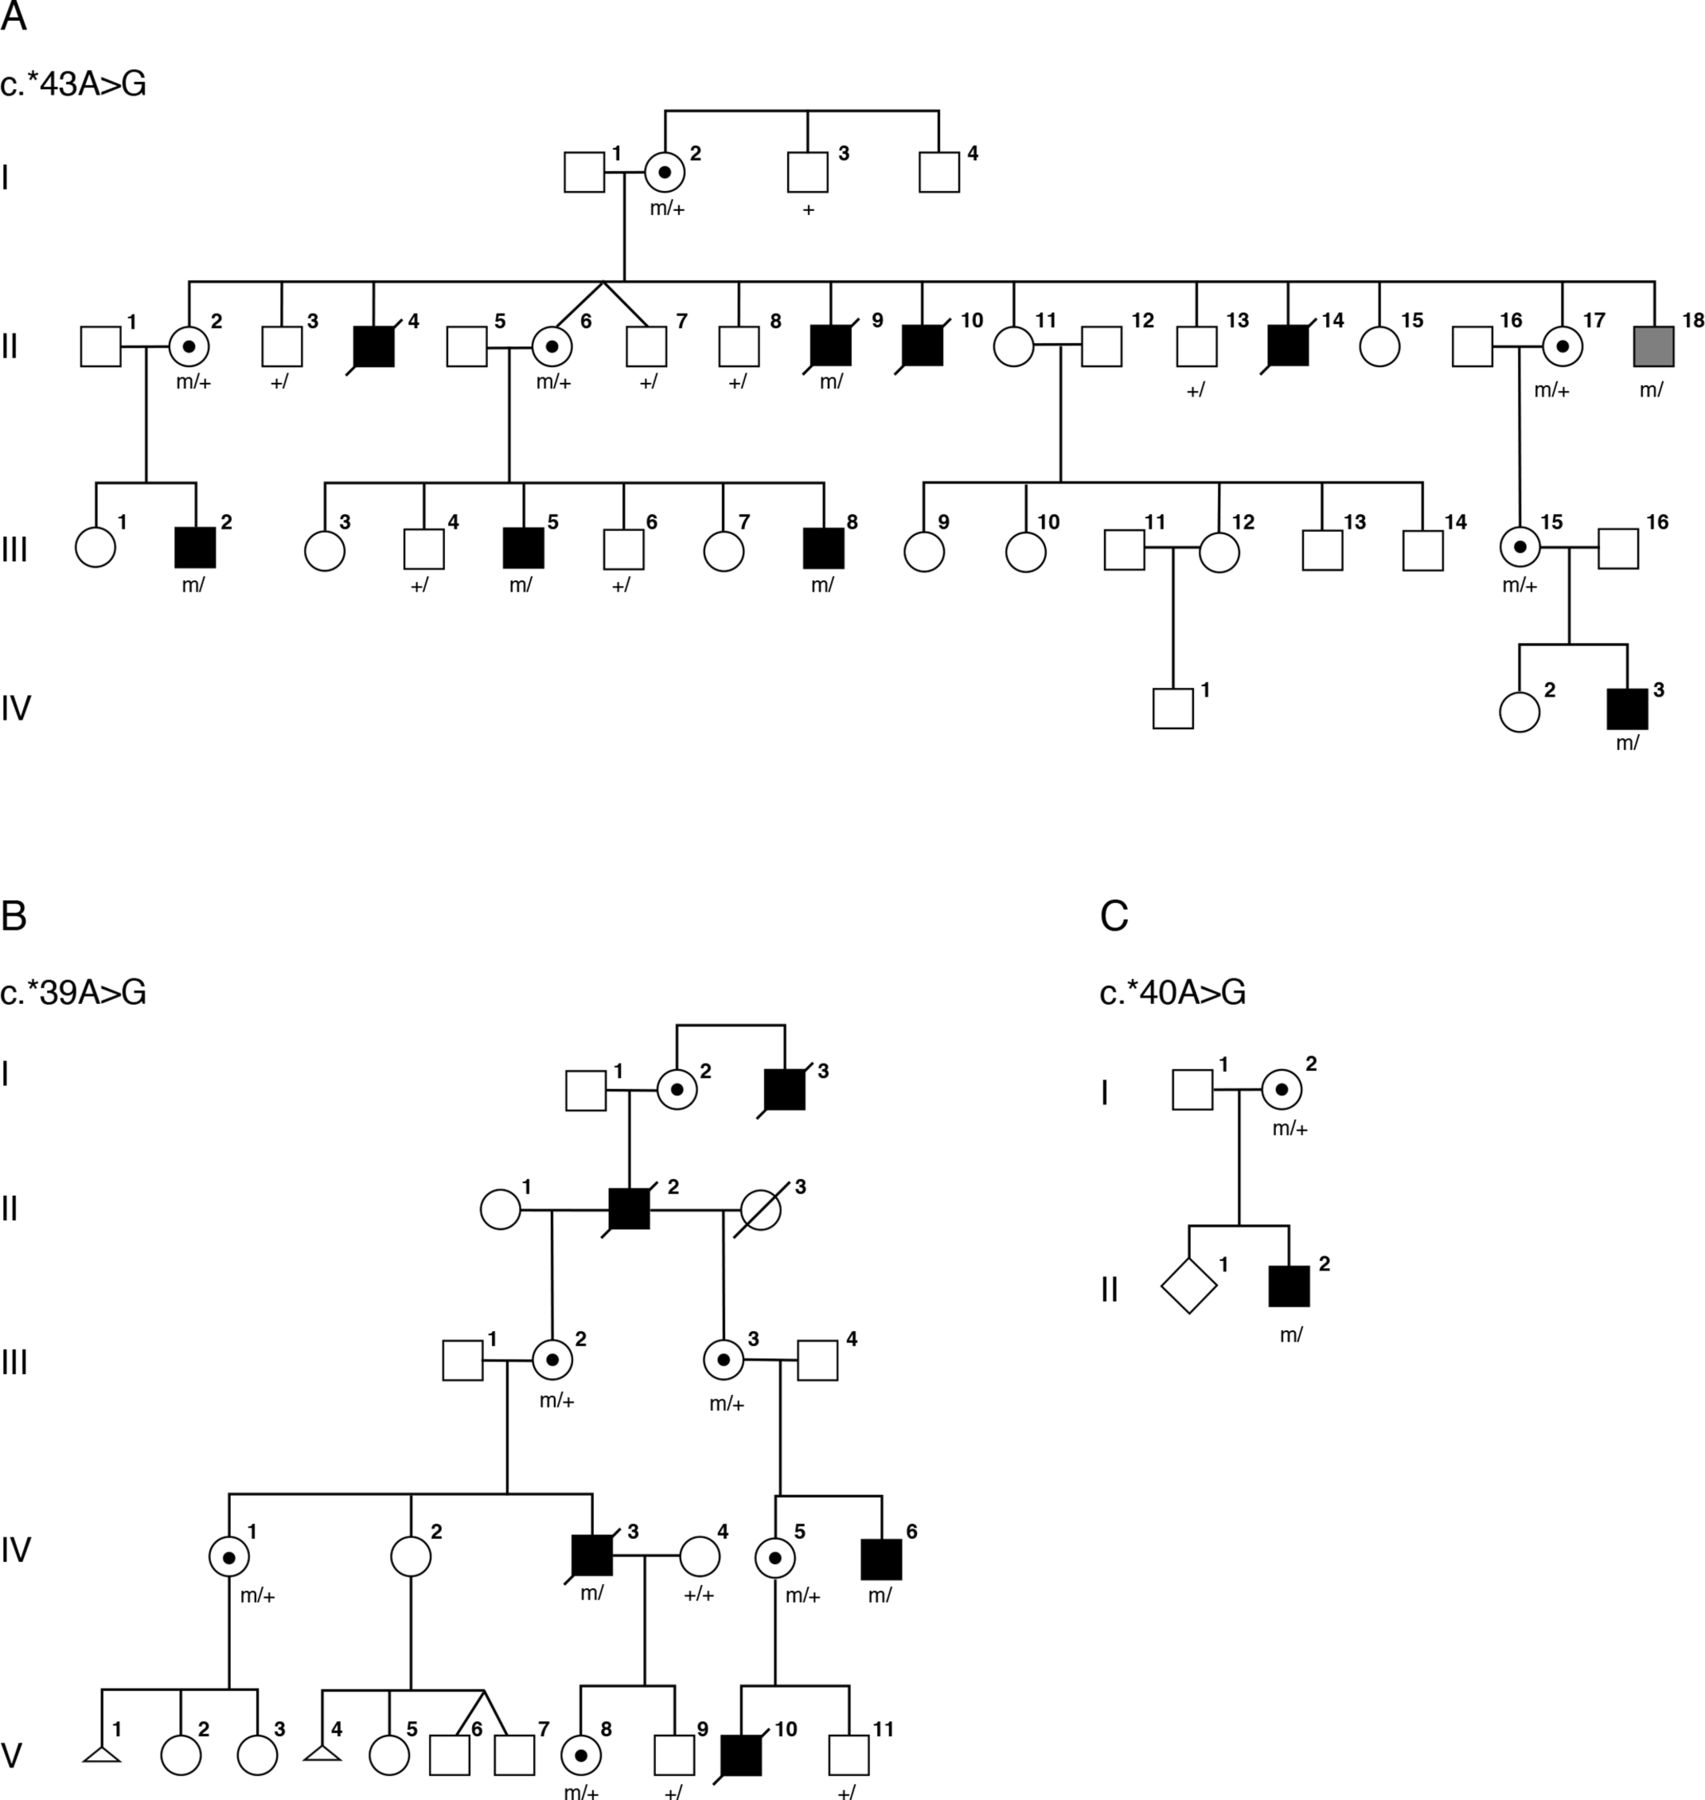
Resampling and repeat genetic linkage analyses were performed in family 1 (figure 1A) using 30 microsatellite markers on the X chromosome. Initial analyses of 22 markers spanning the X chromosome were followed by fine mapping with an additional eight markers from the region near Xqtel. Logarithm of odds (LOD) scores were computed using FASTLINK using equal marker allele frequencies.10–12 For multimarker analyses, intermarker recombination fractions were derived from the Rutgers map.13 The disease locus was modelled as X-linked recessive. Analyses were performed under two additional possible scenarios: first that the individual I-2 was gonadal mosaic and second that penetrance was less than 100%. Haplotype analysis was performed assuming a model of X-linked recessive inheritance.

Pedigrees for families 1–3. Clinically affected individuals are depicted by filled symbols, black symbols depict individuals with eye findings and grey symbols depict individuals without eye findings, genotypes of tested individuals are noted.
Sequence analyses
The coding region and consensus splice sites of two candidate genes, NAA10 and HMGB3, were analysed in family 1 using Sanger sequencing. Exome sequencing was performed on individual IV-3 and his parents at the National Institutes of Health Intramural Sequencing Center, as described.14 Identified variants in the linkage region were filtered for quality, absence in ExAC males and absence in 473 males from an in-house dataset.15 16 Sanger sequence analyses were performed in family 1 to confirm segregation. Targeted Sanger sequencing of NAA10 was performed in the proband of family 2 (figure 1B). Independently, sequence analysis of a panel of 41 genes causally associated with severe eye malformations was carried out on the proband in family 3 (figure 1C) using a custom-designed Agilent SureSelect panel (Agilent Technologies, Santa Clara, California, USA) and paired-end DNA sequencing using an Illumina MiSeq platform (Illumina, San Diego, California, USA), as per the manufacturer’s instructions. Targeted sequencing of the NAA10 polyadenylation signal (PAS) was performed in 250 unrelated microphthalmia/anophthalmia/coloboma patients selected without sex bias from the MRC Human Genetics Unit Eye Malformation cohort. A further 126 males with developmental eye disorders underwent targeted sequencing of the NAA10 PAS. Forty-four of these individuals with bilateral developmental eye disorders were analysed for variants in the coding region and consensus splice sites of NAA10.
X-inactivation analyses
X-inactivation studies were performed on genomic DNA from 11 carrier females (family 1 individuals I-2, II-2, II-6, II-17 and III-15; family 2 individuals III-2, III-3, IV-1, IV-5 and V-8; family 3 individual I-2) using the human androgen receptor (HUMARA) assay as described in Allen et al 17 with minor modifications. Briefly, genomic DNA was digested with Rsa1 either alone or with the addition of HpaII (New England Biolabs, Ipswich, Massachusetts, USA). Digested DNA was PCR amplified using primers HUMAR_F:/56 FAM/TCCAGAATCTGTTCCAGAGCGTGC and Humara_R: GCTGTGAAGGTTGCTGTTCCTCAT (Integrated DNA Technologies, Coralville, Iowa, USA). Products were run on an 3130xl genetic analyser (ThermoFisher Scientific, Waltham, Massachusetts, USA) and analysed using GeneMapper v4.0 (ThermoFisher Scientific).
RNA analyses
Total RNA was isolated from whole blood from affected and carrier individuals in family 1 and from unrelated male and female controls using PAXgene Blood RNA tubes (BD Biosciences, San Jose, California, USA). Total RNA was isolated from lymphoblasts from one affected and one unaffected individual in family 2 using the RNeasy Mini kit (Qiagen, Germantown, Maryland, USA). RNA samples were not available from family 3. RNA-Seq libraries were constructed from 0.5 µg to 1 µg total RNA after rRNA depletion using Ribo-Zero Globin (Illumina). The Illumina TruSeq Stranded Total RNA Kit was used according to manufacturer’s instructions. The cDNA inserts were ~200 bp after chemical shearing. PCR amplification was performed using 10 cycles. Unique barcode adapters were applied to each library. Libraries were pooled in equimolar ratio for sequencing. The pooled libraries were sequenced on multiple lanes of a HiSeq 2500 (Illumina) using version 4 chemistry to achieve a minimum of 69 million 125 base read pairs. The data were processed using RTA version 1.18.64 and CASAVA 1.8.2. RNA-Seq reads were aligned with the STAR aligner,18 using the hg19 genome assembly and the Ensembl transcript database (release 74). The STAR BAM output file was converted to WIG format using the bam2wig.py script from the RSeqC suite,19 and these WIG files were further converted to bigwig format using the wigToBigWig tool from the UCSC Genome Browser’s binary utilities directory.
For qPCR, 400 ng total RNA was converted to cDNA using the High Capacity RNA-to-cDNA kit (Applied Biosystems, Beverly, Massachusetts, USA). TaqMan assays were performed using 10 ng cDNA, gene-specific TaqMan probes (NAA10: HS01125831_g1 and HA00185854_m1; beta-Actin: Hs99999903_m1 (ThermoFisher Scientific) and TaqMan Gene Expression Master Mix (Applied Biosystems) on the OneStepPlus Real-Time PCR System (ThermoFisher Scientific). Samples were run in triplicate, and relative expression levels in affected and carrier individuals as compared with control individuals were calculated using the delta-delta Ct method.
Results
Clinical evaluations
Family 1
Family 1 (figure 1A) was originally described by Graham et al in support of a fifth microphthalmia/anophthalmia locus MCOPS4. The family was reported to include seven affected males with microphthalmia/anophthalmia and ID.9 One man, II-18, was reported to have normal eyes with cleft soft palate and a single ear tag and was considered unaffected with respect to syndromic anophthalmia/microphthalmia. An additional affected male, IV-3, with a milder phenotype as compared with his affected uncles, was born after publication of the Graham et al paper.9 Briefly, this male infant was born following a pregnancy in which scans were assessed to be normal. However, at birth he was noted to have a large open neural tube defect (NTD), right-sided anophthalmia and bilateral 2–3 cutaneous syndactyly of his toes. When his teeth erupted, they were irregular. He was sociable and did not show signs of the severe developmental delay or behavioural problems, most notably self-mutilation, seen in other affected males in the family.
Family 2
Family 2 (figure 1B) was originally described by Slavotinek et al 20 as a four-generation family with X-linked anophthalmia consistent with linkage to Xq27. The intelligence of two living males in family 2 was apparently normal. Carrier females III-2 and IV-1 had unremarkable eye examinations, and individual IV-1 was diagnosed with dyslexia but her intelligence was apparently normal.
Family 3
The male proband (individual II-2; figure 1C) was the second child of a non-consanguineous couple, referred for diagnostic screening of genes associated with severe eye malformations. Family history was remarkable for a maternal uncle with anencephaly. The proband presented with spina bifida at 20 weeks’ gestation. He was a term delivery with birth weight 3.2 kg. At birth, he was noted to have widely spaced eyes, unilateral phthisis bulbi, downturned corners of the mouth, small penis and small feet with upturned nails. At 8 months his length, weight and head circumference were recorded at ninth centile. He had a repaired myelomeningocele, hydrocephalus with a ventriculoperitoneal shunt and left grade 2 vesicoureteric reflux with a normal renal ultrasound. MRI studies showed ventriculomegaly with a Chiari type 2 malformation. Developmental milestones were reported to be normal at 8 months. Array CGH was reported as normal.
Molecular data
Family 1
LOD score analyses reported in the original paper showed a peak LOD score of 1.9, between the disease and markers on Xq27-q28, below the 2.0 threshold recommended to declare X chromosome linkage.21 The evidence of linkage was weak unless one assumed non-penetrance, pleiotropy, variable expressivity, or gonadal mosaicism as the mutant haplotype was shared by II-18 and his affected relatives.
Repeat multimarker analysis using four informative markers DXS8091, DXS1193, DXS8086 and DXS1073 achieved a peak LOD score of 1.43 with the disease locus placed on top of DXS1073 and assuming full penetrance. The peak multimarker score was 2.19 with 75% penetrance, 2.46 with 50% penetrance and 3.31 assuming gonadal mosaicism. Haplotype analysis was performed assuming a model of X-linked recessive inheritance and showed a recombination event in affected individual III-2 between markers DXS8043 and DXS8086 restricting the possible linkage region telomeric to position ChrX(GRCh37):g.144,028,513.
Both HMGB3 and NAA10 lie within this linkage region. The coding regions and consensus splice sites of HMGB3 and NAA10 were interrogated without identification of a pathogenic variant. Trio exome sequencing was performed on individual IV-3 and his parents, and variants in the linked region were filtered for absence in male controls. A single variant was identified in the 3’UTR of NAA10, chrX:153,195,397T>C, c.*43A>G (reference cDNA NM_003491.3), altering the consensus PAS from AATAAA to AATAGA. The NAA10 variant was verified by Sanger sequencing and shown to be present in all affected individuals available for analysis, the matriarch (I-2), as well as in individual II-18, the male previously thought to be unaffected. Querying the gnomAD database for variants in the consensus PAS for NAA10 did not identify any variants in over 1 70 000 alleles.
Family 2
A re-examination of the linkage data showed that family 1 and family 2 had overlapping regions near Xqtel consistent with linkage. Based on the findings in family 1, targeted Sanger sequencing of NAA10 was performed in the proband of family 2. A second distinct variant in the the 3′ UTR of NAA10, chrX:g.153,195,401T>C, c.*39A>G, was identified, which altered the consensus PAS from AATAAA to GATAAA. The variant was verified by Sanger sequencing in carrier females and was not present in two unaffected males.
Family 3
Targeted sequencing of 41 genes causally associated with severe eye malformations in the proband from family 3 identified a third variant in NAA10, chrX:g.153,195,400T>C, c.*40A>G, which altered the consensus PAS from AATAAA to AGTAAA. The NAA10 variant in family 3 was confirmed by Sanger sequencing. DNA from the uncle with anencephaly was not available for testing.
NAA10 sequence analysis in microphthalmia/anophthalmia/coloboma cohorts
Targeted sequencing of the NAA10 PAS in 250 unrelated patients with microphthalmia/anophthalmia/coloboma selected without sex bias from the MRC Human Genetics Unit Eye Malformation cohort did not identify additional variants. No variants affecting the NAA10 PAS were identified in a further 126 males with developmental eye disorders. In addition, no pathogenic variants in the coding region and consensus splice sites of NAA10 were identified in 44 of these individuals who presented with bilateral developmental eye disorders.
X-inactivation
Four of 11 carrier females showed greater than 90% skewing of X-inactivation, individual II-2 from family 1 and individuals III-2, IV-1 and IV-5 from family 2. However, females did not show consistent skewing of X-inactivation.
RNA analyses
The consequences of the PAS variants for NAA10 mRNA expression level and structure were investigated using qPCR and RNAseq in families 1 and 2. qPCR showed carrier females from family 1 to have similar levels of NAA10 RNA as compared with control individuals. In contrast, affected individuals from families 1 and 2 demonstrated a decrease in the quantity of NAA10 RNA of approximately 50% when compared with controls (figure 2).

Reverse transcription and quantitative PCR analysis of NAA10 expression in mRNA; data were normalised to ACTB mRNA levels. (A) relative NAA10 expression in whole blood from affected individuals (family 1, individuals III-2, III-5 and IV-3), carrier females (family 1, individuals II-2, II-6 and III-15) and male and female control individuals (C1–C4). All values are shown relative to control C1. (B) NAA10 expression levels in lymphoblasts from affected male IV-6 shown relative to the expression level in unaffected male V-9, family 2.
Transcript structure was investigated by mapping RNAseq reads to the UCSC Genome Browser. RNAseq data from unaffected (family 2, individual V-9) and control individuals indicated the normal 3′ UTR of NAA10 ended at the approximate position of the predicted polyadenylation site (figure 3G-I). In contrast, for affected individuals with the PAS variants (family 1, individuals III-2, III-5, IV-3 and family 2, individual IV-6), the read depth did not decrease as expected at the polyadenylation site in the 3′ UTR, but instead declined approximately 600 bp further 3′ at a second polyadenylation site predicted by bioinformatic analysis of genomic sequence (figure 3A–C, F).22 A similar result was observed in carrier females (family 1, individuals II-2 and III-15) (figure 3D-E).

RNA-seq data comparing reads from four affected individuals, two carrier females and three control individuals, one female and two males, for NAA10. The variant positions in the NAA10 polyadenylation signal are marked by a filled red arrow. Transcription in affected individuals (family 1, individuals III-2, III-5 and IV-3 and family 2, individual IV-6) and carrier females (family 1, individuals II-2 and III-15) continues past the normal polyadenylation cleavage site and uses a cryptic signal approximately 600 bp downstream at an alternate polyadenylation cleavage site depicted by an open red arrow. NAA10 gene models are from GENCODE V.19 as included in the UCSC genome browser (GRCh37/hg19).
Discussion
Six protein complexes, NatA through NatF, carry out Nα acetylation of proteins in the cell.23 24 NAA10 is the primary subunit of the NatA complex and an auxiliary subunit of the NatE complex.24 25 The acetylation targets of the six complexes are believed to be mostly distinct and dependent on the amino acids that follow the methionine in position 1.24 Additionally, data from a knockout mouse model suggests that NAA10 plays a role in the regulation of methylation through direct DNA binding.26 Prior to the present publication, the mutational spectrum in NAA10 comprised nine missense alterations and the single splice site variant identified previously in a single family with what those authors called LMS. The first reported variant in NAA10, c.109T>C; p.(Ser37Pro), was identified in two families segregating a sex-linked recessive male lethal syndrome with an aged appearance and cardiac arrhythmias.27 Eight additional missense variants have since been reported in heterozygous females or hemizygous males with developmental delay and/or ID with or without cardiac involvement and without anophthalmia.28–32 The majority of these variants were identified as de novo alterations.28 30–32 Functional studies of the missense alterations have demonstrated a variable effect on the ability of NAA10 to acetylate substrates and the clinical phenotype may correlate with the level of acetylation dysfunction and affected substrates. Alternatively, clinically relevant predicted missense variants in NAA10 have been shown to disrupt DNA binding,26 and it is likely that different missense alterations will variably contribute to this phenomenon.
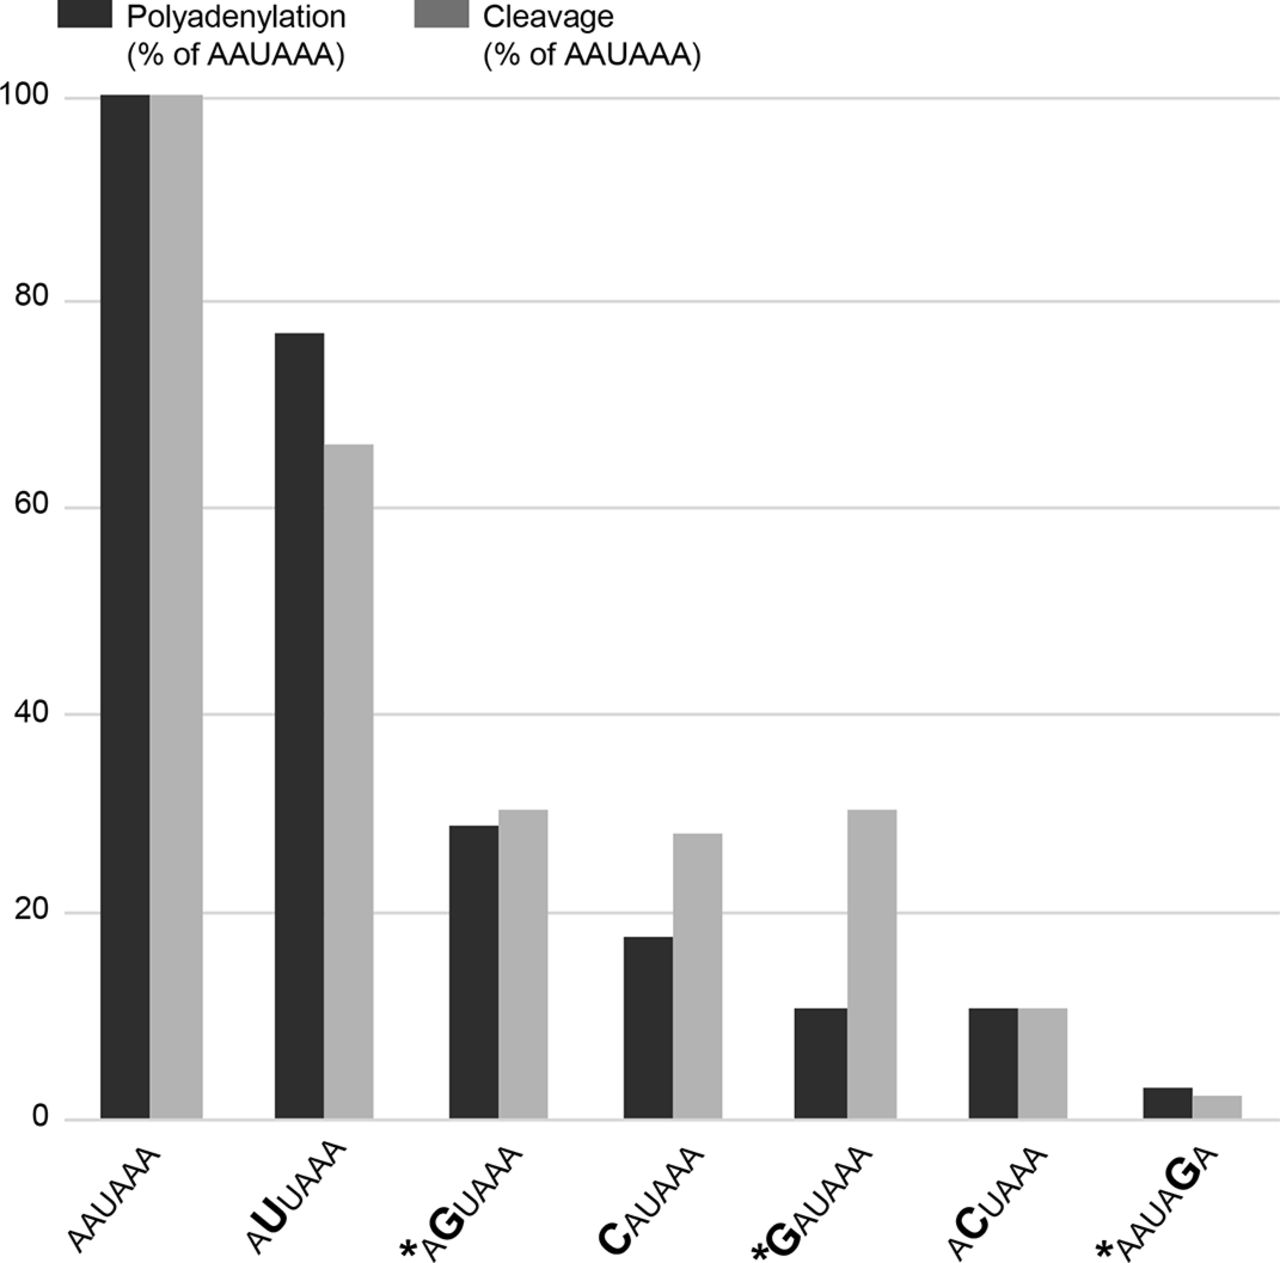
The polyA_DB database contains human mRNA polyadenylation sites based on EST/cDNA evidence33 and predicts four sites in the 3′ region of NAA10. Based on the NAA10 poly(A) sequence data in the UCSC Genome Browser, the PAS at c.*39–c.*44 is the most commonly used signal with polyadenylation occurring between 12 and 19 nucleotides 3′ of that hexamer. Three distinct nucleotides within this six-nucleotide signal are mutated in the families described here. Previous in vitro studies have demonstrated that these changes in the PAS hexamer disrupt both cleavage and polyadenylation (figure 4).34 Furthermore, these variants are analogous to variants associated with abnormal phenotypes in other genes. The NAA10 3′ UTR variant identified in family 1, c.*43A>G, alters the AATAAA consensus to AATAGA, similar to the c.*112A>G (reference cDNA NM_000518.4) pathogenic variant in the beta globin (HBB) gene (Human Gene Mutation Database [HGMD] CR900266) (see table 1).35 The 3′ UTR variant of NAA10 identified in family 2, c.*39A>G, alters the AATAAA consensus to GATAAA, similar to another reported pathogenic variant in the HBB gene (c.*108A>G, HGMD CR127145).36 The NAA10 3′ UTR variant identified in family 3, c.*40A>G, alters the AATAAA consensus to AGTAAA, similar to the variant in the ARSA gene (HGMD CR890137) reported by Gieselmann et al 37 and a variant in the SLC6A4 gene (HGMD CR102248) reported by Gyawali et al,38 although it is important to note that the wild-type PAS consensus sequence in both ARSA and SLC6A4 genes is AATAAC (see table 1). That the NAA10 variant disrupts a consensus PAS rather than a non-canonical PAS could be consistent with the observation that NAA10 variants are associated with a Mendelian disorder, whereas the ARSA and SLC6A4 variants are associated with lower penetrance traits.

NAA10 polyadenylation signal variants identified in microphthalmia/anophthalmia and review of polyadenylation signal alterations as reported in HGMD
All three families presented here manifested microphthalmia/anophthalmia with variable additional features. In family 1, individuals had variable expressivity ranging from syndromic microphthalmia/anophthalmia with severe ID to isolated cleft palate and an ear tag. A single individual, IV-3, had an open NTD. Affected individuals in family 2 had anophthalmia and additional findings including minor skeletal anomalies and attention deficit disorder, but notably all affected males were reported to have normal intelligence. The proband in family 3 had syndromic microphthalmia/anophthalmia with complex features including spina bifida. By report, a maternal uncle (deceased) to the proband had anencephaly; however, his genotype was unknown. Although the numbers are small, 2 out of 15 individuals in this study had NTDs (three if the uncle in family 2 is included). Additional families will need to be studied to determine if NTDs are a feature of NAA10 PAS variants. The mouse NAA10 knockout model had variable expressivity ranging from embryonic lethality to normal body size, and Lee et al 26 suggested this variable expressivity may result from the role of NAA10 in global methylation. The role of NAA10 in global methylation may contribute to the observed variable expressivity in these families as well. Specifically, the observed phenotype may result from the regions of the genome experiencing defective methylation in any one individual. As methylation is important in the aetiology of NTDs, it is interesting to speculate that the role of NAA10 in global methylation may account for the NTDs seen in these families. Future studies will be needed to determine if methylation or other factors play a role in the variable expressivity seen with these variants.
Cleavage and polyadenylation signals reside in the 3′ UTRs of mRNAs and include a number of key cis elements including the AAUAAA PAS, which typically resides 10–30 nucleotides upstream of the cleavage site (reviewed in refs 39 40). Ninety per cent of identified PAS conform to the hexanucleotide sequence AAUAAA, and most of the remaining 10% differ by only a single substitution.39 The AAUAAA hexamer is critical both for cleavage and poly(A) addition,41 and the effects of point mutations in this hexamer have been determined.34 Disease-associated variants in PAS are rare, and consequently, we were surprised to identify three such variants in this rare disorder. To identify all known consensus PAS variants, we performed a directed search of the HGMD.42 We identified 31 reported PAS variants in 19 genes (table 1), 23 associated with Mendelian disorders and 8 associated with a functional polymorphism or susceptibility. Overall, PAS variants account for 23 out of the ~195 000 DM variants in HGMD or 0.012% of the total. As well as being individually uncommon, such variants have a highly non-random distribution across genes. Of the 23 variants associated with Mendelian disorders, nine are in HBB, four are in HBA2 and two are in FOXP3, the remainder being singletons. Some of this distribution can be explained by the depth and detail to which the various genes have been studied, HBB being one of the best studied of all human genes. To allow for this, the proportion of polyadenylation variants to all known pathogenic variants in a given gene can be tabulated. When expressed in this way, a very different pattern emerges. NAA10 has the highest proportion of PAS variants, at 25%. The next highest cluster of genes includes IGF1, NAT1, BMP1 and SLC6A4, each of which has a single PAS variant, but a relatively small overall number of variants, yielding a high proportion. HBB and HBA2 lie in the middle of the range at about 1% of variants, reflecting the large number of variants in these well-studied genes. Most of the clinical phenotypes associated with PAS variants are typical of those seen for loss of function variants in the same gene, although they may be found with milder forms of the phenotypes; for example, in HBB,36 ,43 the phenotypes of PAS variants are described as either typical or mild thalassaemia. The contribution to milder phenotypes has two implications; first, in disorders where loss of gene function would be lethal, PAS variants may allow sufficient function for viability. Second, for disorders where the phenotype is due to complete loss of function, PAS variants may be missed if they lead to a milder condition.36 We conclude from these data that the phenotypic consequence of pathogenic PAS variants is likely due to loss or partial loss of function, consistent with the experimental observations of these variants in other genes and the qPCR data we show here. Specifically, for NAA10, this suggests that partial loss of protein function due to reduced mRNA levels leads to a distinct phenotype, as compared with missense variants where the functional deficiency may only affect specific acetylation or DNA binding functions. The previously reported NAA10 splice site variant7 also showed reduced mRNA/protein supporting reduced function as causal for the microphthalmia phenotype. Alternatively, sequences within the elongated 3′ end, or within the retained intron 7 for the splice variant, may have a novel functional effect. Possible novel effects include: altered RNA or protein localisation,44 altered 3′ UTR-directed protein–protein interactions45 or acquisition of novel regulatory functions. However, since the retained sequences are distinct between the splice site variant and the PAS variants, a novel property of the mRNA is unlikely to be the mechanism accounting for the overlapping feature of microphthalmia. Additionally, the absence of a phenotype in carrier females without skewed X-inactivation suggests that any effect would need to fit a recessive model of inheritance. The general dearth of recognised PAS pathogenic variants may be in part due to the inherent difficulty in identifying PAS. In addition, many such variants may not be included in next-generation sequence data due to the limitations of exome sequencing kits and the predominant use of exome over genome sequencing.
The assessment of pathogenicity for non-coding variants in Mendelian disorders is challenging. The American College of Medical Genetics and Genomics and the Association for Molecular Pathology (ACMG/AMP)46 framework includes few criteria that are relevant to 3′ UTR variants, reflecting a focus on high penetrance coding variants. For the variants we identified here, we invoked criteria PS3 (well-established in vitro or in vivo functional studies), PM1 (located in a mutational hot spot and/or critical and well-established functional domain), PM2 (absent from controls) and PP1 (cosegregation with disease in multiple affected family members). As qPCR is not ‘a well-established functional assay’ because qPCR for NAA10 is not established in the diagnostic realm, the PS3 criteria can be downgraded to a moderate level of evidence (PS3_Mod). Additionally, our segregation data are arguably less than robust considering that we have invoked variable expressivity to explain the occurrence of the variant in II-18 in family 1 and thus PP1 might arguably be dropped. That would leave PS3_Mod, PM1 and PM2, which combine to yield a likely pathogenic assessment. Based on these pieces of evidence, we conclude that these three PAS variants are likely pathogenic.
These data have important implications for the overall process of identifying pathogenic variation. We hypothesise that PAS variants are candidate pathogenic variants for many Mendelian disorders and may be a component of the mutational spectrum of patients who are currently ‘mutation-negative’. A full assessment of this hypothesis will first require the continued development of genome (as opposed to exome) population sequence reference databases, allowing a greater understanding of the evolutionary constraints operating at 3′ UTR loci. Second, robust methods to identify PAS for all genes will need to be developed. While trivial for many genes, this is challenging for others as some use multiple polyadenylation sites and often the PAS sequence does not conform to the consensus, as demonstrated for a number of the genes that we reviewed. Third, to the extent that exome analysis continues to outpace genome analysis, it will be necessary to target these sequences in exome capture reagents. Fourth, testing laboratories will need to direct their attention to detecting and interpreting such variants. Finally, criteria for pathogenicity of non-coding variants will need to be updated. We believe that the accomplishment of these improvements in variant detection, interrogation and interpretation will allow the findings based on the three variants reported here as a cause of a rare disorder to yield benefits for the diagnosis of patients with many other genetic disorders and contribute to the overall improvement in clinical genomic sequencing diagnostic yield.
Acknowledgments
We would like to thank the families for their participation in this study and the NIH Intramural Sequencing Center for performing the exome sequencing on family 1 and the RNAseq data generation. We would like to thank MaryPat Jones and Ursula Harper for generating STRP genotypes for this project. We are grateful to Dorine Bax for assisting with the coordination of the project. We would like to thank Dr Michael Sheets and Dr Marvin Wickens for thoughtful review of the manuscript and permission to use figure 4 reproduced from Sheets et al (1990). The image was used by permission of Oxford University Press. We would like to thank Catherine Driscoll for help in editing the manuscript.
References
Footnotes
Contributors All authors fulfil the criteria for authorship. AAS performed and interpreted linkage analysis of family 1. JJJ performed haplotype analysis, interpreted NGS data and performed Sanger confirmation in family 1. JCS, FS and LGB provided clinical management for family 1. HMC performed sequence analysis of NAA10 in family 2. CMC and AMS provided clinical management for family 2. JND performed and interpreted qPCR experiments in families 1 and 2. SKS analysed RNA-seq data for families 1 and 2. KW and MA interpreted NGS data in family 3 and analysed sequence data in a cohort of individuals with anophthalmia/microphthalmia for variants in NAA10. TD provided clinical management for family 3. RJH and NR performed and analysed sequencing of NAA10 in a cohort of individuals with anophthalmia/microphthalmia/coloboma. DNC provided an analysis of polyadenylation signal variants within the Human Gene Mutation Database. JJJ and LGB drafted the manuscript, and all authors contributed to the manuscript. All authors read and approved the final manuscript. LGB (family 1), GCB (family 1), TMG (family 2) and DRF (family 3) planned the study. JJJ submitted the study.
Funding This work was supported by funding from the Intramural Research Program of the National Human Genome Research Institute (LGB, JJJ and JCS: grants HG200328 11 and HG200388 03). This work was supported in part by funding from the Intramural Research Program of the National Library of Medicine (AAS: grant LM00097), the extramural research programme of the National Human Genome Research Institute (AMS: grant 5U01HG009599 02), the National Institutes of Health (TMG and HMC: grant EY19497), the Hartwell Foundation (HMC), the MRC University Unit award to the University of Edinburgh for the MRC Human Genetics Unit (DRF and KW), and the MRC IGMM Translational Science Initiative (MA). This work was supported in part by grants from Baillie Gifford, Visually Impaired Children Taking Action (http://www.victa.org.uk/) and Microphthalmia, Anophthalmia, Coloboma Support (www.macs.org.uk).
Competing interests LGB receives royalties from Genentech Corp, is an advisor to the Illumina Corp, received honoraria from Wiley-Blackwell and receives honoraria from Cold Spring Harbor Press. DNC is in receipt of funding from Qiagen Inc through a License Agreement with Cardiff University. AMS receives honoraria from Wiley-Blackwell, Inc, Oxford University Press and UptoDate, Inc.
Ethics approval This study was approved by Institutional Review Boards at the National Institutes of Health (NIH), the UK Multicentre Research Ethics Committee, the University of Michigan, the University of California, Davis and the Huntingdon Ethics Committee, UK.
Provenance and peer review Not commissioned; externally peer reviewed.
Patient consent for publication Not required.