


Abstract
This study was conducted to test whether our novel combination (i.e. microanalysis) of near-infrared (NIR) spectroscopy and humidity-controlled 96-well plate, reported in a previous issue of this journal, can be successfully applied to quantitative evaluation of the pseudopolymorphic transformation of imidafenacin.
Sample powders of a drug compound were placed in a humidity-controlled 96-well plate containing various saturated salt solutions, and stored at 35°C. NIR spectra were collected using a Fourier transform-NIR spectrometer in combination with a fiber-optic probe. The actual hydrate contents of samples were determined by using thermal gravimetric analysis (TGA). A series of sets of NIR spectra and TGA data were used to establish a calibration model with which to predict the contents of monohydrate by partial least-squares regression (PLS).
The PLS calibration model analysis showed that the plots of NIR predicted values to the actual values gave a straight line with correlation coefficients of 0.9868 and 0.9936, respectively, for the 96-well plate and glass-bottle uses. The model using the 96-well plate was therefore able to predict the transformation of imidafenacin in one form to another form as quantitatively as the conventional model using glass bottles.
The present study confirmed that our microanalysis quantitatively predicts the pseudopolymorphic transformation of our tested drug in small amounts and suggests that this particular method is a simple and convenient one that may be efficiently applied to polymorphic and pseudopolymorphic studies of a hygroscopic drug candidate, at even earlier development stages than the conventional method using glass bottles.
Introduction
The development of pharmaceutical products often experiences significant obstacles when desirable solid dosage form(s) of a drug candidate have to be selected at the early stages of clinical development based on pharmacodynamic, pharmacokinetic and toxicological studies. This is probably because some candidates are hygroscopic and tend to easily form solvate forms – thus taking different polymorphic or pseudopolymorphic forms, with individually distinct physicochemical properties – or have some other peculiar physicochemical properties. Specifically, hygroscopic compounds in a solid dosage form often come into contact with water stemming from manufacturing processes and, in some cases, may take up moisture from the air during storage. Once such compounds absorb moisture, they may change from the original crystal form to a different polymorph or pseudopolymorph. Indeed, the importance of the phenomenon is emphasized because such a transformation may have an undesired effect on the physicochemical properties, and thus their finished dosage forms often show distinct pharmaceutical properties (bioavailability, efficacy, degradation, toxicity).[1]
Traditionally, analytical methods for polymorphism in bulk powders include X-ray powder diffraction (XRD),[2] differential scanning calorimetry,[3] thermal gravimetric analysis (TGA), microcalorimetry,[4] infrared spectroscopy (IR)[5] and dissolution kinetics.[6] However, these analyses are all time-consuming in terms of sample preparation and/or measurement. In comparison with these conventional analyses, near-infrared (NIR) spectroscopy is more simple and convenient because it allows the expeditious, reproducible, non-invasive analysis of solid samples with no sample pretreatment.[7] The NIR spectrum includes the wavenumber regions of 12 500–4000 cm−1 and the absorption bands in these regions consist of overtones and combinations of fundamental IR bands, typically from C–H, N–H and O–H bonds found in organic compounds.[8] NIR spectroscopy is rapidly becoming an important technique in the pharmaceutical industry. Furthermore, NIR spectroscopy has been proven to be one of the most suitable methods for the qualitative and quantitative evaluation of pseudopolymorphs, especially water solvates (hydrates and anhydrates).[9–12]
Chemometric NIR spectroscopy is an ideal method of extracting quantitative information from a chemical compound containing various components (for example hydrate or solvate). Chemometric methods such as multiple linear regression (MLR), principal component analysis/principal component regression (PCA/PCR) and partial least-squares regression (PLS) are widely used in all kinds of industry.[13] Indeed, chemometric NIR spectroscopy has been applied in the pharmaceutical industry to determine drug contents,[14] drug stability[15] and polymorphic contents in drug substances.[16–18] Recently, a novel combination of near-infrared spectroscopy and a humidity-controlled 96-well plate was developed to study the polymorphic transformation potential of a hygroscopic compound in a small amount at an early stage of drug development,[19] but that study referred only qualitatively to transformational evaluation of the compound.
Thus, the present study was conducted to test whether this particular combination[19] can be applied to quantitative evaluation of the pseudopolymorphic transformation of imidafenacin powder.
Materials and Methods
Materials
Imidafenacin, 4-(2-methyl-1H-imidazol-1-yl)-2, 2-diphenylbutanamide, was provided as the stable form I by Kyorin Pharmaceutical Co., Ltd (Tokyo, Japan). All other chemicals were of analytical grade, and the water used was filtered through a Mill-Q Water Purification System (Millipore, Bedford, MA) prior to use.
Preparation of crystalline forms of imidafenacin
Crystalline forms of imidafenacin were prepared in the same manner as in a previous study.[19] In brief, the stable form I was dissolved in acidic solution and neutralized to produce crystals (monohydrate form III). Then, the metastable form II was prepared by drying form III under certain conditions. The forms of these samples were identified by XRD, TGA and NIR.
Preparation and evaluation of standard samples
In order to prepare standard samples with varying contents of form III, about 500 mg of sample powder A (form II) was placed in a 50-ml glass bottle and exposed to the atmosphere at 35°C and 69% relative humidity (RH) for 0, 60, 90, 120, 150, 180, 240 and 300 min, where the RH value was controlled in a desiccator containing a saturated salt solution with a known corresponding RH value.[20] This condition of 35°C and 69% RH was chosen because this gives a moderate speed of transformation from form II to form III, based on previous experience.[19] The weight losses on drying of the stored sample powder A (form II) were measured by applying TGA at each of the above time points. The contents of form III in the eight standard samples withdrawn at each point were determined from the weight loss on TGA-based drying to the theoretical water content of form III (5.3%).
X-ray powder diffraction
The XRD patterns of forms I, II and III were recorded using a θ/θ diffractometer (RINT-ULTIMA III, Rigaku Co., Tokyo, Japan) at 40 kV, 40 mA with a Cu-Kα source between 5 and 40° 2θ with a scan speed of 2.0°/min in the step scan mode.
Thermal gravimetric analysis
This thermal analysis was performed using a thermogravimeter and differential thermal analyser (Thermo plus TG 8120, Rigaku Co., Tokyo, Japan). The samples (about 10 mg each of forms I, II and III) were analysed in an open aluminum pan under nitrogen purge (100 ml/min) from 30 to 120°C at a heating rate of 5°C/min.
Humidity-controlled 96-well plate method for hygroscopicity
The RH values for sample powders were controlled with a humidity-controlled 96-well plate, as reported previously.[19] In brief, a quartz glass 96-well plate divided into 32 small compartments, each consisting of three wells, was used. The sample powder (about 3 mg) and a saturated salt solution (various RH percentages of relative humidity[20]) were placed in two different wells of each compartment. The 96-well plate was sealed up with a plain quartz-glass plate and stored at a controlled temperature (35°C) with one of the compartment atmospheres at the selected RH – 11, 22, 45, 69, 83 or 91%[20]– for 300 min. Phosphorus pentoxide and water were used to control the atmosphere at 0 and 100% RH, respectively.
Fourier transform near-infrared spectroscopic analysis
Fourier transform reflectance NIR (FT-NIR) spectra were obtained using an NIR spectrometer (MPA; Bruker Optics, K. K., Tokyo, Japan), as reported previously.[19] Sixteen runs of scanning with each sample were performed through a fiber-optic probe and averaged into one scan with 8 cm–1 resolution at reflectance mode in the 12 500–4000 cm–1 frequency range. The fiber-optic probe was brought into contact with the bottom (outside surface) of the sample-containing well of each compartment in the 96-well quartz plate to apply a ray of NIR radiation and record a reflection scan from the sample (Figure 1). Five spectra per sample were recorded at each point of 0, 15, 30, 45, 60, 90, 120, 180, 240 and 300 min. The reference spectrum was obtained from an empty compartment (well) of the 96-well quartz plate.
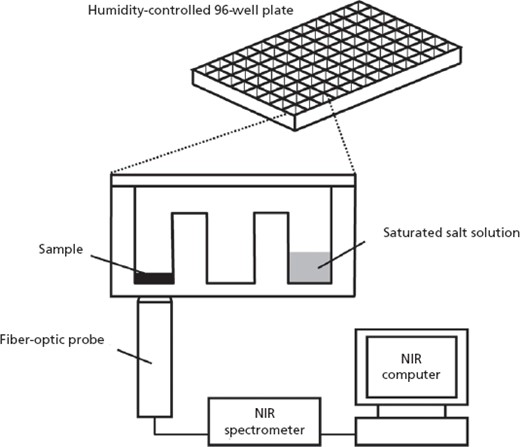
Schematic representation of the measurement system consisting of an NIR spectrometer and a humidity-controlled 96-well plate.
In order to establish a calibration model with which to predict the form III content, NIR spectra of each of the eight standard samples, which were dispensed at each of the time points into the 96-well plate from the 50-ml glass bottle kept in the desiccator, were monitored indirectly with the fiber-optic probe from the bottom of the well plate. At the same time, NIR spectra of the standard samples were also monitored with the fiber-optic probe inserted into the standard samples in a 50-ml glass bottle. Twenty-four NIR spectra from the 96-well plate data were used without any pretreatment (i.e. raw spectra) to establish a calibration model for prediction of the form III content using a PLS regression analysis. Another calibration model for prediction of the form III content was established with the 50-ml glass bottle. The results were analysed and evaluated between the calibration models. Specifically, a chemometric analysis was performed using the PLS program contained in Pirouette Ver. 3.11 (Infometrix Co., Woodinville, WA, USA). The best calibration model was selected to minimize the standard error of cross-validation (SECV) by the leave-one-out cross-validation method in the PLS software. The standard error of calibration (SEC; Equation 1), cumulative percent variance (%V) and correlation coefficient constant of calibration (r-Cal) values are listed in Table 1:
%V, SEC and r-Cal values for calibration model for content of form III by use of the 96-well plate
| Number of partial least-squares regression components used | %V | SEC | r-Cal | SECV |
|---|---|---|---|---|
| 1 | 99.24 | 1.329 | 0.6529 | 1.387 |
| 2 | 99.76 | 0.291 | 0.9868 | 0.318 |
| 3 | 99.96 | 0.105 | 0.9984 | 0.111 |
| 4 | 99.98 | 0.074 | 0.9992 | 0.082 |
| 5 | 99.98 | 0.040 | 0.9998 | 0.060 |
| 6 | 99.99 | 0.030 | 0.9999 | 0.049 |
%V, cumulative percent variance; SEC, standard error of calibration; r-Cal, correlation coefficient constant of calibration values; SECV, standard error of cross-validation.
where PRESS is the prediction residual error sum of squares, n is the validation samples and k is the number of factors in the model.
Results
Characterization of polymorphic forms II and III of imidafenacin
The XRD patterns (Figure 2) and TGA thermograms (Figure 3) of forms II and III are consistent with those of the two forms in our previous study.[19] From the thermogram data from 30 to 100°C, only form III showed a mass loss of about 5.3%, corresponding to a stoichiometric drug–water ratio of 1 : 1, as previously reported.[19]
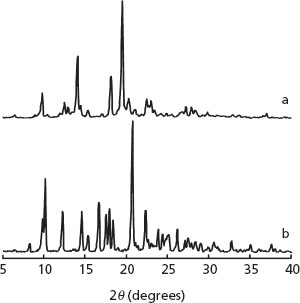
X-ray powder diffraction patterns of (a) form II and (b) form III.
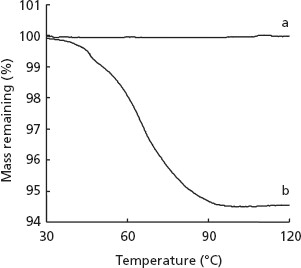
Thermal gravimetric analysis curves of (a) form II and (b) form III.
Figure 4 shows the NIR spectra of forms II (a) and III (b). In particular, the NIR spectrum of form III has a distinct absorbance, characteristic of water (due to the combination of O-H stretching and bending vibrations) at around 5280 cm−1, while form II has no absorption bands in this spectral region. Forms II and III show distinct differences in absorption patterns (between around 7100 and 7300 cm−1) of the first overtone N–H stretching of CONH2. Two other common characteristic peaks of these two NIR spectra were assigned to the second overtone of C–H stretching of the benzene ring at 8750 cm−1 and the first overtone of C–H stretching of the benzene ring at 5940 cm−1.[8]
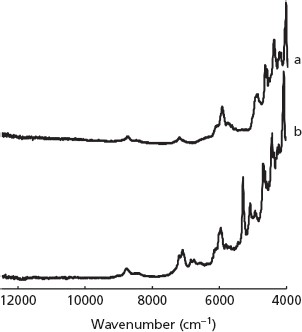
Near-infrared spectra of (a) form II and (b) form III.
Quantitative analysis of hydrate transformation by chemometric NIR spectroscopy
Figure 5 shows the TGA thermograms of form II stored in the 50-ml glass bottle at 69% RH for up to 300 min. Weight losses on TGA were used to determine form III content of the standard samples (i.e. corresponding to form II) by reference to theoretical weight loss for 100% form III. The result showed that form III content was in a range of 0.0–94.6%. Indeed, XRD analyses of these samples confirmed that form II transformed to form III. This means that form II took up moisture rapidly and transformed into form III (data not shown). These values from TGA thermograms were used as the actual form III contents to establish a PLS calibration model for prediction of the form III contents.
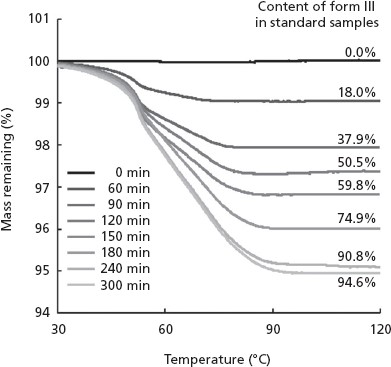
Thermal gravimetric analysis curves of standard samples prepared by exposing form II to the atmosphere at 69% RH for 300 min.
The chemometric parameters are summarized in Table 1. SECV and variance values of the calibration model for contents of form III by use of the 96-well plate were 0.318 and 1.441, respectively, when two PLS components were adopted. Since the SECV and variance values did not decrease very much, even if the number of PLS components was increased to three or more, the PLS calibration model to quantify the content of form III was established by using two PLS components for the analysis of NIR spectra without any pretreatment.
Figure 6 shows plots of the predicted contents of form III against actual values by use of the 96-well plate (a) and 50-ml glass bottles (b). The relationships between the actual and predicted form III contents of samples in the 96-well plate and the 50-ml glass bottle showed a straight line, with r-Cal = 0.9868 and 0.9936, respectively. Table 2 shows a comparison of characteristics of the PLS models for predicting the form III contents by using the 96-well plate with those for the 50-ml glass bottle. The SECV values for the 96-well plate and the 50-ml glass bottle were 0.318 and 0.213, respectively.
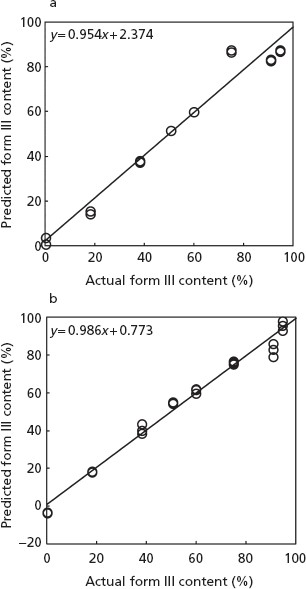
Relationship between the actual and predicted content of form III by (a) a 96-well plate and (b) a glass bottle method. Solid lines represent regression lines.
Comparison of characteristics of the partial least-squares regression models for predicting form III content
| Model | 96-well plate | 50-ml glass bottle |
|---|---|---|
| Wavenumber range (cm−1) | 12 500–4000 | 12 500–4000 |
| Spectral pretreatment | No pretreatment | No pretreatment |
| Concentration range (%) | 0.0–94.6 | 0.0–94.6 |
| Partial least-squares regression components | 2 | 2 |
| Calibration | n = 24 | n = 24 |
| y = 0.954x + 2.374 | y = 0.986x + 0.773 | |
| r = 0.9868 | r = 0.9936 | |
| SECV = 0.318 | SECV = 0.213 |
Figure 7 shows the regression vector (RV) for the calibration model with two PLS components for the 96-well plate. The RV as a weighting function of the calibration model was calculated to clarify the effectiveness of the PLS. The peak at 5280 cm−1 associated with the O–H from water molecules was the highest value, and the peak at 4960 cm−1 associated with N–H asymmetric stretching of the amide II group (νN-H in amide II) was the lowest on the RV.
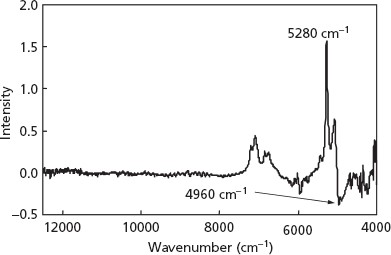
Regression vector for predicting content of form III by a 96-well plate method.
Figure 8 shows changes in the predicted form III content of the samples stored in 96-well plates at 35°C and 0–100% RH for up to 300 min. The rates of change increased proportionally at higher RH. The metastable form II rapidly converted to the monohydrate form III at 83, 91 and 100% RH. These curves reach a plateau when the metastable form II completely converts to the monohydrate form III. Complete conversion was detected within approximately 120 min when the metastable form II was stored at 83, 91 and 100% RH. The modest form change was detected at 69% RH. No form transitions were detected at 0% RH, as expected.
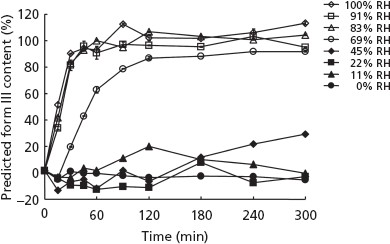
Change in the predicted form III contents of the samples stored in a 96-well plate at 0–100% RH for 300 min. Results represent mean ± SD, n = 5.
Discussion
The combination of NIR spectroscopy and a humidity-controlled 96-well plate[19] was applied to quantitative evaluation of the stability and polymorphic transformation of a bulk powder. Characterization of the crystalline forms II and III of imidafenacin by XRD, TGA and NIR analyses provided the same results (Figures 2–4) as those previously reported.[19] Differences in the XRD patterns, TGA thermograms and NIR spectral patterns between forms II and III are considered to be due to their pseudopolymorphic relationship.
Chemometric NIR spectroscopy has already become a useful and important technique for pharmaceutical analyses and has proven to be one of the most suitable methods for the qualitative and quantitative evaluation of pseudopolymorphs, especially water solvates (hydrates and anhydrates).[9–12] As in our previous study,[19] this type of spectroscopy in combination with a humidity-controlled 96-well plate was found to be a useful microanalysis method to evaluate the stability and polymorphic transformation of a drug substance and thus to characterize the physicochemical properties of a drug substance in limited amounts stored at various RH levels. This microanalysis, if applied, permits a qualitative insight into the transformations of pseudopolymorphs, and it may also permit a quantitative analysis for subsequent control of the transformation during pharmaceutical processing.
Application of the above microanalysis permitted such quantitative analysis and provided useful information about transformation in our present study. The chemometric parameters obtained are summarized in Table 1. These results indicate that, for the analysis of NIR spectra without any pretreatment, the minimum SECV value is realized by using the calibration model with two PLS components. The relationships between the actual and predicted form III contents of samples in the 96-well plate and in the 50-ml glass bottle were found to be straight lines (Figure 6). Table 2 shows comparative characteristics of the PLS models for predicting form III contents when using a 96-well plate and a 50-ml glass bottle. The SECV value for the 96-well plate was slightly higher than that for the 50-ml glass bottle (Table 2). These results indicate that it is possible to predict quantitatively the transformation of a hydrate by either of the models: using the 96-well plate and requiring only small quantities as well as using the 50-ml glass bottle, which requires large quantities of samples. The RV as a weighting function of the calibration model was calculated to clarify the effectiveness of the PLS (Figure 7). The peak at 5280 cm−1 associated with the O–H from water molecules was the highest value, and the peak at 4960 cm−1 associated with N–H asymmetric stretching of the amide II group (νN–H in amide II) was the lowest on the RV. These results indicate that the peak intensities at 5280 and 4960 cm−1 were proportional to content levels of form III because the more moisture (water) is absorbed, the more hydrogen-bond interaction develops between the O–H of the absorbed water and the N–H in amide II of the imidafenacin molecules. The changes in the predicted form III content of samples stored in a 96-well plate at 35°C and 0–100% RH for 300 min indicate that the metastable form II converts humidity-dependently to the monohydrate form III and cannot retain the original solid state of form II at more than 69% RH (Figure 8).
The present study indicates that the combination of chemometric NIR spectroscopy and a humidity-controlled 96-well plate can be successfully applied to transformational evaluation with only small amounts of drug candidates and that this microanalysis may be useful to optimize the formulation and development of a suitable dosage form for a hydrate-forming drug candidate.
Conclusion
The pseudopolymorphic transformation of small imidafenacin samples was quantitatively predicted by utilizing chemometric NIR spectroscopy in combination with a humidity-controlled 96-well plate under various levels of RH. Utilization of this method allows efficient polymorphism studies with much smaller amounts of a drug candidate and at earlier development stages than conventional methods with glass bottles.
Declarations
Conflict of interest
The author(s) declare(s) that they have no conflicts of interest to disclose.
Funding
This research was supported in part by a Grant for MEXT. HAITEKU (2004–2008) from the Ministry of Education, Culture, Sports, Sciences and Technology, Japan.
