


Abstract
Insect head shapes are remarkably variable, but the influences of these changes on biomechanical performance are unclear. Among ‘basal’ winged insects, such as dragonflies, mayflies, earwigs and stoneflies, some of the most prominent anatomical changes are the general mouthpart orientation, eye size and the connection of the endoskeleton to the head. Here, we assess these variations as well as differing ridge and sclerite configurations using modern engineering methods including multibody dynamics modelling and finite element analysis in order to quantify and compare the influence of anatomical changes on strain in particular head regions and the whole head. We show that a range of peculiar structures such as the genal/subgenal, epistomal and circumocular areas are consistently highly loaded in all species, despite drastically differing morphologies in species with forward‐projecting (prognathous) and downward‐projecting (orthognathous) mouthparts. Sensitivity analyses show that the presence of eyes has a negligible influence on head capsule strain if a circumocular ridge is present. In contrast, the connection of the dorsal endoskeletal arms to the head capsule especially affects overall head loading in species with downward‐projecting mouthparts. Analysis of the relative strains between species for each head region reveals that concerted changes in head substructures such as the subgenal area, the endoskeleton and the epistomal area lead to a consistent relative loading for the whole head capsule and vulnerable structures such as the eyes. It appears that biting‐chewing loads are managed by a system of strengthening ridges on the head capsule irrespective of the general mouthpart and head orientation. Concerted changes in ridge and endoskeleton configuration might allow for more radical anatomical changes such as the general mouthpart orientation, which could be an explanation for the variability of this trait among insects. In an evolutionary context, many‐to‐one mapping of strain patterns onto a relatively similar overall head loading indeed could have fostered the dynamic diversification processes seen in insects.
Introduction
In complex functional systems, single structures could evolve while the overall function of the complex is maintained in an optimal way. Multiple morphological combinations could be suitable to meet the same adaptive challenges or react in multiple ways to changing conditions. This many‐to‐one mapping (MTOM) of form to the same functional performance (Arnold, 1983) is thought to lead to a considerable degree of morphological diversity but might also decrease functional diversification (Wainwright et al., 2004, 2005). Also, the significance of morphological change could be overestimated if morphological evolution is functionally neutral. A widely studied example of MTOM is the four‐bar linkage of the feeding apparatus of labrid fish, where the four bony elements have different lengths but map onto a similar mechanical performance space (Alfaro et al., 2004; Parnell et al., 2008; Cooper & Westneat, 2009; Martinez & Sparks, 2017; Thompson et al., 2017). However, there are many instances where feeding systems show more fundamental morphological differences despite similar food sources, and thus the ways of morphological optimization to similar performance spaces might be difficult to detect.
Insects are a prime example for such extreme differences in the morphology of food uptake systems. Three distinct changes among the earliest divergences of biting‐chewing insects such as dragonflies, mayflies, stoneflies and earwigs, are the general orientation of the mouthparts, the connection of the endoskeleton to the head capsule, and eye size (Snodgrass, 1935; Beutel et al., 2014). In dragonflies and mayflies, the mouthparts are oriented downwards with respect to the cephalocaudal axis (orthognathous), whereas earwigs and stoneflies have prognathous (forward projecting) mouthparts. The dorsal connection of the endoskeleton to the head by the dorsal tentorial arms (DTAs), however, does not reflect this general difference. Instead, the DTAs are connected by soft ligamentous tissue in mayflies and stoneflies (Chisholm, 1962; Moulins, 1968; Staniczek, 2000), whereas it is composed of sclerotized cuticle in all studied dragonflies and earwigs (Kadam, 1961; Blanke et al., 2012, 2013). It seems unlikely that food preference or phylogeny is the cause of this variation, since both earwigs (with a stiff DTA) and stoneflies (with a soft DTA) are mostly omnivorous (Popham, 1959; Bo et al., 2007) whereas dragonflies are predators (cuticular DTA connection) and mayflies mainly are herbivorous (soft DTA connection). Additionally, the size of the eyes varies significantly within the four mentioned lineages: dragonflies show large protruding and dome‐shaped eyes (with stiff DTAs), while the eyes of the other three taxa are smaller and more integrated in the overall outline of the head capsule (but have soft and stiff DTAs). By contrast to this variety, the four lineages show mandibles of the same principal construction. They are attached with two joints, one anterior and one posterior to the head, and moved primarily by a mandibular adductor attached to the head and a lineage‐dependent set of 1–4 smaller associated adductors attached to the endoskeleton (Figure 1), which seem to have a negligible influence on bite forces (David et al., 2016a,2016b).
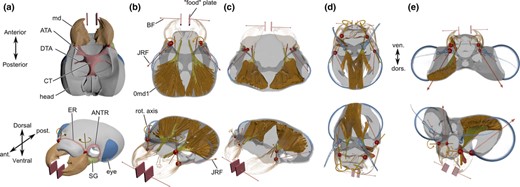
Overview of the head regions and multibody dynamics analysis (MDA) set‐up for each species. (a) The head of Forficula auricularis in ventral and dorsolateral views to illustrate a part of the head regions considered and general mandible movement. (b–e) The mandible muscle set‐ups for the MDA and resultant joint reaction force (JRF) vectors for Forficula auricularia (Dermaptera) (b), Perla marginata (Plecoptera) (c), Siphlonurus lacustris (Ephemeroptera) (d) and Lestes virens (Odonata) (e). Heads not to the same scale, JRFs have been scaled to aid visibility of JRF directions within each system (Forficula & Perla: 2×; Siphlonurus: 10×; Lestes: 5×). ATA, anterior tentorial arm; DTA, dorsal tentorial arm; CT, corpotentorium; ER, epistomal ridge; SG, subgenal ridge; BF, bite force; md, mandible; 0md1, M. craniomandibularis internus.
Although it is straightforward to describe the above‐mentioned morphological changes and derive lineage‐dependent morphological characteristics of prognathy and orthognathy (Snodgrass, 1935; Beutel et al., 2014), the biomechanical consequences of such morphological changes are unclear. In theory, each food uptake system is adapted to its environment, but other factors such as the functional requirements of sensory input (mainly eyes and antennae) and even flight styles (Turlure et al., 2016) might also influence the morphology of head regions so that only suboptimal biomechanical solutions for food uptake are possible.
In this context, the study has two aims. Firstly, the aforementioned differences in eye size and dorsal endoskeletal connection are investigated to understand the influence of these structures on overall loading of the head capsule during food uptake. Secondly, a suite of morphological changes associated with pro‐ and orthognathy are investigated to determine whether they lead to a similar biomechanical performance in certain regions of the head or even the whole head. In this context, we define biomechanical performance as the strain occurring in a given structure relative to another structure in the same specimen. Although such a metric is not immediately accessible compared to more obvious shape metrics visible on a given specimen, relative strains allow for a comparison of the mechanical behaviour of equivalent structures in different specimens irrespective of isometric size changes and multidimensional changes in shape. Both aims of this study are investigated using finite element analysis (FEA), an engineering technique which provides information about the deformations across the head, and the corresponding stresses and strains, during food uptake. The influence of eyes and the dorsal endoskeletal connection on the head capsule strain is assessed by systematically altering the material parameters of these structures during FEA, whereas the biomechanical performance is investigated by an analysis of the strain in each head region relative to other head regions, or the whole head followed by a subsequent comparison of these relative strains between species.
Materials and methods
We used single specimens from four species, Lestes virens (Odonata: Zygoptera), Siphlonurus lacustris (Ephemeroptera: Siphlonuridae), Perla marginata (Plecoptera: Perlidae) and Forficula auricularia (Dermaptera: Forficulidae). Adult specimens were used in the case of the dragonfly and the earwig. Although aquatic larval stages are considered a secondary development during insect evolution (Grimaldi & Engel, 2005), final instar larvae had to be used for the other two species since adult mayflies have vestigial mouthparts and highly specialized head shapes probably adapted to mating, whereas stoneflies seem to show changes in food preference and feeding habits in the adult stage (Rúa & de Figueroa, 2013) with most of the food uptake realized during the larval stage. Specimens were collected locally or obtained from alcohol preserved natural history collections, fixed with alcoholic Bouin's solution (Romeis, 1989) and washed in ascending order with 70–100% EthOH before drying them at the critical point (Model E4850, Bio‐Rad) to remove water without heavy organ shrinkage. Samples were then scanned using synchrotron microcomputed tomography (SRμCT) at the beamlines BW2 and IBL P05 of the Deutsches Elektronen‐Synchrotron (DESY DORIS III and PETRA III). Segmentation of the reconstructed image stacks was performed with the open source software ITK‐snap (Yushkevich et al., 2006) to obtain high resolution 3D models of the head capsules and muscle origin and insertion coordinates.
Biomechanical analysis
The biomechanics of the four head systems were studied at two levels. First, we obtained biomechanical measures for the mandible food uptake system, which can be obtained from shape alone. The mandibular mechanical advantage (MA = in‐lever to out‐lever ratio) were measured on the segmented 3D surface models in the open source software BLENDER (www.blender.org). The insertion angle of the main mandibular adductor was measured relative to the virtual axis spanning between the two mandible joints (‘rotation axis’, Fig. 1b) by taking the axis between the centroid of the muscle attachment area and the mandibular insertion as a reference to the joint rotation axis (henceforth referred to as joint axis angles, JAA). Furthermore, we calculated the effectiveness of the transmission of muscular forces to the food item (force transmission coefficient, FTC) by dividing the total estimated bite force by the sum of muscle forces during biting. Finally, we calculated the eye‐to‐head surface ratios.
Second, we used finite element analysis (FEA) to obtain information about the deformations across the head, and the corresponding stresses and strains during food uptake (i.e. a force plus shape based metric). FEA requires information about the physiological forces acting on the system to produce meaningful results. Therefore, we modelled the muscle arrangements in each specimen using multibody dynamics analysis (MDA), which allows for an estimation of the forces (muscle forces, bite force [BF] and joint reaction forces [JRFs]) that must be acting on the head during food uptake. These physiologically representative forces are then applied to a finite element model, in order to obtain information about the patterns and magnitudes of strain occurring on the head capsule during mouthpart loading. Please refer to the Data S1 for details about the MDA set‐up.
Segmented 3D models were imported into the open source finite element solver VOX‐FE2 (Liu et al., 2012) with the predicted bite force, JRFs and individual muscle strand forces applied as the loading conditions. To prevent free body motion due to rounding errors in the solution phase, three separate nodes at the occipital foramen were also constrained in all directions. Material properties (Young's moduli) of parts of the head capsule (clypeus and anterior tentorial arms) and eyes were measured for the dragonfly by nano‐indentation under wet conditions using established routines (Oliver & Pharr, 1992; Klocke & Schmitz, 2011; Blanke et al., 2017a) (Data S1). A Poisson's ratio of 0.3 was assumed for all materials based on studies of lobster cuticle (Fabritius et al., 2009; Nikolov et al., 2010). We used the same material parameters (obtained for the head of the dragonfly) with the other three species, since we are interested only in the influence of shape on strain patterns and relative strain levels and did not wish to confound the results using different material properties. The effect of changing material properties of the eyes and tentorial structures on strain patterns was investigated (in all species), since DTA‐head connections are variable across lineages and we expected that eyes should experience negligible deformation. Therefore, the eyes and dorsal tentorial arms (DTAs) were also simulated with different stiffness values suggested from the literature for ‘soft’ ligamentous tissue (350 MPa (Zajac, 1989; Maganaris et al., 1998)). Table 1 gives an overview of the material parameter combinations used for each FEA model.
Summary of the different Young's modulus combinations used for the head capsule, dorsal tentorial arms (DTAs) and eyes. The values for the head and eye were measured for three dragonfly species and applied to the other species. A Poisson's ratio of 0.3 was assumed for all materials. All values in MPa. Please refer to the Data S1 for further information on material parameter measurements
| Species | Head | DTA | Eye |
| L. virens | 7300 | 7300 | 4000 |
| 7300 | 350 | 4000 | |
| 7300 | 350 | 350 | |
| S. lacustris | 7300 | 7300 | 4000 |
| 7300 | 350 | 4000 | |
| 7300 | 350 | 350 | |
| P. marginata | 7300 | 7300 | 4000 |
| 7300 | 350 | 4000 | |
| 7300 | 350 | 350 | |
| F. auricularia | 7300 | 7300 | 4000 |
| 7300 | 350 | 4000 | |
| 7300 | 350 | 350 |
From the FEA results, we then extracted the maximum (most tensile) and minimum (most compressive) principal strains (ɛ1 and ɛ3, respectively) for the following head regions: anterior tentorial arms (ATA), dorsal tentorial arms (DTAs), corpotentorium (CT), whole tentorium (TENT), epistomal ridge/area (ER), (sub)genal ridge/area (G/SG), eye, DTA connection, the head excluding the eye and the complete head. The tentorium and ridge/sclerite areas were chosen since these were hypothesized previously as being relevant for the biting‐chewing process (Snodgrass, 1935; von Kéler, 1963; Matsuda, 1965) especially in considerations of the evolution of stronger bite forces (Staniczek, 2000, 2001; Blanke et al., 2017b). The rest of the head and eye regions were chosen to investigate how the strains in the tentorial and ridge/sclerite areas relate to the strain occurring on, for example, the whole head or the eyes alone. The respective elements within each FEA model were thus repeatedly selected using custom scripting in the visualization and post‐processing software ParaView (Ahrens et al., 2005) to ensure that the same elements were selected after each simulation. To study how the chosen head regions compare in their strain to each other and to compare strain between species, we calculated the respective interquartile range of the principal strain distributions (IQR; 3rd minus 1st quartile of a given distribution). We then calculated the ratio of IQRs of every possible combination of head region pairs to obtain a size‐independent measure of the relative loading of each region relative to the other head regions. With ten single head regions, this resulted in 90 combinations of head region pairs (45 each for ɛ1 and ɛ3).
Results
General morphology, muscle‐ and bite forces
The mayfly Siphlonurus showed the lowest predicted bite force (BF, 0.067N, Table 2), whereas the stonefly Perla had the highest (0.816N). The predicted muscle forces showed that in Siphlonurus the main adductor makes a comparatively low contribution (~61–67%, Table 3) of the overall mandible muscle force production, whereas in the other species, 90% or more of the force is generated by the main adductor. The most effective transmission of muscle force to bite force (force transmission coefficient, FTC = total BF/sum of left and right muscle forces) was shown by Forficula (39%, Table 2), whereas Siphlonurus was the least effective (~22%).
Head width (largest distance including eyes), bite force (BF) predictions, force transmission coefficients (FTC = total BF/sum of left and right muscle forces), mandibular advantage (MA) and joint reaction forces (JRFs) for each species. The JRF ratio was calculated by dividing the respective anterior (or dorsal) JRF with the posterior (or ventral) JRF. The eye‐to‐head ratio was obtained by dividing the sum of the left and right eye surfaces with the head capsule surface. JAA = axis between the centroid of the muscle attachment area and the mandibular insertion with the virtual rotation axis generated by the mandible joints as a reference
| Species | Head width [mm] | BF [N] | Total BF [N] | FTC | MA | JRF [N] | JRF ratio | JAA [°] | Eye/head ratio | |||||||
| L | R | L | R | L ant. | L post. | R ant. | R post. | L | R | L | R | |||||
| S. lacustris | 2.01 | 0.029 | 0.038 | 0.067 | 0.225 | 0.42 | 0.51 | 0.08 | 0.09 | 0.09 | 0.10 | 0.82 | 0.93 | 67 | 73 | 0.46 |
| L. virens | 5.23 | 0.169 | 0.228 | 0.397 | 0.356 | 0.42 | 0.44 | 0.33 | 0.30 | 0.35 | 0.34 | 1.10 | 1.03 | 84 | 92 | 0.71 |
| P. marginata | 8.03 | 0.408 | 0.408 | 0.816 | 0.270 | 0.39 | 0.41 | 0.33 | 1.04 | 0.52 | 0.81 | 0.32 | 0.64 | 88 | 79 | 0.09 |
| F. auricularia | 3.12 | 0.386 | 0.369 | 0.755 | 0.392 | 0.53 | 0.50 | 0.23 | 0.67 | 0.29 | 0.65 | 0.33 | 0.45 | 80 | 80 | 0.08 |
Predicted forces in the mandibular adductor muscles of each species during biting and their relative contributions to total muscle force output
| Species | Muscle | Muscle force [N] | % Muscle | ||
| L | R | L | R | ||
| S. lacustris | M. craniomand. internus | 0.0825 | 0.1089 | 61.0 | 67.3 |
| M. tentorio‐mand. lat. sup | 0.0033 | 0.0033 | 2.4 | 2.0 | |
| M. tentoriomand. lat. inf | 0.0231 | 0.0231 | 17.1 | 14.3 | |
| M. tentorio‐mand. med. sup | 0.0033 | 0.0033 | 2.4 | 2.0 | |
| M. tentorio‐mand. med. inf | 0.0231 | 0.0231 | 17.1 | 14.3 | |
| L. virens | M. craniomand. int | 0.4929 | 0.5029 | 89.9 | 88.8 |
| M. tentorio‐mand. lat. sup | 0.0009 | 0.0009 | 0.2 | 0.2 | |
| M. tentoriomand. lat. inf | 0.0175 | 0.0205 | 3.2 | 3.6 | |
| M. tentorio‐mand. med. sup | 0.0065 | 0.0066 | 1.2 | 1.2 | |
| M. tentorio‐mand. med. inf | 0.0302 | 0.0352 | 5.5 | 6.2 | |
| P. marginata | M. craniomand. Internus | 1.3596 | 1.4421 | 96.1 | 96.3 |
| M. tentorio‐mand. lat. sup | 0.0555 | 0.0555 | 3.9 | 3.7 | |
| M. tentorio‐mand. med. sup | 0.0555 | 0.0553 | 3.8 | 3.6 | |
| F. auricularia | M. craniomand. internus | 0.7920 | 0.9471 | 89.5 | 90.9 |
| M. tentoriomand. lat. inf | 0.0464 | 0.0474 | 5.2 | 4.5 | |
| M. tentorio‐mand. med. inf | 0.0466 | 0.0475 | 5.3 | 4.6 | |
The ratio of anterior‐to‐posterior JRFs (‘JRF ratio’, Table 2) revealed that Siphlonurus and Lestes have nearly equal force distribution between the anterior and posterior mandibular joints, whereas in Perla and Forficula the anterior mandibular joint is only loaded with 32–64% of the force present at the posterior joint during biting. Forficula also showed the highest MA for the left and right mandibles of 0.53 and 0.50, respectively; however, the MAs were variable with, for example, Siphlonurus returning a similar MA of 0.52 for the right mandible, but only 0.42 for the left. The joint axis angles (‘JAA’, Table 2) relative to the muscle insertion showed that in Siphlonurus the main mandibular adductor inserts at an angle of 67–73° relative to the joint axis, whereas in all other species the insertion angle is close to 90° (Table 2). The eye‐to‐head surface ratio varied by an order of magnitude with the highest value in Lestes (0.71) and the lowest in Forficula (0.08).
Strain during biting
All species showed high maximum and minimum principal strains (ɛ1 & ɛ3) at the anterior and posterior joints, the subgenal area, the base of the antennae and the endoskeleton (especially at the anterior tentorial arms, Fig. 2). In those species with a well‐developed epistomal and subgenal ridge (ER & SR, Fig. 2) such as Lestes and Forficula, the strain was also high in these regions, whereas in the other two species the strain was more evenly distributed in the subgenal area and epistomal area, although Siphlonurus with its slightly thickened and bended subgenal and epistomal areas also showed higher strain in these regions.
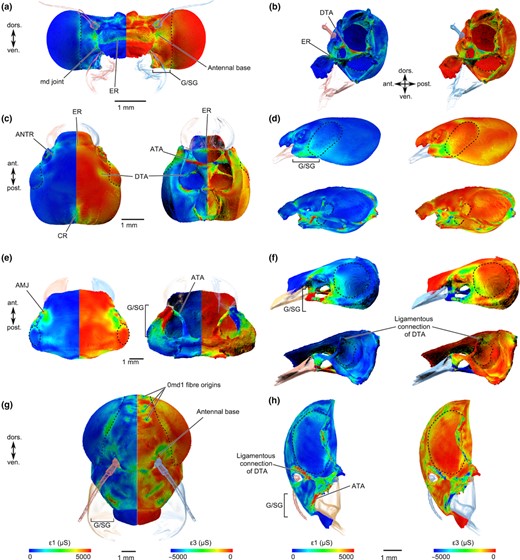
Results (most tensile principal strain (ɛ1) & most compressive principal strain (ɛ3)) of the finite element analysis (FEA) for each head capsule. (a+b) Lestes virens in frontal and lateral views (left head side half transparent to provide internal lateral view). (c) Forficula in dorsal and ventral views. (d) Forficula in lateral view (lower half of (d) with left head side half transparent). (e) Perla in dorsal and ventral views. (f) Perla in lateral view (lower half of (f) with left head side transparent). (g+h) Siphlonurus in frontal and lateral views in (h) (left head side in (h) half transparent to provide internal lateral view). The left side in (a,c,e,g) shows most tensile principal strains (ɛ1), the right side shows the most compressive principal strains (ɛ3). FEA results are for actual material properties of the dorsal tentorial arms and eyes, respectively, not for simulated alternative properties. All values are in microstrain (μS), and the position of the eyes is indicated with dashed lines where appropriate.
Relative IQRs for each head region pair showed a wide distribution of strain ratios between species. Exemplary extreme cases are the strain ratios between the dorsal tentorial arms in the stonefly (0.07) and the dragonfly (6.41), the ratio between the eye and the DTA in the dragonfly (0.05), or the ratio between the DTA and the complete head in the dragonfly (6.58) (Fig. 3, Table S1). Although most IQRs for each head region pair showed a comparatively wide distribution, the anterior tentorial arms, the genal/subgenal area (or ridge) and the DTAs were more highly loaded than all other head regions, whereas the spread was lower when comparing the eye, the complete head capsule and the whole tentorium to single head regions (Fig. 3).
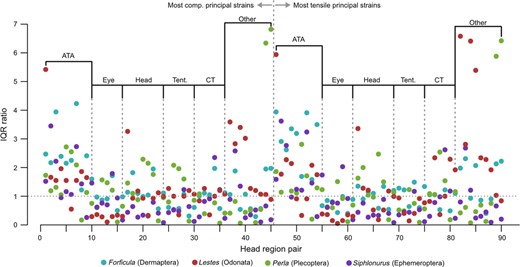
Interquartile range (IQR) ratios of the most tensile and most compressive strains (ɛ1 & ɛ3) for all possible combinations of investigated head regions (see Material and Methods and Table S1 for an overview of head region pairs). Divisions show which head region was tested against other parts of the head. ATA, anterior tentorial arms; Tent., whole tentorium; CT, corpotentorium; Other, remaining head regions.
Relative IQRs of highly loaded areas such as ridges and endoskeletal elements showed that especially in the dragonfly a comparatively higher proportion of strain is accommodated by the dorsal tentorial arms and the epistomal ridge (Fig. 4). In the stonefly, the anterior tentorial arms and the corpotentorium relative to the dorsal tentorial arms and the rest of the tentorium showed the highest strain, whereas the earwig and the mayfly showed a comparatively high strain in the anterior tentorial arms relative to the epistomal ridge/area and the rest of the tentorium.
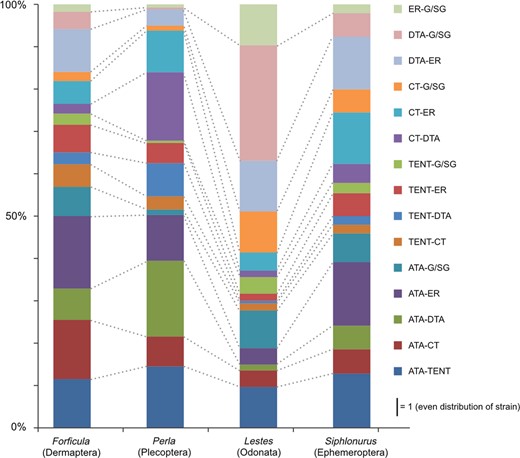
Comparison of the ratios of interquartile ranges (rIQRs) for all head region pairs associated with ridges and tentorium structures between the four species. ER, epistomal ridge/area; G/SG, genal/subgenal area (including subgenal ridge); DTA, dorsal tentorial arm (including connection to the head capsule); CT, corpotentorium; TENT, whole tentorium; ATA, anterior tentorial arm.
Histograms of the cumulative relative strain frequencies in the head, eyes and dorsal tentorial arms for different material combinations (Fig. S1) showed that the simulated material property changes of the eye have an insignificant (<1%) influence on strain distribution of the head capsule in Lestes, Forficula and Perla, whereas the effect was >20% in Siphlonurus. Variation in material properties of the dorsal tentorial arms leads to higher changes in strain distribution in Siphlonurus (~8%) and Lestes (~5%) compared to Perla and Forficula (~1%).
Discussion
Based on morphological observations, it has been hypothesized that the evolution of anterior mandibular ball‐and‐socket joints, a strong genal/subgenal area (with a subgenal ridge) and strong anterior tentorial arms in Odonata and Neoptera, probably played an important role in the development of higher bite forces compared to mayflies and silverfish (Staniczek, 2000, 2001). Due to the sparse literature record concerning insect bite forces (Wheater & Evans, 1989; Goyens et al., 2014; Weihmann et al., 2015; David et al., 2016b), it was, however, unclear whether insects from these different lineages but with comparable head sizes (and thus muscle volumes) really show larger bite forces. Indeed, the bite forces predicted in the present study are in line with earlier bite force measurements for other insects with comparable head widths and mandibular set‐ups (Wheater & Evans, 1989; Weihmann et al., 2015; David et al., 2016b). Given the increase in bite force from mayflies to Neoptera, this implies that the morphological changes in the above‐mentioned structures allow a better distribution of the strain resulting from the larger bite forces. Our biomechanical study broadly confirms these previous suggestions: although the head morphologies considered here are highly disparate, a range of structures such as the genal/subgenal and epistomal area (or the respective ridges) and the anterior and dorsal tentorial arms are consistently under high load and the strain patterns are largely similar during biting between the four species. Furthermore, in contrast to earlier suggestions (Staniczek, 2000, 2001), our data show that the aforementioned strain patterns are also present in the mayfly in the same areas where epistomal and subgenal ridges can be expected (the epistomal ridge is rather weakly developed and a subgenal ridge is absent in Siphlonurus), although this is not immediately obvious from visual inspection of the strain patterns alone (compare Figs. 2+3, Table S1). Apparently, positive selection for a strengthening of the frontoclypeal and the subgenal regions and broadened tentorial arms allowed for the evolution of higher bite forces in Odonata and Neoptera.
Despite the general similarities in strain patterns and the mechanical importance of ridges and the anterior endoskeleton as reinforcement structures, the relative response of single head regions compared to each other is still species specific (Fig. 4) with no apparent trend discernible for prognathy and orthognathy or the role of the DTA connection. In contrast, the eyes and the whole head capsule show strain ratios, which are similar across at least three or all four species (Fig. 3). This suggests that concerted changes in the proportion of transported strain for each of the above‐mentioned reinforcement structures (or the respective sclerite regions in the case of the mayfly) (Fig. 4) lead to an overall similar strain in the rest of the head capsule and the eyes. This many‐to‐one mapping of region specific strain ratios to largely similar relative strains of the whole head capsule has been sparsely assessed (Pierce et al., 2008; Stayton, 2011). Most approaches use a combination of shape analysis with different types of lever calculations to estimate force transmissions over a wider specimen sample and correlate force transmissions with shape variation (Alfaro et al., 2004; Maie et al., 2009; Stoessel et al., 2013; Anderson et al., 2014; Collar et al., 2014; Martín‐Serra et al., 2014; Scales & Butler, 2016; Martinez & Sparks, 2017). Common to these approaches is their use of phylogenetically closely related species, which show variation in a functional subsystem. Here, strain comparisons were used to assess the mechanical role of structures in more distantly related species with highly different head morphologies. It has to be emphasized that changes of general head orientation or tentorium can even occur within insect orders (e.g. in mayflies (Staniczek, 2001)) and are frequent phenomena across insects. In these instances, functional optimizations might be difficult to detect with biomechanical parameters characterizing only one component of a given structure (such as lever calculations), that is low‐dimensional mechanical determinants. In contrast, FEA takes into account the multidimensional aspects of a functional system and therefore might be suited to detect how morphological structures in more distantly related taxa (probably even accompanied by unclear homology for substructures) adapt to similar biomechanical challenges such as food uptake. Optimizations which are not apparent by shape analysis alone should therefore be detectable. This aspect is especially valuable in the context of larger assessments of shape–function covariations, for example across different organismal groups such as insects and vertebrates, in order to reveal common principles (and principal differences) of the mechanical evolution of food uptake systems.
We suggest that concerted changes in the configuration of head sclerites and associated changes in strain distribution could be an explanation for the frequent shifts of morphologies such as the mouthpart orientation, the endoskeleton, or the eye size. Through concerted changes of morphological substructures relevant for biting‐chewing, head morphologies as a whole can change in response to altered adaptive environments imposed on, for example, sensory organs (which also likely influenced head capsule shape) while loading patterns on the head capsule during food uptake largely stay the same. It has to be stressed, however, that accurate modelling of the input forces for FEA, using MDA or other optimization techniques, is necessary in order to correctly account for the forces during feeding, otherwise erroneous strain patterns will be predicted.
Acknowledgments
We thank Anke Schmitz and Helmut Schmitz for help during the nano‐indentation experiments and Felix Beckmann (Helmholtz Centre Geesthacht), Karen Meusemann (University of Freiburg), Björn M. von Reumont (University of Leipzig) and Susanne Düngelhoef (Zoological Research Museum Alexander Koenig) for help during the SRμCT experiments. Sina David and Johannes Funken (German Sport University, Cologne) are sincerely thanked for their help during bite force measurements in earlier studies which were used here again for validation. Arnold Staniczek is thanked for providing specimens of Siphlonurus lacustris. We thank the laboratory members of the MBE group at Hull University especially Hugo Dutel for useful discussions during the analyses and the preparation of the manuscript.
Conflict of interest
The authors declare they have no conflict of interest.
Author Contributions
AB and MJF conceived and designed the study. AB conducted all analyses and tests except the MDA model of the earwig. MSP helped to generate histograms of the strain distribution, and PJW set up the MDA model of Forficula. All authors contributed to manuscript writing and approved the final version.
Funding
The financial support of the Deutsches Elektronen‐Synchrotron (DESY: I‐20120065) to perform synchrotron experiments is gratefully acknowledged. AB was supported by a research fellowship of the Deutsche Forschungsgemeinschaft (DFG: BL 1355/1‐1) and by an ERC starting grant (ID: 754290 ‘Mech‐Evo‐Insect’). Development of VOX‐FE2 was supported by EPSRC grants EP/1006745/1 and EP/1006753/1, and the embedded CSE programme of the ARCHER UK National Supercomputing Service, project codes eCSE04‐11 and eCSE01‐15.
References
Author notes
[The copyright line for this article was changed on 22 February 2020 after original online publication]
