


Abstract
Downy mildew caused by the oomycete pathogen Pseudoperonospora cubensis is a devastating foliar disease of cucurbits worldwide. We previously demonstrated that the wild melon line PI 124111F (PI) is highly resistant to all pathotypes of P. cubensis. That resistance was controlled genetically by two partially dominant, complementary loci. Here, we show that unlike other plant disease resistance genes, which confer an ability to resist infection by pathogens expressing corresponding avirulence genes, the resistance of PI to P. cubensis is controlled by enhanced expression of the enzymatic resistance (eR) genes At1 and At2. These constitutively expressed genes encode the photorespiratory peroxisomal enzyme proteins glyoxylate aminotransferases. The low expression of At1 and At2 in susceptible melon lines is regulated mainly at the transcriptional level. This regulation is independent of infection with the pathogen. Transgenic melon plants overexpressing either of these eR genes displayed enhanced activity of glyoxylate aminotransferases and remarkable resistance against P. cubensis. The cloned eR genes provide a new resource for developing downy mildew–resistant melon varieties.
INTRODUCTION
Most plants are resistant to any given pathogen. They have evolved many forms of defense mechanisms, ranging from passive-mechanical or preformed chemical barriers, which provide nonspecific protection against a wide range of organisms, to active responses that provide host- or cultivar-specific resistance (Jackson and Taylor, 1996). Although nonspecific resistance is genetically complex, specific resistance often is controlled by a specific interaction between a pathogen avirulence (avr) gene and alleles of the corresponding plant resistance (R) gene. When corresponding R and avr genes are present, the interaction between the host and the pathogen results in resistance to disease. When either is absent or inactive, disease results (Hammond-Kosack and Jones, 2000; Dangl and Jones, 2001).
The interaction between the products of R and avr genes triggers a chain of signal transduction events that lead to the activation of defense mechanisms that eventually arrest the growth of the pathogen. Specific R-mediated resistance is superimposed on basal defense pathways. These basal defenses inhibit pathogen spread after successful infection and the onset of disease (Dangl and Jones, 2001). The resistance outcome normally would be manifested as necrotic spots, termed the hypersensitive response (HR). Hypersensitivity is the most powerful mode of resistance in plants against pathogen attack. Most R genes known today are pathogen and race specific. Some, like RB from Solanum bulbocastanum, confer broad-spectrum, race-nonspecific resistance against late blight (Song et al., 2003).
R genes encode five classes of proteins. The largest class encodes nucleotide binding site–Leu-rich repeat proteins that are mostly located intracellularly. Others are transmembrane R proteins of the Cf-X family and Xa21, which carry transmembrane domains and extracellular Leu-rich repeats (Dangl and Jones, 2001), and Pto, which encodes a cytoplasmic protein kinase (Martin et al., 1993). The broad-spectrum resistance gene NPR1/NIM1 is unique because it is induced by pathogen attack, which in turn induces the expression of defense pathogenesis-related (PR) proteins (Cao et al., 1998).
The oomycete, algae-like organism Pseudoperonospora cubensis causes a devastating disease, downy mildew, in leaves (only) of cucumber, melon, watermelon, squash, and luffa. It has six pathotypes (rather than physiological races), each infecting specific genera (rather than cultivars of the same species) of the Cucurbitacae (Thomas et al., 1987b; Cohen et al., 2003). The pathogen is an obligatory parasite whose zoospores encyst and germinate through leaf stomata. Developing hyphae then colonize the mesophyll intercellularly, and cauliflower-like extensions, haustoria, penetrate the plant cell wall, invaginating the plasmalemma to absorb nutrients (Cohen et al., 1989). Infected leaf areas become chlorotic, new generations of sporangia are produced, and leaves turn necrotic in ∼1 to 2 weeks.
Previously, we identified a genotype (PI 124111F [PI]) of melon from India that exhibited multiple resistance to several diseases, including downy mildew (Cohen and Eyal, 1987). Upon inoculation of susceptible cultivars with P. cubensis, large chlorotic leaf lesions develop with abundant sporulation of the pathogen, whereas the resistant PI show minute, water-soaked, chlorotic lesions with no sporulation. Host cells within and around such minute lesions respond with massive accumulations of callose-like materials in their walls and phenolics and lignin-like substances in their cytoplasm (Cohen et al., 1989). PI is resistant to all six known pathotypes of P. cubensis (Thomas et al., 1987b; Cohen et al., 2003).
Our previous genetic results suggested that two partially dominant complementary loci, Pc 1 and Pc 2, are responsible for disease resistance (Thomas et al., 1987a; Kenigsbuch and Cohen, 1992). Additional studies revealed that resistance in PI and in its F10 derivative from the cross PI × Hemed was associated with the presence of a specific protein, P45 (Balass et al., 1992). P45 was negligible in the nearly isogenic susceptible melon line Hemed (Balass et al., 1992). In F1 plants, a moderate amount of P45 was detected (Balass et al., 1992). Interestingly, resistance diminished when the temperature under which inoculated plants were incubated was decreased from >21°C to <15°C, indicating that resistance depends on the metabolic activity of the host (Balass et al., 1993). Here, we show that P45 is a peroxisomal aminotransferase enzyme. Cloning of this enzymatic protein into a susceptible genotype of melon turned it highly resistant to downy mildew. The genes that encode this protein control enhanced enzymatic activity of the host and therefore are designated here as enzymatic resistance (eR) genes.
RESULTS
Cloning of Genes At1 and At2 from the Resistant PI
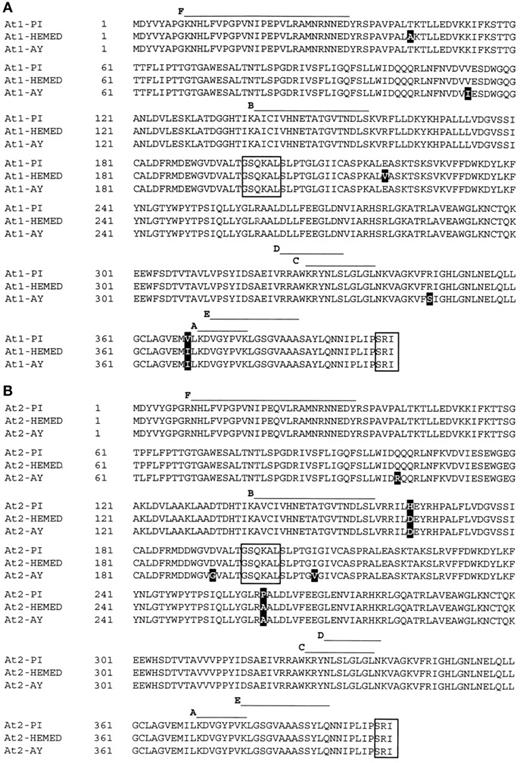
Alignment of Cucumis melo At1 and At2 from Resistant (PI) and Susceptible (Hemed and AY) Cultivars.
PI At1 (A) and At2 (B) genes were aligned with At1 and At2 from the susceptible cultivar Hemed and At1 and At2 from the susceptible cultivar AY. To produce a consensus sequence, the CLUSTAL W algorithm was used. Overlined sequences indicate the six peptides (A to F) obtained by microsequencing of the P45 protein. Darkened letters indicate different amino acids in PI compared with Hemed or AY. Boxed peptides indicate the pyridoxal-5-phosphate binding site (GSQKAL) and the peroxisomal target peptide (SRI).
Cloning of Genes At1 and At2 from the Susceptible Cultivars Hemed and Ananas-Yokneam
At1 and At2 were cloned (see Methods) from the susceptible melons Hemed and Ananas-Yokneam (AY). The deduced amino acid alignment revealed only minor differences between At1 and At2 from the susceptible cultivars compared with At1 and At2 from the resistant PI (Figures 1A and 1B). The very high degree of identity between the genes from the susceptible and resistant sources suggested that transcriptional factors control the biosynthesis of P45 mRNA.
Expression of At1 and At2 in Escherichia coli
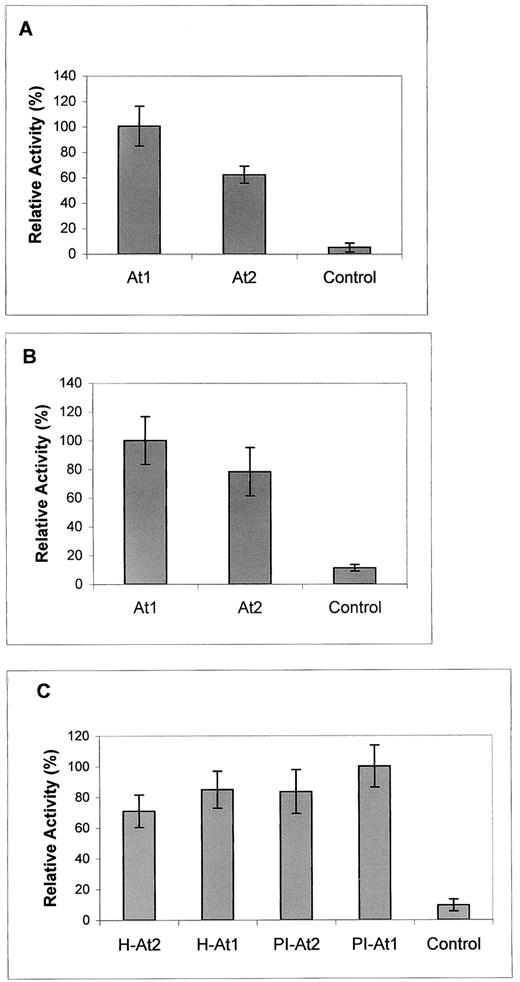
Recombinant Aminotransferase Activity in Bacterial Lysates.
(A) and (B) Activity of recombinant SGT (A) and AGT (B) in lysates of E. coli DH5α transformed with At1 or At2 from PI in pMON530 under the control of the CaMV 35S promoter. Control bacteria carried pMON530 vector only. Enzyme activity was measured spectrophotometrically at 340 nm as described (Rehfeld and Tolbert, 1972). SGT 100% activity = 3.20 nmol·min−1·mg−1 protein, and AGT 100% activity = 3.44 nmol·min−1·mg−1 protein.
(C) Activity of recombinant AGT in lysates of E. coli M15(pREP4) transformed with At1 and At2 from PI or Hemed (H) in pQE-30UA. Control bacteria carried pQE-30UA vector only. Enzyme activity was measured as described for (A) and (B). AGT 100% activity = 5.50 nmol·min−1·μg−1 protein.
In all assays, enzymatic activities in bacteria expressing At1 or At2 from either PI or Hemed were several times greater than those from control (empty vector) bacteria. Bacteria expressing At1 were more active than those expressing At2. Only a slight difference was observed between bacteria expressing the genes from PI (resistant) and those expressing the genes from Hemed (susceptible), suggesting that under bacterial regulation, all four genes may be highly expressed.
SGT and AGT Activities in Melon
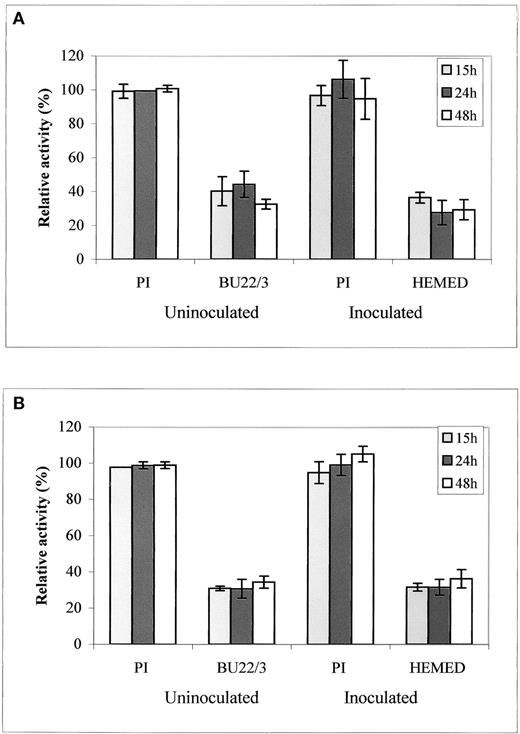
SGT and AGT Activities in Leaves of Resistant PI and Susceptible BU21/3 before and after Inoculation (15 to 48 h) with Downy Mildew.
SGT (A) and AGT (B) enzymatic activities were measured at 340 nm with 0.2 mg of total protein (Rehfeld and Tolbert, 1972). SGT 100% activity = 2.34 μmol·min−1·mg−1 protein, and AGT 100% activity = 1.63 μmol·min−1·mg−1 protein. Homogenates from 0.5 g of leaf tissue in 70 mM Hepes, pH 7.0, were used to determine protein concentration using the Bradford assay (Bio-Rad). Note that at 48 h after inoculation, initial symptoms were seen in PI.
AGT Activity in Segregating F2 Plants
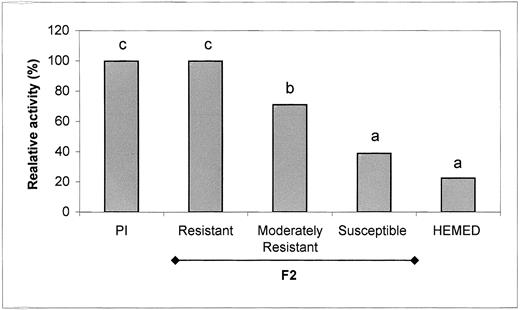
AGT Activity in a Segregating F2 Melon Population from Resistant PI × Susceptible Hemed.
F2 plants with two expanded leaves were inoculated with P. cubensis. Plants were evaluated at 7 days after inoculation for resistance, and the third leaf from 6 to 10 plants from each subgroup was analyzed for AGT activity. Different letters above the bars indicate a significant difference at the 5% probability level (Duncan's multiple range test). RT values of the resistant, moderately resistant, and susceptible offspring were 34 to 44, 23 to 33, and 11 to 12, respectively.
Transformation of At1 and At2 into Susceptible Melon Plants
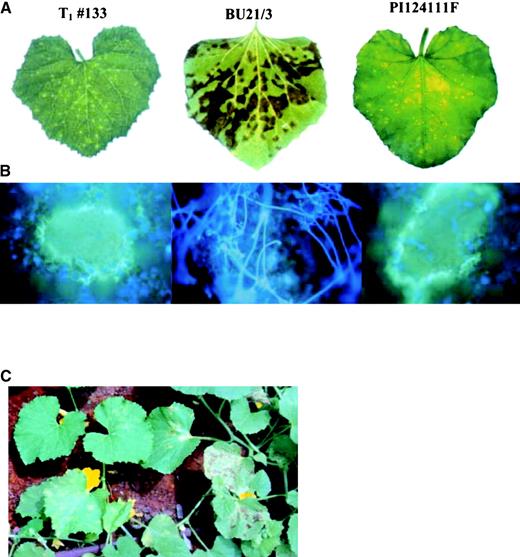
Macroscopic and Microscopic Appearance of Downy Mildew in Melon Leaves.
Infected leaves were collected from the shade house at 12 days after inoculation, placed in a dew chamber (18°C) to induce sporulation, and photographed.
(A) A compatible interaction (large lesions occupying most of the leaf area) in susceptible BU21/3 (RT 1) compared with a HR (small chlorotic flecks; RT 4) in the resistant PI and T1 plant 133. The latter is a transgenic plant overexpressing At2.
(B) Fluorescence micrographs of lesions taken under UV light. Leaf discs were stained with 0.05% aniline blue in 70 mM K2HPO4 buffer, pH 8.9, for 24 h and then with 0.01% calcofluor solution in water for 5 min. Note the sporulation in BU21/3 compared with the lack of sporulation and callose surrounding the lesions in PI and T1 plant 133.
(C) Resistance to downy mildew in transgenic plants overexpressing At1 in the shade house. At left, resistant T1 plant 184 showing HR chlorotic flecks; at right, susceptible BU21/3 plant showing extensive necrotic lesions surrounded by chlorotic halos.
SGT and AGT Activities in Transgenic Melon Plants
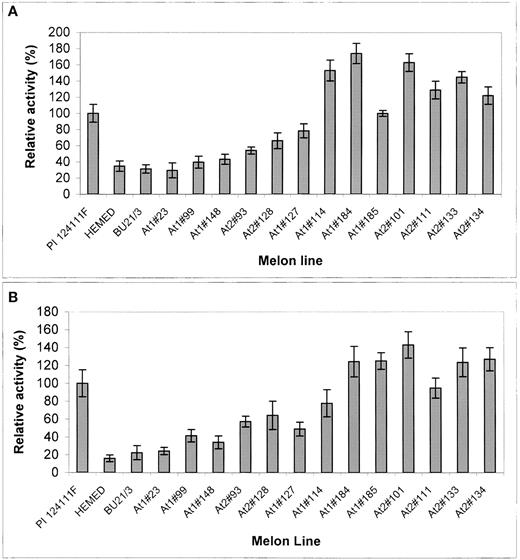
SGT and AGT Activity in Melon Leaves of the Resistant PI, Susceptible Hemed and BU21/3, and Transgenic Plants Expressing At1 or At2.
For details, see Results. SGT (A) and AGT (B) enzymatic activities were measured as described for Figure 3.
DNA and RNA Gel Blot Analyses of At1 and At2
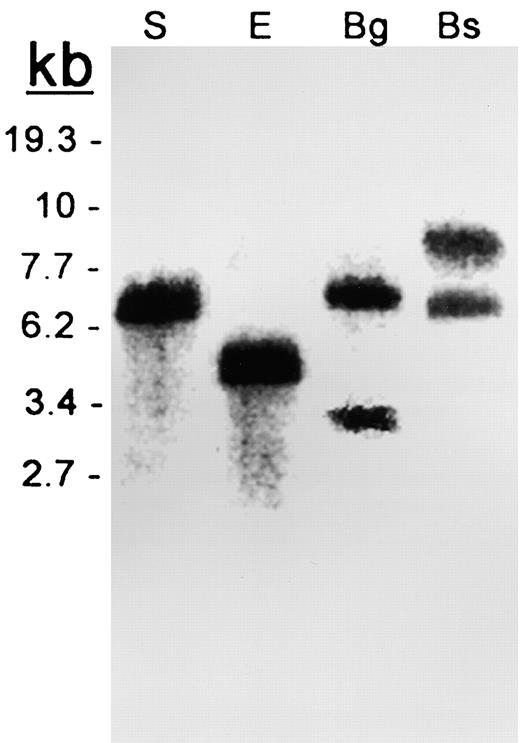
DNA Gel Blot Analysis of the Resistant Melon PI.
Genomic DNA was digested with SacI (S), EcoRI (E), BglII (Bg), and BstEII (Bs) and probed with the At1 and At2 coding regions. In lanes S and E, At1 and At2 overlap. In lanes Bg and Bs, the upper band is At2 and the lower band is At1.
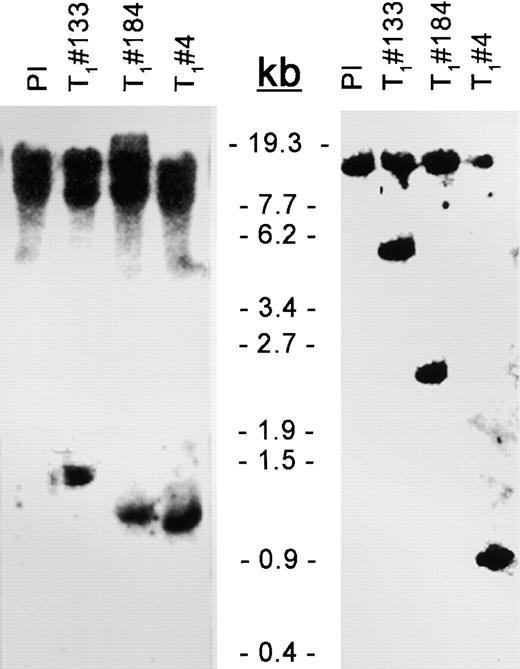
DNA Gel Blot Analysis of Transgenic Plants Overexpressing At1 or At2.
Genomic DNA from the resistant PI or from T1 transgenic plant 4, 133, or 184 was digested with either BstEII (left gel) or SacII (right gel), blotted, and probed with the At1 and At2 coding regions. The bands <6.2 kb indicate the fragments of the transgenes. The upper bands show the endogenous genes At1 and At2.
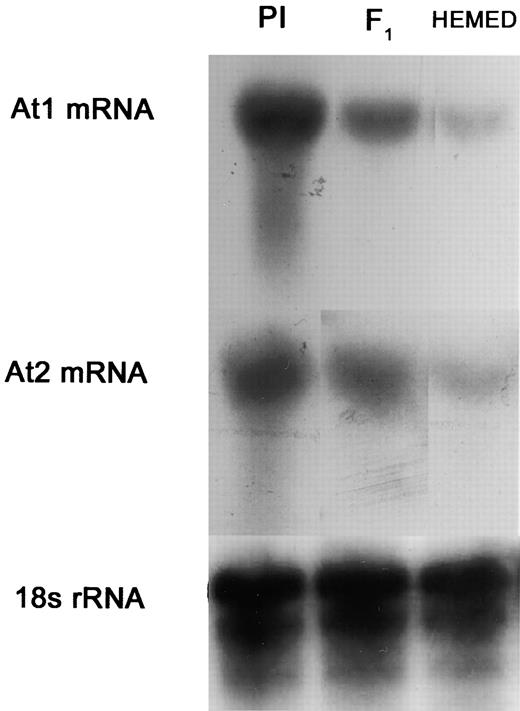
RNA Gel Blot Analysis of At1 and At2 from Leaves of the Downy Mildew–Susceptible Hemed, the Resistant PI, and Their F1 Hybrid Offspring.
The RNA gel blot was hybridized with specific probes for At1 and At2. 18S RNA was used as a standard.
Glycolate Oxidase Activity in Resistant and Susceptible Melon Plants
Glycolate oxidase (GO) catalyzes the oxidation of glycolic acid to glyoxylate and H2O2 in the peroxisomes during photorespiration. GO activity was measured in the resistant and susceptible melons with the premise that enhanced glyoxylate aminotransferase activity may affect its activity. The data shown in Table 1
Activity of GO in Leaf Extracts of Susceptible (Hemed) and Resistant (PI) Melons
Change in OD (mg protein/min) | |||||||
|---|---|---|---|---|---|---|---|
| Hemed | PI | ||||||
| Plant | Leaf 1 | Leaf 2 | Leaf 1 | Leaf 2 | |||
| 1 | 0.036 | 0.024 | 0.423 | 0.162 | |||
| 2 | 0.022 | 0.021 | 0.627 | 0.192 | |||
| 3 | 0.020 | 0.021 | 0.496 | 0.283 | |||
| Mean ± se | 0.026 ± 0.07 | 0.022 ± 0.014 | 0.515 ± 0.084 | 0.212 ± 0.050 | |||
| Fold increase | — | — | 19.8 | 9.6 | |||
Test plants had two fully expanded leaves. Leaves 1 and 2 were counted from the stem base. Enzyme activity was measured according to Macheroux et al. (1991). The formation of o-dianisidine radical cation monitored at 440 nm (E = 11,600 M−1 cm−1) was used as a measure of GO activity.
Other experiments revealed similar low GO activity in Hemed, AY, and BU21/3 (all susceptible) but 4.1- and 4.8-fold enhanced activity in the T1 plants 4 and 133, respectively. Infection (2 days) of such plants with P. cubensis had only a minor effect on GO activity (data not shown). These data suggest that the enhanced SGT/AGT activity in the resistant genotypes is associated with the accelerated activity of the upstream, peroxisomal, photorespiratory enzyme GO.
DISCUSSION
Plants lacking passive protection against pathogens (waxy cuticular “skin” layers and/or antimicrobial compounds) have developed active protection that stops pathogen development after infection (Dangl and Jones, 2001). The hierarchy of events that constitute active defense starts with a specific recognition between the host R protein (receptor) and the avr effector (elicitor) of the pathogen. After R-avr engagement, a series of rapid metabolic events occurs (ion influx, protein kinase activation, production of reactive oxygen species and nitric oxide) along with transcriptional reprogramming. At a later stage, a set of new transcripts encode additional signaling molecules, including protein kinases and transcriptional factors, that presumably are required for defense gene activation. The functions of these defense genes include the biosynthesis of salicylic acid and ethylene, cell wall strengthening, callose formation, lignification, production of antimicrobial compounds, and rapid cell death (HR) (Jackson and Taylor, 1996; Hammond-Kosack and Jones, 2000; Heath, 2000; Dangl and Jones, 2001).
The present study describes two aminotransferase-encoding genes, At1 and At2, each capable of mediating the resistance of melon against P. cubensis. These genes are constitutively and highly expressed in leaves of the resistant melon PI and the transgenic plants that carry them. Highly homologous genes are present in susceptible melons. At1 and At2 from PI as well as At1 and At2 from Hemed are shown here to be highly expressed in transformed bacterial cells. This finding suggests that the low expression of At1 and At2 in the susceptible melon is mediated by transcriptional regulation. Indeed, mRNA transcripts of these genes are strong in PI, moderate in F1, and weak in Hemed.
The Pto-encoded protein kinase is the only constitutively expressed enzyme known to confer resistance against disease (Martin et al., 1993). Arabidopsis NHO1, which encodes a glycerol kinase, is required for resistance to and is induced by Pseudomonas syringae isolates from bean and tobacco and Botrytis cinerea (Kang et al., 2003). Other enzymes are known to indirectly confer resistance against disease—for example, a reductase that detoxifies the HT toxin of Cochliobolus carbonum affecting maize (Johal and Briggs, 1992), oxalate oxidase (Cessna et al., 2000), and oxalate decarboxylase (Kesarwani et al., 2000), which break down the oxalic acid required for the pathogenicity of Sclerotinia sclerotiorum.
Mendelian genetics experiments conducted with the melon–P. cubensis pathosystem revealed two complementary loci, Pc1 and Pc2, that control resistance (Thomas et al., 1987a; Kenigsbuch and Cohen, 1992). Molecular cloning of the resistance genes unexpectedly revealed that they do not belong to any class of known R genes (for review, see Dangl and Jones, 2001). Rather, they encode aminotransferase enzymatic activity and therefore are designated At1 and At2. We suggest calling such genes enzymatic resistance (eR) genes. At1 and At2 are constitutively, and highly, expressed in the resistant melon PI but not in susceptible melons. At1 and At2 are homologous. Each encodes a 401–amino acid (45-kD) protein. A dimer of this protein (∼90 kD) functions as an aminotransferase enzyme (Liepman and Olsen, 2001). P45 is the monomer of this enzyme that could be detected in protein extracts of PI on SDS-denatured gels (Balass et al., 1992). The results in the F2 population from the cross PI × Hemed indicate a strong linkage between the plant's response to the pathogen and its AGT enzyme activity. Resistant, moderately resistant, and susceptible individuals exhibited high, moderate, and low AGT activity, respectively. It seems likely, therefore, that At1 and At2 are Pc1 and Pc2.
The proof of the pivotal role of At1 or At2 in resistance against P. cubensis was obtained from transgenic melons. Transformed melon plants carrying either At1 or At2 expressed high activity of Ser or Ala glyoxylate aminotransferase and exhibited strong resistance to the pathogen. Although in PI and its derivatives, the complementary action of Pc1 and Pc2 is required for full protection against disease, in transgenic plants, a single insert of either gene driven by a strong promoter conferred resistance. Therefore, these genes may be used to produce new transgenic cultivars of resistant melon while saving the excessive labor required for recurrent crossing and selection.
Upon inoculation of PI with P. cubensis, a hypersensitive reaction is observed in the leaves, characterized as small chlorotic, water-soaked lesions embedded with callose and lignin deposits (Cohen et al., 1989). Transgenic melon plants carrying either At1 or At2 reacted similarly to infection with the pathogen. This finding suggests that At1 and At2 are responsible for defense gene activation (e.g., cell wall strengthening, callose deposition, and lignification), which culminates in cell death and the arrest of the pathogen.
The data presented here show that HR-associated resistance is not necessarily mediated by a classic R gene but rather by eR genes encoding a peroxisomal enzyme. It seems that of the three hierarchical operation levels of innate immunity—R-avr engagement, signaling molecule production, and defense gene activation—the PI melon confers resistance by operating only the last two steps. Evolutionarily, PI may represent a primary state of innate immunity independent of the R gene. Specific R genes may emerge in the future (Bergelson et al., 2001) when the eR genes At1 and At2 become inefficient. These R genes then should activate other basal defense mechanism(s).
During the course of photorespiration, two aminotransferases are responsible for the conversion of glyoxylate to Gly in the peroxisomes (Bourguignon et al., 1999): SGAT (EC 2.6.1.45), catalyzing Ser + glyoxylate → hydroxypyruvate + Gly; and GGAT (EC 2.6.1.4), catalyzing either glutamate + glyoxylate → α-ketoglutarate + Gly or Ala + glyoxylate → pyruvate + Gly. The Gly produced migrates to the mitochondria, where it is partially decomposed to CO2 and NH3 by Gly decarboxylase and partially converted to Ser by Ser hydroxymethyltransferase. Gly decarboxylase activity was shown to be inhibited by victorin, a host-selective toxin produced by the oat pathogen Cochliobolus victoriae (Navarre and Wolpert, 1995). The Ser moves to the peroxisome to serve as an amino group donor for SGAT, which produces Gly and hydroxypyruvate. The last molecule is converted to glycerate, which migrates to the chloroplast, rescuing the carbons that were lost in the early stage of the cycle.
Okinaka et al. (2002)showed that hydroxypyruvate reductase (HPR), a photorespiratory enzyme, interacts with the avrD plant receptor P34, which has syringolide binding activity. This binding induces HR in soybeans upon inoculation with the Pseudomonas syringae–derived syringolide. The HR was inhibited when syringolide was coapplied with glycerate or 3-phosphoglycerate, two products of HPR activity. The authors assumed that the binding activity of HPR to P34 disrupted HPR function. However, the direct role of HPR in HR remained unknown.
Glyoxylate in peroxisomes of photosynthetic plant tissues originates from glycolate oxidation during photorespiration (Somerville and Ogren, 1980; Bourguignon et al., 1999; Somerville, 2001). At1 and At2 encode an enzyme that catalyzes the transamination of glyoxylate into Gly using either Ala (AGT) or Ser (SGT) as the amino group donor. They occur in the peroxisome and require pyroxal-5-phosphate as a cofactor. Indeed, the sequences of At1 and At2 have both a pyrodoxyal-5-phosphate binding site and a peroxisomal targeting site. In the resistant PI and the resistant transgenic melon, this enzyme is severalfold more active than it is in susceptible melon.
Although it is clear that HR finally arrests the growth of the pathogen (Jackson and Taylor, 1996; Heath, 2000), the nature of the signaling molecules responsible for the earlier basal defense activation is debatable. H2O2 produced in the peroxisome during the oxidation of glycolate to glyoxylate may play a central role in this resistance. Reactive oxygen intermediates (ROI), including H2O2 and/or O2 −, are known to be produced in resistant plant–microbe interactions (Heath, 2000). The ROI may be involved in pathogen elimination, subsequent signaling of downstream effector function, or (most likely) both (Dangl and Jones, 2001). H2O2 also may contribute to the structural reinforcement of plant cell walls either by cross-linking various Hyp and Hyp-rich glycoproteins to the polysaccharide matrix or by increasing the rate of lignin polymer formation by peroxidase enzyme activity (Hammond-Kosack and Jones, 2000). It also may induce salicylic acid and glutathione S-transferase (Hammond-Kosack and Jones, 2000).
Indirect evidence for the involvement of H2O2 in our system was obtained from GO activity measurements. GO was severalfold more active in healthy leaves of PI, as well as in the resistant transgenic melon carrying At1 or At2, than in susceptible melons. Stoichiometrically, for each Ser molecule returning to the Calvin-Benson cycle (as phosphoglycerate), two molecules of H2O2 are produced (Bourguignon et al., 1999). We propose that the enhanced SGT and AGT activities, which use large amounts of glyoxylate, accelerate the activity of the upstream GO, which in turn produces a large quantity of H2O2. It appears that the plant's constitutive resistance is attributable to an increased level of peroxide.
The literature supplies ample evidence that ROI production often is induced during early stages of the plant resistance response (Jackson and Taylor, 1996; Heath, 2000). However, we know of no plant species (excluding transformed) in which the constitutive production of H2O2 is associated with resistance.
Wu et al. (1995)have shown that overexpression of glucose oxidase, which generates H2O2, confers partial resistance in potato against Phytophthora infestans (also an oomycete) and Erwinia carotovora. Charne et al. (1999)showed that transgenic plants overexpressing ROI-producing enzymes are resistant to disease. Bohman et al. (2002)observed enhanced production of GO in resistant chimeric Brassica napus × Arabidopsis thaliana at 48 h after inoculation with Leptosphaeria maculans. Noteworthy is that neither GO nor SGT/AGT, which may enhance it, was considered a candidate for ROI production (Charne et al., 1999; Stuiver and Custers, 2001).
Like mitochondria, which play an important role as a signal generator of HR-induced cell death by the generation of ROI (Lam et al., 2001), peroxisomes now are shown to serve this function. Recent evidence (Corpas et al., 2001) suggests that the signal molecule–generating capacity of peroxisomes can have important implications for cellular metabolism in plants, particularly under biotic and abiotic stress.
SGT/AGT and GO are key enzymes in photorespiration. They both act in the peroxisome. Photorespiration enables the plant to recruit CO2 molecules lost during photosynthesis as a result of the oxygenase activity of ribulose-1,5-bisphosphate carboxylase/oxygenase (Somerville and Ogren, 1980; Somerville, 2001). Based on the data presented here, we suggest that some peroxisomal photorespiratory enzymes also may provide protection against disease. Such enzymes may be expressed constitutively, as in melon, or induced by pathogen attack, as suggested recently for Arabidopsis (Scheideler et al., 2002).
This article provides a link between photorespiration and resistance to disease. Photorespiration, although a wasteful process, was shown to provide protection against stress caused by salinity, drought, and intense light (Wingler et al., 2000). The present study indicates that it also provides resistance against disease.
METHODS
Plant Material and Transformation
Our inbred melon (Cucumis melo) line PI 124111F (PI) (Cohen and Eyal, 1987) was used as a source for downy mildew resistance. The commercial lines Hemed and Ananas-Yokneam (AY) and our susceptible inbred line BU21/3 (with high competence for regeneration in culture) were used as susceptible controls and an acceptor, respectively. Plant transformation was performed as described by Galperin et al. (2003).
Pathogen Inoculation and Assessment of Disease Development
A local isolate of the oomycete pathogen Pseudoperonospora cubensis was used for inoculation. Propagation of the pathogen was performed as described elsewhere (Kenigsbuch and Cohen, 1989). Resistance of F2 plants to P. cubensis was examined in growth chambers as follows. Plants were raised in pots in the greenhouse and inoculated at the two-leaf stage by spraying sporangial suspension (5 × 10³ sporangia/mL) onto their upper leaf surfaces. Inoculated plants were kept in a dew chamber at 18°C in the dark for 20 h to ensure infection and thereafter at 21 ± 1°C (12 h of light per day) for symptom production. Resistance was assessed at 7 days after inoculation using the index described previously (Thomas et al., 1987a; Kenigsbuch and Cohen, 1992) for reaction type (RT). Briefly, the RT value was assessed visually in leaves 1 and 2, resulting in a double-digit score for each plant. RT values ranged from 11 to 44, with RT 11 indicating highly susceptible and RT 44 indicating highly resistant. Resistance in detached leaves of T0 plants was examined similarly except that leaves were placed inside plastic trays (20 × 20 × 2 cm) on moist filter paper. To assess the resistance of T1 plants under natural conditions, plants were raised in a shade house and then inoculated at the five-leaf stage by spraying sporangial suspension (1 × 10³ sporangia/mL) of the pathogen on their leaf surfaces. Disease development was recorded periodically until fruit harvest (at 4 months). A mean RT index was calculated for all leaves on a plant.
Microscopy
Fluorescence micrographs of lesions from infected leaves were taken under UV light as described previously (Cohen et al., 1989). Briefly, ethanol-clarified leaf discs were first stained with 0.05% aniline blue in 70 mM K2HPO4 buffer, pH 8.9, for 24 h and then with 0.01% calcofluor (Sigma) solution in water for 5 min. Sporangiophores and sporangia emerging from stomata fluoresced blue, whereas callose deposits in plant cells fluoresced yellow.
Cloning Procedure of At1 and At2 from PI
Purification of the P45 protein was performed as described by Balass et al. (1992). Microsequencing of the P45 protein was performed by proteolysis and sequencing in a gas-phase amino acid sequencer. Six peptide sequences (A to F) were obtained (Figure 1). cDNA from PI leaves was synthesized (First-Strand cDNA Synthesis Kit; Amersham Pharmacia Biotech) from RNA extracts (TriReagent; Molecular Research Center, Cincinnati, OH). Reverse transcriptase–mediated (RT) PCR was performed with two sets of degenerate oligonucleotides according to the peptide sequences obtained from P45. The first set included a downstream primer (5′-AACCACCTGTTCGTACCAGG-3′) designed from peptide F and an upstream primer (5′-GTCTCGTTGTGAACTATGCA-3′) designed from peptide B. The second set included a downstream primer (5′-ATGAACCGGAATAATGAAGA-3′) designed from peptide F and an upstream primer (5′-TTCACGGGGTAGCCTACGTC-3′) designed from peptide A (Figure 1). RT-PCR conditions were as follows: 94°C for 4 min; 10 cycles of 94°C for 45 s, 55°C for 45 s (reducing by 1°C per cycle), and 72°C for 60 s; 25 cycles of 94°C for 45 s, 45°C for 45 s, and 72°C for 60 s; followed by 5 min at 72°C.
DNA bands were extracted from the gels with the aid of the High Pure PCR Purification Kit (Boehringer, Mannheim, Germany), cloned into the pGEM-T Easy Vector System (Promega, Madison, WI), and transformed into competent Escherichia coli (DH5α). Full-length cDNAs was obtained using the 5′/3′ RACE (rapid amplification of cDNA ends) Kit (Boehringer). The RACE reaction was performed in two PCR steps, the first with the cDNA and the second with nested primers on the product of the first PCR as a template. For the 5′ end of the At1 cDNA, we used primer 5′-GAGAAAGAGCCTTTTGGGGACCCG-3′, and for the nested reaction, we used primer 5′-GACTCCCCATTCATCCATTCG-3′. For the 5′ end of the At2 cDNA, we used primer 5′-CGTTATGGACCATGCAAACTGCC-3′, and for the nested reaction, we used primer 5′-CATCAAGCTTAGCACCTTCACCCC-3′. For 3′ end of the At1 gene, we used primer 5′-CTGGTGTCACTAATGACCTGTC-3′, and for 3′ end of the At2 gene, we used primer 5′-GGATTGATCAGCAGCAGCGTCTC-3′. PCR was performed at 52 to 42°C for 10 cycles and at 42°C for 30 cycles. The two genes were subcloned into pGEM-T, cut with Bg1II and EcoRI, and cloned into the binary vectors pMON530 and pBIN288.
PCR and RT-PCR
All PCRs was performed using Taq polymerase (TaKaRa, Tokyo, Japan) in a T-Gradient Thermal Cycler (Biometra, Gettingen, UK). Plasmid templates were prepared using the QIAprep Spin Miniprep Kit (Qiagen, Hilden, Germany). Oligonucleotide primers were synthesized by Keystone-Biosource (Molecular Biology Center, Nes-Ziona, Israel). For RT-PCR, RNA was extracted from leaves. Tissue was homogenized in liquid nitrogen, and RNA was extracted using TriReagent from MRC. cDNAs were synthesized from RNA using the First-Strand cDNA Synthesis Kit (Amersham Pharmacia Biotech) using pd(N)6 random hexadecanucleotides.
PCR for At1 was performed with the forward primer 5′-GTCCCAGGGCCGGTCAACATTCC-3′ and the reverse primer 5′-CACTAGCTGCAGCAACTCCACTCCCTA-3′. PCR for At2 was performed with the forward primer 5′-TGTGCCGGGGCCGGTTAATAT-3′ and the reverse primer 5′-CCGAGAAGGAATGAGAGGGAT-3′. The PCR annealing conditions were 10 cycles from 67 to 58°C (reducing by 1°C per cycle) followed by 25 cycles at 57°C.
DNA Sequencing of At1 and At2 from PI and Homology Search
Templates were generated in at least three repeats by PCR or by restriction fragment cloning and primed with oligonucleotides annealing to either universal priming sites or gene-specific regions. Templates were prepared using the Qiagen QIAprep Spin Miniprep Kit and sequenced commercially by MBC. DNA sequencing was performed using the Basic Local Alignment Search Tool (BLAST) algorithm and the Genetics Computer Group (Madison, WI) version 10 suite of programs.
DNA Gel Blot Analysis
Total DNA was extracted from PI and transgenic melon leaves. Genomic DNA (12 μg) was digested with restriction enzymes. DNA fragments were separated by electrophoresis on a 1% agarose gel and transferred onto a Zeta-Probe membrane from Bio-Rad (Hercules, CA). The blot was hybridized with 32P-labeled At1 and At2 fragments (see below) in EZ-Hybridization Solution (Biological Industries, Beit-Haemek, Israel). For the final high-stringency wash, 0.1% SSC (1× SSC is 0.15 M NaCl and 0.015 M sodium citrate) and 0.1% SDS were used at 65°C. The blot was exposed to BioMax MS film (Kodak, Rochester, NY) at −80°C for 4 to 6 days.
At1 and At2 probes were obtained using the random prime labeling kit Prime-A Gene (Promega). A 480-bp DNA template for the At1 labeling reaction was obtained by PCR with the forward primer 5′-GCGACTGGGTCAGGGTGCCAATCTTG-3′ and the reverse primer 5′-TGCCGAGCAATCACATTGTCCAAACCTTCC-3′ on pMON530-At1 clone as a template. For At2, a 610-bp fragment was obtained using the forward primer 5′-AGTCGACGTGATTGAAAGTGAATGG-3′ and the reverse primer 5′-GGAGGAACAACAACAGCAGTCAC-3′ on pMON530-At2 clone as a template. The PCR annealing conditions were 10 cycles of 63 to 54°C (reducing by 1°C per cycle) followed by 25 cycles at 53°C.
RNA Gel Blot Analysis
Total RNA was extracted from plants using TriReagent (Sigma). Ten micrograms of total RNA was size-fractionated on a formaldehyde agarose gel and transferred to a Zeta-Probe membrane. The blot was hybridized with three random-primed 32P-labeled fragments: a 490-bp probe of At1 (position number 777 to 1267 in the coding region), a 380-bp probe of At2 (1027 to 1407), and a 466-bp probe of 18S RNA (981 to 1447) synthesized on RT-PCR product template with the downstream primer 5′-GTGTTGGCTTCGGGATCGG-3′ and the upstream primer 5′-CGCTCCACCAACTAAGAACGG-3′.
Cloning of At1 and At2 from Hemed and AY
The following procedure was used to clone At1 and At2 cDNAs from Hemed and AY. Total RNA was extracted from leaves of 3-week-old plants of the commercial susceptible cultivars Hemed and AY using TriReagent (Sigma). cDNAs of At1 and At2 from both cultivars were obtained by reverse transcription of the RNAs using the Reverse Transcription System (Promega) and amplifying the specific genes by PCR. Homolog primers to PI At1 and At2 were as follows: for At1, 5′-CCGCGGATGGATTACGTTTATGCA-3′ (forward) and 5′-CCCGGATCCTTAAATCCTTGAAGG-3 (reverse); for At2, 5′-GGATCCTCACGGTTTCGAACCGAT-3′ (reverse). The PCR products were cloned into pGEM-T Easy vector (Promega) and sequenced, each gene from two different PCR products.
Enzyme Assays
At1 and At2 Expression in E. coli
The expression of At1 and At2 from PI was tested in E. coli transformed with a binary vector (pMON530), whereas the expression of At1 and At2 from either PI or Hemed was tested in E. coli M15(pREP4) transformed with an expression vector (pQE-30UA). AGT and SGT activities were tested in E. coli DH5α transformed with the binary vector. For aminotransferase activity of recombinant Ser glyoxylate aminotransferase (SGT) and Ala glyoxylate aminotransferase (AGT) in bacterial lysates, E. coli DH5α was transformed with At1 or At2 open reading frames cloned into pMON530 under the control of the 35S promoter of Cauliflower mosaic virus. Control bacteria carried pMON530 vector only. The cells were grown overnight under spectinomycin selection to OD600 = 0.75. The pellet from 100 mL of bacterial culture was resuspended in 0.6 mL of lysis buffer containing 50 mM Tris-HCl, pH 8.5, 500 mM EDTA, pH 8, 10% glycerol, 0.1% β-mercaptoethanol, 10 mM NaCl, and 1 mM phenylmethylsulfonyl fluoride. Resuspended cells were broken by five freeze-thaw cycles in a liquid nitrogen room-temperature bath. Enzyme activity was measured spectrophotometrically (GENESYS 5 Spectronic; Milton Roy Company, Rochester, NY) at 340 nm as described (Rehfeld and Tolbert, 1972) using Ser (SGT) or Ala (AGT) as a substrate (see below). For aminotransferase activity of AGT in recombinant bacterial lysates, E. coli M15(pREP4) (Qiagen) was transformed with At1 or At2 open reading frames cloned into pQE-30UA expression vector (Qiagen). Control bacteria carried the vector only. Bacteria carrying At1 and At2 genes from the resistant (PI) and susceptible (Hemed) melon lines were grown overnight in 10 mL of Luria-Bertani medium with ampicillin and kanamycin selection. A volume of 2.5 mL of the cell culture was used to inoculate 50 mL of fresh Luria-Bertani medium with antibiotics. Cells were shaken until the density at 600 nm reached 0.5 OD. Then, 1 mM isopropylthio-β-galactoside was added to induce protein expression at 37°C. Four hours after induction, cells were harvested by centrifugation at 4000g at 4°C for 10 min.
To test enzyme activity, cells were resuspended in BugBuster extraction reagent (Novagen, Schwalbach, Germany) and treated according to the manufacturer's protocol. Insoluble cell debris were removed by centrifugation at 16,000g for 20 min at 4°C. Five hundred micrograms from the soluble fraction was used for enzyme activity. Enzyme activity was measured spectrophotometrically (GENESYS 5 Spectronic) at 340 nm as described (Rehfeld and Tolbert, 1972) using Ala (AGT) as a substrate (see below).
At1 and At2 Expression in Plants
Homogenates from 0.5 g of leaf tissue in 70 mM Hepes, pH 7.0, were prepared at 4°C, and 0.2 mg of total protein in 10 μL was taken for each assay. AGT activity was measured at 340 nm by coupling the reduction of glyoxylate to the oxidation of NADH in the presence of excessive lactate dehydrogenase. The reaction mixture contained 10 μL of homogenate, 20 mM Ala, 70 mM Hepes, pH 7, 0.17 mM NADH, 0.1 mM pyridoxal-5-phosphate, 0.03 units/mL lactate dehydrogenase, and 1 mM glyoxylate in a final volume of 1 mL.
SGT activity was measured at 340 nm by coupling the reduction of glyoxylate to the oxidation of NADH in the presence of excessive hydroxypyruvate reductase. The reaction mixture was as described above except that Ala was replaced by 20 mM Ser and lactate dehydrogenase was replaced by 0.05 unit/mL hydroxypyruvate reductase. The reaction was started by adding the amino acid. Water was added instead of an amino acid to the reference cuvette. Protein concentration was determined using Bradford reagent (Bio-Rad). Specific enzymatic activity for each aminotransferase reaction is expressed in micromoles per minute per milligram and was calculated using the extinction coefficient for NADH of 6.2 cm−1 mM−1.
Glycolate Oxidase Activity
Glycolate oxidase (GO) activity was measured according to Macheroux et al. (1991)by an enzyme-coupled assay using horseradish peroxidase and o-dianisidine, which uses the H2O2 generated by GO during the oxidation of glycolate. A typical assay mixture contained 10 μL of horseradish peroxidase (1 mg/mL), 50 μL of o-dianisidine solution (8 mM, 20% Triton X-100), 10 μL of sodium glycolate (1 M), and 930 μL of 0.1 M potassium phosphate buffer, pH 8.3. The reaction was started by adding 10 μL of leaf homogenate. Formation of the o-dianisidine radical cation, which reflects the catalytic activity of GO, was measured spectrophotometrically at 440 nm and 25°C.
Upon request, materials integral to the findings presented in this publication will be made available in a timely manner to all investigators on similar terms for noncommercial research purposes. To obtain materials, please contact Y. Cohen, coheny@mail.biu.ac.il.
Accession Numbers
The GenBank accession numbers for At1 and At2 from PI are AY066012 and AF461048, respectively. Other accession numbers are as follows: AF039000 (SGT from Fritilaria agrestis), AF063901 (AGT1 from Arabidopsis), AY354208 and AY354209 (At1 and At2 from the susceptible cultivar Hemed), and AY354206 and AY354207 (At1 and At2 from the susceptible cultivar AY).
ACKNOWLEDGMENTS
The technical assistance of D. Levy and D. Gotlieb is gratefully acknowledged.
REFERENCES
Balass, M., Cohen, Y., and Bar-Joseph, M. (
Balass, M., Cohen, Y., and Bar-Joseph, M. (
Bergelson, J., Kreitman, M., Stahl, E.A., and Tian, D.C. (
Bohman, S., Wang, M., and Dixelius, C. (
Bourguignon, J., Rebeille, F., and Douce, R. (1999). Serine and glycine metabolism in higher plants. In Plant Amino Acids: Biochemistry and Biotechnology, B.K. Singh, ed (New York: Marcel Dekker), pp. 111–146.
Cao, H., Li, X., and Dong, X.N. (
Cessna, S.G., Sears, V.E., Dickman, M.B., and Low, P.S. (
Charne, D.G., et al. (1999). Production of pathogen resistant plants. Patent Application WO9904012 (Pioneer Hi-Bred International).
Cohen, Y., and Eyal, H. (
Cohen, Y., Eyal, H., Hanania, J., and Malik, Z. (
Cohen, Y., Meron, I., Mor, N., and Zuriel, S. (
Corpas, F.J., Barroso, J.B., and del Rio, L.A. (
Dangl, J.L., and Jones, J.D. (
Galperin, M., Patlis, L., Ovadia, A., Wolf, D., Zelcer, A., and Kenigsbuch, D. (
Hammond-Kosack, K.E., and Jones, J.D. (2000). Response to plant pathogens. In Biochemistry and Molecular Biology of Plants, B.B. Buchanan, W. Gruissem, and R.L. Jones, eds (Rockville, MD: American Society of Plant Physiologists), pp. 1102–1156.
Jackson, A.O., and Taylor, C.B. (
Johal, G.S., and Briggs, S.P. (
Kang, L., Li, J., Zhao, T., Xiao, F., Tang, X., Thilmony, R., He, S., and Zhou, J.M. (
Kenigsbuch, D., and Cohen, Y. (
Kenigsbuch, D., and Cohen, Y. (
Kesarwani, M., Azam, M., Natarajan, K., Mehta, A., and Datta, A. (
Lam, E., Kato, N., and Lawton, M. (
Liepman, A.H., and Olsen, L.J. (
Liepman, A.H., and Olsen, L.J. (
Macheroux, P., Massey, V., Thiele, D.J., and Volokita, M. (
Martin, G.B., Brommonschenkel, S.H., Chunwongse, J., Frary, A., Ganal, M.W., Spivey, R., Wu, T., Earle, E.D., and Tanksley, S.D. (
Navarre, D.A., and Wolpert, T.J. (
Okinaka, Y., Yang, C.-H., Herman, E., Kinney, A., and Keen, N.T. (
Rehfeld, D.W., and Tolbert, N.E. (
Scheideler, M., Schlaich, N.L., Fellenberg, K., Beissbarth, T., Hauser, N.C., Vingron, M., Slusarenko, A.J., and Hoheisel, J.D. (
Somerville, C.R. (
Somerville, C.R., and Ogren, W.L. (
Song, J., Bradeen, J.M., Naess, S.K., Raasch, J.A., Wielgus, S.M., Haberlach, G.T., Liu, J., Kuang, H., Austin-Phillips, S., Buell, C.R., Helgeson, J.P., and Jiang, J. (
Stuiver, M.H., and Custers, J.H. (
Thomas, C.E., Cohen, Y., McCreight, Y.D., Jourdion, E.L., and Cohen, S. (
Thomas, C.E., Inaba, T., and Cohen, Y. (
Wingler, A., Lea, P.J., Quick, W.P., and Leegood, R.C. (
Author notes
To whom correspondence should be addressed. E-mail davke@agri.gov.il; fax 972-3-9683622
Current address: Department of Postharvest Science, Volcani Center, P.O. Box 6, Beit Dagan, Israel.
Article, publication date, and citation information can be found at www.plantcell.org/cgi/doi/10.1105/tpc.016352.
