


Abstract
Live and dead copepod abundances and environmental conditions were measured during summer in Chesapeake Bay to determine how population size, vertical position and non-predatory mortality varied with hypoxia. Abundances of copepod nauplii and Acartia tonsa copepodites decreased when low-oxygen water was present. Possible explanations include copepods altering their vertical position to avoid hypoxia, resulting in increased predation and advection losses. Alternatively, copepods residing in hypoxic water may experience increased mortality and sub-lethal effects of hypoxia on growth and reproduction. The vertical position of copepod nauplii did not appear to respond to hypoxia, but the vertical position of A. tonsa copepodites shifted upward in response to lethal hypoxia in bottom water. Non-predatory mortality of nauplii increased with the severity of hypoxia, but no similar increase was apparent for copepodites. Overall, it appears that hypoxia in Chesapeake Bay can result in lower copepod population abundances. Under moderate hypoxia, sub-lethal effects of low oxygen on growth and reproduction likely contribute to lower abundances, since the copepods do not avoid the hypoxic water. Under severe hypoxia, non-predatory mortality due to low oxygen is likely more important for naupliar stages, and the effects of altered vertical position on predation and advection may be important for copepodites.
INTRODUCTION
The prevalence and intensity of hypoxia has increased in coastal waters over the last several decades, a trend that has largely been linked to cultural eutrophication (Nixon, 1995; Diaz and Rosenberg, 2008). In the Chesapeake Bay, hypoxia occurs mainly in the deep central channel during summer (Hagy et al., 2004; Kemp et al., 2005). This hypoxia was a naturally occurring phenomenon; however, the volume of hypoxic water in Chesapeake Bay has increased from 3.4 × 10⁹ m3 to 9.2 × 10⁹ m3 between 1950 and 2001 (Hagy et al., 2004). In coastal systems, bottom water habitats are usually the first to become hypoxic with eutrophication, and some of the most noticeable consequences of coastal hypoxia occur for benthic and demersal taxa (Diaz and Rosenberg, 1995, 2008). In shallow pelagic regions, organisms capable of determining their vertical position, such as planktonic copepods, may avoid bottom hypoxia by migrating upward in the water column, whereas other taxa may reside within hypoxic waters (Ekau et al., 2010; Keister and Tuttle, 2013). Overall, the influence of bottom water hypoxia on copepods and other zooplankton will likely depend on the fraction of the water column that is hypoxic (Pierson et al., 2009).
In Chesapeake Bay, several studies have documented low abundances of copepods and other zooplankton in hypoxic areas (Roman et al., 1993; Keister et al., 2000; Kimmel and Roman, 2004). The habitat compression hypothesis suggests that zooplankton respond to and avoid hypoxia by residing higher in the water column (Kimmel et al., 2009; Roman et al., 2012). This type of response could affect abundances by compressing zooplankton more into the surface layer, resulting in increased predation mortality or altered migration/advection due to prevailing circulation patterns. Alternatively, the refuge hypothesis proposes that zooplankton utilize hypoxic water as a refuge from predators (Auel and Verheye, 2007; Taylor et al., 2007; Ludsin et al., 2009). Inhabiting and being exposed to hypoxic water could affect abundances by reducing population growth through, e.g. lower somatic growth or reproductive output (Elliott et al., 2013), or by directly or indirectly altering mortality rates (Roman et al., 1993; Decker et al., 2004).
This study measured environmental conditions and copepod abundances at discrete depths in Chesapeake Bay, using vital staining to distinguish between live and dead copepods in samples. The results were used to examine how copepod population abundance, vertical position and non-predatory mortality responded to hypoxia, particularly as relates to the habitat compression and refuge hypotheses described earlier. To this end, we considered four specific questions: (i) Does hypoxia appear to affect overall copepod population abundance? (ii) Do live and dead copepods exhibit different vertical positioning? (iii) Does the vertical position of live copepods change in response to hypoxia? (iv) Does exposure to hypoxia result in an increase in copepod non-predatory mortality?
METHOD
Samples were collected on five cruises in Chesapeake Bay, USA, during the hypoxic season of 2010 (August 19–25; September 21–27) and 2011 (May 25–31; July 19–25; September 22–28). On each cruise the ship was anchored for >24 h at a North station (38.52°N, 76.41°W), which was 17.3 m (±0.7 m SD) total depth and where summer hypoxia is typically severe, and for >24 h at a South station (37.73°N, 76.20°W), which was 20.5 m (±0.7 m SD) total depth and outside the region of severe hypoxia (Fig. 1). On each cruise, live and dead copepod abundances and environmental conditions (temperature, salinity, dissolved oxygen) were determined from CTD casts three times at each anchor station. Environmental data were collected with a Seabird 911 plus CTD, and were binned at 0.5 m depth intervals. The oxycline was defined in each CTD cast as the depth at which the rate of change in oxygen concentration was greatest over a 0.5 m interval. Copepods were collected using 10-L Niskin bottles at three discrete depths (2–5 m depth in surface mixed layer, at the base of oxycline and near bottom), collecting 30-L of water at each depth. Previous studies have shown that Niskin bottles collect representative samples of zooplankton such as Acartia tonsa when compared with net collected samples (Houde and Alpern-Lovdal, 1985). Collected copepods were gently siphoned into submerged 64 μm mesh sieves, maintaining flow at <2 L min−1 and preventing bubbling or splashing of water. Concentrated zooplankton samples were then stained with neutral red and frozen at −20°C for later sorting under microscopy, following the protocol of Elliott and Tang (Elliott and Tang, 2009). For sorting, sub-samples were taken with a Stempel Pipette when necessary to obtain a manageable number of animals for enumeration. For each sample at least 100 copepod nauplii and 100 A. tonsa copepodites or else the entire sample was enumerated.
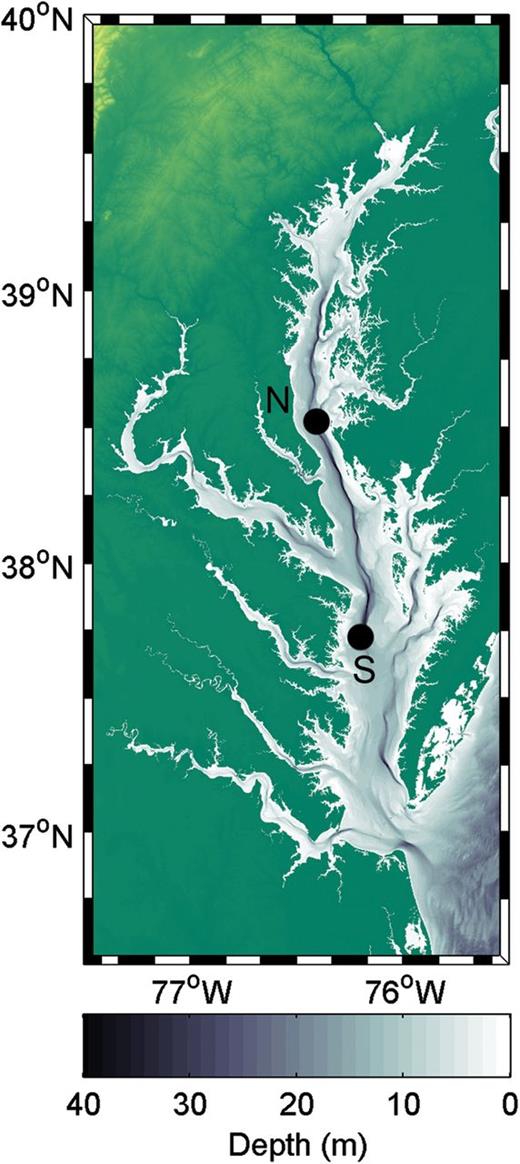
Map of Chesapeake Bay indicating the locations of the North (N) and South (S) sampling stations for this study.
Rather than using the traditional concentration of 2 mg L−1 dissolved oxygen, hypoxia was defined by the oxygen thresholds below which A. tonsa would experience sub-lethal and lethal effects. These thresholds, the critical (Pcrit) and lethal (Pleth) oxygen partial pressures for A. tonsa, were calculated based on the temperature, salinity and dissolved oxygen partial pressure of the water sampled, and using the model described in Elliott et al. (Elliott et al., 2013) for relating A. tonsa respiration rate to environmental oxygen. The vertical position of copepods was described based on abundances at the three depths sampled, calculating the fraction of copepods collected occurring in each near-bottom sample relative to the two samples higher in the water column. Thus, values >0.33 indicate accumulation of copepods in the bottom layer, and values <0.33 indicate copepod position skewed away from the bottom. To describe the effects of hypoxia on mortality, values of average percent dead copepods throughout the water column were used to indicate the relative non-predatory mortality of nauplii or copepodites among different samples. This approach is applicable as long as carcass turnover times due to decomposition, sinking and other removal processes are similar among samples (Tang et al., 2006; Tang and Elliott, accepted). As used in the present study, this corresponds to the reasonable assumption that carcass turnover time did not vary extensively and systematically with oxygen concentration. Severity of hypoxia was defined as the fraction of the sub-oxycline layer with lethal hypoxia. Except in the case of ordinary least square regressions (LSRs), abundances were log (n + 1) transformed and proportions were arc-sine transformed before statistical analyses. Statistical tests were done to describe relationships of abundance, vertical position and percent dead copepods with the potential explanatory variables oxygen (concentration, severity or sub-lethal and lethal classifications), station (North or South) and time of day (day or night).
RESULTS
Environmental conditions
Water column density stratification was evident from temperature and salinity profiles during all cruises and at both stations except for during September 2010 (Fig. 2), when stratification was weak, if present at all. Generally, the oxycline depth coincided with that of the halo- and/or thermocline (Fig. 2). On a given cruise, dissolved oxygen was typically much lower in bottom waters at the North station than at the South station, although dissolved oxygen was also extremely low in bottom waters at the South station in July of 2011. At the North station, severe hypoxia or even anoxia occurred throughout the bottom 25–33% of the water column.
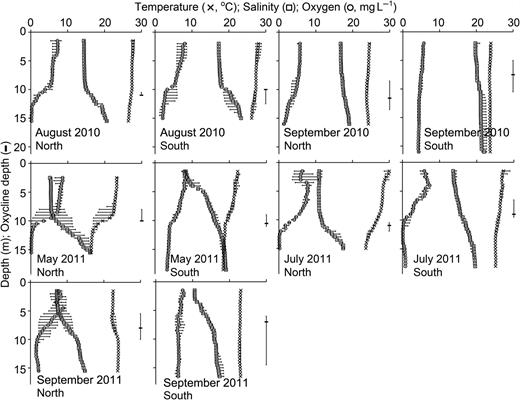
Temperature (°C), salinity, dissolved oxygen (mg L−1) and oxycline depth (m) (along the right-hand side of each plot, and on x-axes) from each of the three CTD casts taken at each anchor station (North and South) for 2010 cruises on August 19–25 (August 2010) and September 21–27 (September 2010), and 2011 cruises on May 25–31 (May 2011), July 19–25 (July 2011) and September 22–28 (September 2011). Symbols represent median values from the three CTD measurements at each depth, and error bars indicate maximum and minimum values.
Does hypoxia appear to affect overall copepod population abundance?
The abundance of both copepod nauplii and A. tonsa copepodites decreased at lower oxygen conditions (Fig. 3). Abundance of nauplii decreased significantly with decreasing sub-oxycline dissolved oxygen (LSR: P = 0.001). Naupliar abundance was not significantly different between stations or between day and night [analysis of variance (ANOVA): for station P = 0.243, for day/night P = 0.280], although based on the data available, abundance during day was lower than at night for higher oxygen conditions (>3 mg L−1 sub-oxycline; Fig. 3). Abundance of A. tonsa copepodites also decreased significantly with decreasing sub-oxycline dissolved oxygen (LSR: P < 0.0001), but was not significantly different between stations or between day and night [analysis of co-variance (ANCOVA: for station P = 0.977, for day/night P = 0.148)].
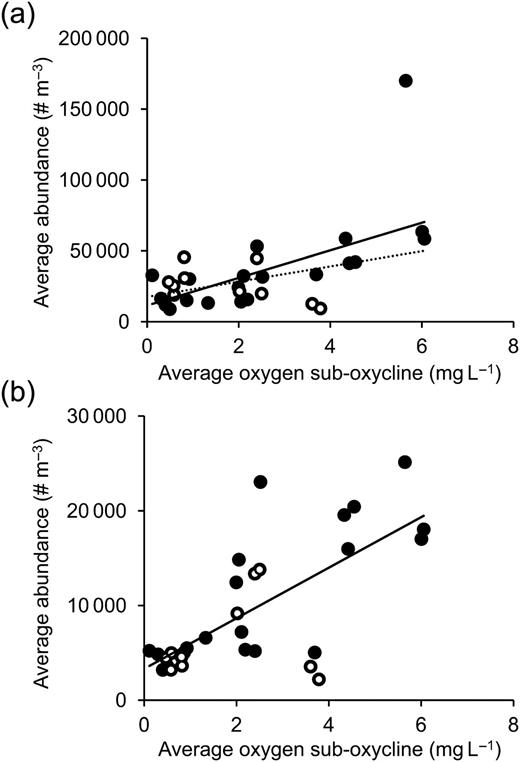
Relationship between depth-averaged sub-oxycline oxygen concentration and water column-averaged abundances of (a) copepod nauplii and (b) Acartia tonsa copepodites. Open points indicate samples taken during daylight, and filled points samples at night. Solid lines are prediction lines from LSR, and the dotted line in (a) shows LSR result after removal of the abundance value >150 000 individuals m−3 as a potential outlier. Results of LSR for nauplii (a): y = 9723x + 11444, R2 = 0.336, P = 0.001; for nauplii (a) after removal of the potential outlier: y = 5370x + 17520, R2 = 0.335, P = 0.001; for copepodites (b): y = 2670x + 3316, R2 = 0.494, P < 0.0001.
Do live and dead copepods exhibit different vertical positions?
The vertical position of dead copepods was skewed more toward the bottom than that of live copepods (Fig. 4), with the fraction of individuals collected occurring in the bottom layer samples being significantly higher for carcasses than for live copepods (paired t-tests: for nauplii P = 0.004, for copepodites P = 0.001). In addition, the vertical position of larger, more rapidly sinking copepodite carcasses was skewed more toward the bottom layer than that of smaller naupliar carcasses (Fig. 4), with the fraction of individuals occurring in the bottom layer significantly higher for dead copepodites than for dead nauplii (paired t-test: P = 0.037).
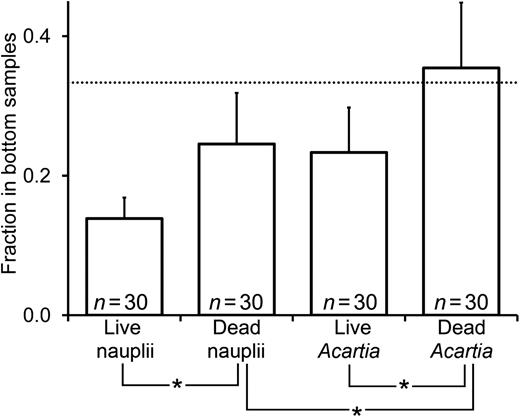
Vertical position of live and dead copepod nauplii and A. tonsa copepodites; vertical position is indicated as the fraction of the total collected copepods occurring in samples from the bottom layer of the water column. Dashed horizontal lines indicate the one-third mark, where the fraction of copepods in the bottom layer is equal to the average fraction in the two upper layers (surface and base of oxycline). Numbers of measurement included in each calculated mean are also shown (n). Bars connected by asterisks were significantly different from one another (according to paired t-tests described in the text). Error bars are +95% confidence intervals.
Does the vertical position of live copepods change in response to hypoxia?
The vertical position of live copepod nauplii did not show a clear response to dissolved oxygen (Fig. 5a), and the fraction of individuals occurring in the bottom layer was not significantly different among oxygen levels, between stations, or between day and night (ANOVA: for oxygen P = 0.204, for station P = 0.529, for day/night P = 0.669). Live A. tonsa copepodites, on the other hand, appeared to shift their position away from the bottom layer when lethal hypoxia was present (Fig. 5b). The fraction of live copepodites occurring in the bottom layer was not significantly different between stations or between day and night, but was different among oxygen levels (ANOVA: for oxygen P = 0.009, for station P = 0.408, for day/night P = 0.672), and was significantly lower when bottom oxygen was lethal than when sub-lethal or normoxic (Tukey posthoc pairwise comparisons: P = 0.0024 and P = 0.0159, respectively).
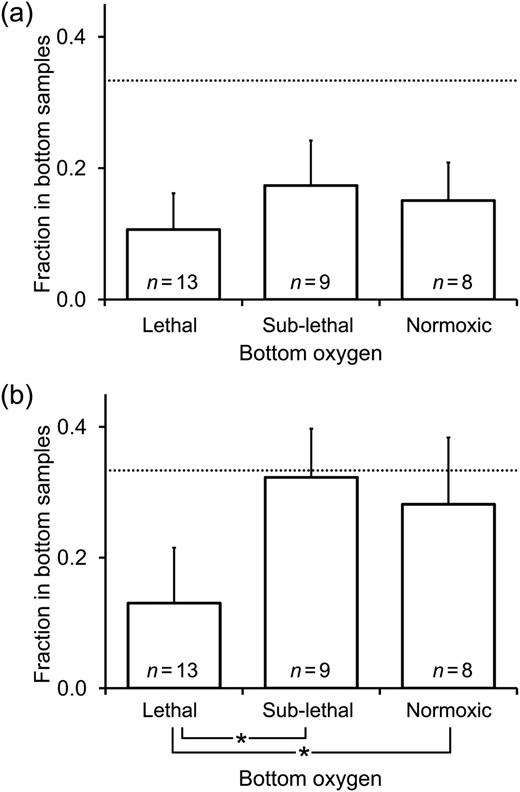
Vertical position of live (a) copepod nauplii and (b) A. tonsa copepodites under different bottom layer oxygen conditions; vertical position is indicated as the fraction of the total collected live copepods occurring in samples from the bottom layer. Dashed horizontal lines indicate the one-third mark, where the fraction of copepods in the bottom layer is equal to the average fraction in the two upper layers (surface and base of oxycline). Numbers of measurement included in each calculated mean are also shown (n). Bars connected by asterisks were significantly different from one another (according to Tukey posthoc comparisons described in the text). Error bars are +95% confidence intervals.
Does exposure to hypoxia result in an increase in copepod non-predatory mortality?
Based on the percent of copepods that were dead according to neutral red staining, hypoxia may have directly caused mortality of nauplii in the field (Fig. 6a), but did not appear to cause substantial mortality of copepodites (Fig. 6b). The percent dead copepod nauplii increased significantly as hypoxia became more severe (LSR: P = 0.003); with severity of hypoxia indicated by the percent of the sub-oxycline layer containing lethal hypoxia, as predicted from Pleth for A. tonsa. The percentage of dead nauplii was not significantly different between stations or between day and night (ANCOVA: for station P = 0.992, for day/night P = 0.161). The percentage of dead A. tonsa copepodites was not significantly related to severity of hypoxia (LSR: P = 0.885), nor was it significantly different between stations or between day and night (ANOVA: for station P = 0.669, day/night P = 0.235).
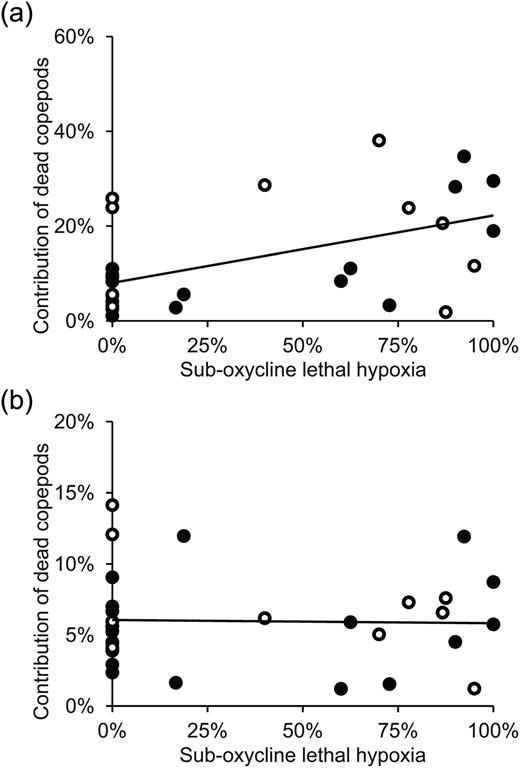
Relationship between severity of hypoxia (percent of sub-oxycline layer with lethal hypoxia) and percent dead (a) copepod nauplii and (b) Acartia tonsa copepodites throughout the water column. Percent dead is indicative of relative non-predatory mortality rates. Open points indicate samples taken during daylight, and filled points samples at night. Results of LSR for nauplii (a): y = 0.142x + 0.0802, R2 = 0.276, P = 0.003; for copepodites (b): y = 0.0605–0.0023x, R2 = 0.001, P = 0.885.
DISCUSSION
This study provides additional evidence that low oxygen can have negative effects on the abundance of planktonic copepods in hypoxic areas of Chesapeake Bay (Fig. 3). Such decreased abundance could result from copepod avoidance of, and/or exposure to, low-oxygen water. Avoidance, as a shift in copepod vertical position away from the bottom layer (habitat compression hypothesis), could result in increased predation mortality in the surface layer and increased losses due to advection. Alternatively, residing in and being exposed to low-oxygen water (refuge hypothesis) could result in increased mortality and sub-lethal effects on population growth. Considering the possibility of avoidance, the vertical position of live copepodites was significantly shifted away from the bottom layer at lethal oxygen levels (Fig. 5b); this vertical shift did not appear to result from higher non-predatory mortality in the bottom layer, since the percent dead copepodites was unrelated to hypoxia (Fig. 6b). It could instead be a result of active avoidance of the hypoxic bottom layer or increased predatory mortality within this hypoxic layer. Experiments have demonstrated that ctenophores can have higher predation rates on copepods under low-oxygen conditions, possibly because of impaired copepod escape responses as a sub-lethal effect of low oxygen (Decker et al., 2004). From the present data, it is not possible to fully resolve the effects of higher predatory mortality within the hypoxic layer from those of active avoidance of this layer. However, the vertical position of copepodites was not shifted away from the bottom layer under sub-lethal hypoxia (Fig. 5b), suggesting that active avoidance of lethal hypoxia may have caused the observed shift. This is consistent with the apparent ability of Chesapeake Bay A. tonsa to avoid hypoxic water in laboratory experiments (Decker et al., 2003). The observation that copepodites were abundant in the bottom layer with sub-lethal hypoxia (Fig. 5b) also suggests the possibility of a trade-off, with some gain in fitness (e.g. lower predatory mortality) that offsets any sub-lethal consequences of residing in hypoxic water (e.g. lower somatic growth and egg production). Such trade-offs resulting in increased fitness should exist for copepods to either avoid hypoxia or use hypoxic waters as a refuge; otherwise these behaviors would not evolve and persist in the population (Dam, 2013).
The vertical position of dead compared with live copepods was consistent with the results of Elliott et al. (Elliott et al., 2010), who concluded that carcasses of nauplii tended to be distributed more evenly through the water column due to their small size, slow sinking and high potential for turbulent resuspension. Acartia tonsa copepodite carcasses, on the other hand, tended to sink more rapidly and accumulate deeper in the water column. Percent dead determined from neutral red staining also suggested that hypoxia directly caused mortality of nauplii in the field, but caused no substantial mortality of copepodites (Fig. 6). Acartia tonsa eggs are typically released in the surface layer at night (White and Roman, 1992), but can sink ∼20 m day−1 (Uye, 1980). At surface water temperatures of ≤26°C during most of our samplings, egg hatching times would be ≥0.7 day (Mauchline, 1998), and eggs could sink 14 m or more before hatching. Furthermore, hatching times would increase for eggs sinking into colder deep waters. Thus, it is likely that many A. tonsa nauplii hatch in the bottom layer of a ∼20 m deep Chesapeake Bay water column. These freshly hatched nauplii would then be forced to swim upward to escape the bottom layer, and any hypoxia present therein. Nauplii hatching in hypoxic bottom water would not necessarily die immediately, as A. tonsa nauplii can survive low oxygen concentrations (≤0.7 mg L−1) for at least 24-h (Stalder and Marcus, 1997). However, at swimming speeds as slow as 0.2 mm s−1 (0.72 m h−1, Mauchline, 1998), it would take ∼9 h for a newly hatched nauplius to traverse the bottom third of a ∼20 m deep Chesapeake Bay water column if it swam straight upward. Since it was not uncommon for one-third of the water column to be hypoxic during this study (Fig. 2), and further since the oxygen demand of a constantly swimming nauplius would be higher than the minimum demands for survival in the laboratory, it is likely that some nauplii would be unable to escape a lethally hypoxic bottom layer and would die. This may explain the trend of increasing dead nauplii from ∼8 to ∼22% with increasing severity of hypoxia (Fig. 6a). At an estimated turnover time of 26 h for a dead nauplius in summer (Elliott et al., 2010), this corresponds to an increase in non-predatory mortality rate from an estimated 0.07 to 0.20 day−1 under steady-state conditions. These estimates assume that sinking losses of dead nauplii are negligible, based on previous observations that they sank slowly and were abundant throughout the water column, suggesting retention in the water due to upward turbulent diffusion (Elliott et al., 2010). However, if sinking losses of naupliar carcasses were important at the time and location of our sampling, then the non-predatory mortality rates estimated above would be underestimates.
Overall, the results of this study provide further support for the idea that hypoxia in Chesapeake Bay can result in lower copepod population abundances, and help one to resolve the mechanisms for this decrease in abundance. Under moderate (sub-lethal) hypoxia, the vertical position of copepods did not appear to change. Copepods residing in hypoxic water will likely experience sub-lethal effects, including lower growth and reproduction, ultimately resulting in slower population growth. Under severe (lethal) hypoxia, the vertical position of copepodites shifted upward, suggesting active avoidance of lethal hypoxia. In such cases, the potential effects of altered vertical position on predation mortality and advective losses would become more important. Hypoxia-induced non-predatory mortality appeared to be important for copepod nauplii, which may hatch into hypoxic conditions and be less able than copepodites to actively avoid hypoxia due to weaker swimming. Increased mortality as a direct result of hypoxia may also be particularly important for copepod eggs that cannot actively avoid hypoxia (Roman et al., 1993). Lower copepod abundance in hypoxic areas likely represents the cumulative result of these multiple responses to low oxygen.
FUNDING
This work was supported by National Science Foundation Award OCE-0961942 to J.J.P. and M.R.R.
Acknowledgements
We thank the captain and crew of the R/V Hugh R. Sharp for technical assistance. This is UMCES contribution #4759.
References
Author notes
Present Address: Virginia Commonwealth University, Center for Environmental Studies, Richmond, VA, USA.
Corresponding editor: Roger Harris
