


Abstract
Measurements of dihedral angles at three-grain junctions in gabbros, involving two grains of plagioclase and one grain of another mineral, demonstrate that the median dihedral angle is generally the same for all minerals in any sample. The few exceptions to this can be attributed to reaction or to the cessation of growth of plagioclase during the last stages of solidification of highly evolved liquids that do not crystallize volumetrically important amounts of plagioclase. The dihedral angle is therefore primarily controlled by the growth behavior of plagioclase in the last remaining liquid. The final value of the dihedral angle is controlled by the extent to which plagioclase growth is accommodated on the (010) faces: low angles form when growth on the (010) faces is minor compared with that on the other growth faces, and high angles form when the (010) faces accommodate significant growth. The response of dihedral angles to changes in crystallization time is therefore explained by the changing response of plagioclase growth to cooling rate, with limited growth on (010) faces during rapid cooling (leading to a low dihedral angle) and more significant growth at slow cooling (leading to high dihedral angle). The correspondence between dihedral angle and plagioclase grain shape (as quantified by the average apparent aspect ratio observed in thin section) is clearly evident for non-fractionated bodies such as dolerite sills. Although the stratigraphic variation of the overall plagioclase grain shape in the floor cumulates of the Skaergaard Intrusion is broadly similar to that observed in sills, there is no correspondence to observed augite–plagioclase–plagioclase dihedral angles, which show a step-wise stratigraphic variation, corresponding to changes in the liquidus assemblage. This decoupling occurs because plagioclase growth in layered intrusions occurs in two stages, the first at, or close to, the magma–mush interface and the second within the mush. Chemical maps of samples on either side of the augite-in dihedral angle step demonstrate a step-wise change in the aspect ratio of the plagioclase grown during the second stage, with the aspect ratio of this stage corresponding to that predicted from the dihedral angles. Plagioclase shape in layered intrusions thus records two separate thermal regimes, with the overall shape controlled by the global cooling rate of the intrusion, and the second (minor) stage within the mushy layer reflecting local thermal buffering controlled by the liquidus assemblage of the bulk magma. Dihedral angles in layered intrusions record the second thermal regime.
INTRODUCTION
Recent work has expanded the potential of microstructure to provide quantitative constraints on the cooling and crystallization history of basaltic intrusions by the addition of two new parameters to the more usually deployed crystal size distribution. One of these new microstructural parameters is the geometry of three-grain junctions involving one grain of clinopyroxene (augite) and two of plagioclase, as quantified by the median value of the clinopyroxene–plagioclase–plagioclase dihedral angle, Θ cpp (e.g. Holness et al. , 2012 a , 2012,b ). The other is the shape of plagioclase crystals, specifically the average apparent aspect ratio as measured in thin section ( Holness, 2014 ).
Although we do not yet know precisely how it is achieved, and do not yet have quantitative experimental data, the changing shape of plagioclase with cooling rate or extent of supercooling [previously reported by Cashman (1992) ] is familiar to any petrologist. It is clearly illustrated by comparison of the blocky shape of plagioclase phenocrysts in basaltic volcanic rocks with the generally more platy grains in the groundmass. The changing shape of plagioclase can be simply understood in terms of differences in the response of the different faces to changes in growth conditions (e.g. Cashman, 1992 ; Hammer et al. , 1999 ; Higgins, 2006 ). In contrast, the mechanism controlling the response of three-grain junction geometry to changing cooling rate, resulting in the observed systematic variation of dihedral angles within and between mafic intrusions, is not known. There is only scarce published work in either the materials science or geological sciences literature addressing the mechanisms and processes of grain junction formation, and no theoretical framework upon which to build. So far, all progress in understanding this phenomenon has been made by careful and exhaustive observation of natural examples of three-grain junction formation in mafic rocks (e.g. Holness et al. , 2012 a ). In this contribution I present a further series of detailed observations, leading to the hypothesis that the fundamental underlying control on the geometry of three-grain junctions, and hence on Θ cpp , is the change in relative rates of growth of the different faces of plagioclase in response to changes in cooling rate.
PREVIOUS WORK
Variation in the median dihedral angle, Θ cpp
The observed values of Θ cpp range between 78° and a maximum of 105° in basaltic crustal intrusions. These are lower than the value of 109° observed for fully equiIibrated microstructures ( Holness, 2010 ; Holness et al. , 2012 a ), pointing to the generally disequilibrium nature of microstructures in gabbros and dolerites. The geometry of three-grain junctions in the great majority of studied gabbros and dolerites is essentially unmodified from the initial geometry created during solidification (the ‘igneous process’ of dihedral angle formation; Holness et al. , 2012 a ).
Θ cpp varies symmetrically in essentially non-fractionated dolerite sills, with the highest values in the centre ( Holness et al. , 2012 b ) ( Fig. 1 ). The dihedral angle maps directly onto the time taken to crystallize at any point within the sill, providing a robust and sensitive speedometer for timescales of 10–1000 years ( Holness et al. , 2012 b ). In the most rapidly cooled dolerites, three-grain junctions are characterized by planar augite–plagioclase grain boundaries ( Fig. 2 a and b). The almost perfect pseudomorphing by augite of the original melt-filled space attests to the rapid growth of augite relative to that of the (010) growth faces of the plagioclase that generally bound the melt-filled pore. The narrower junctions, with the lowest impingement angles between the two plagioclase grains, are commonly filled with glass or very fine-grained intergrowths crystallized from late-stage liquid ( Fig. 2 a and b). Because the narrowest junctions are not filled with augite, the median value of Θ cpp in rapidly cooled rocks is higher (∼78°) than the value of 60° expected for perfect pseudomorphing of all pores formed by randomly impinging plagioclase grains. Those samples in which Θ cpp > 78° show curvature of the augite–plagioclase grain boundaries in the vicinity of the three-grain junction, indicative of simultaneous growth of the plagioclase forming the walls of the pore in which the augite is growing ( Fig. 2 c and d). The increase in Θ cpp is therefore achieved by a change in the relative rate of growth of the plagioclase pore walls and the infilling augite during the final stages of solidification ( Holness et al. , 2012 a ).
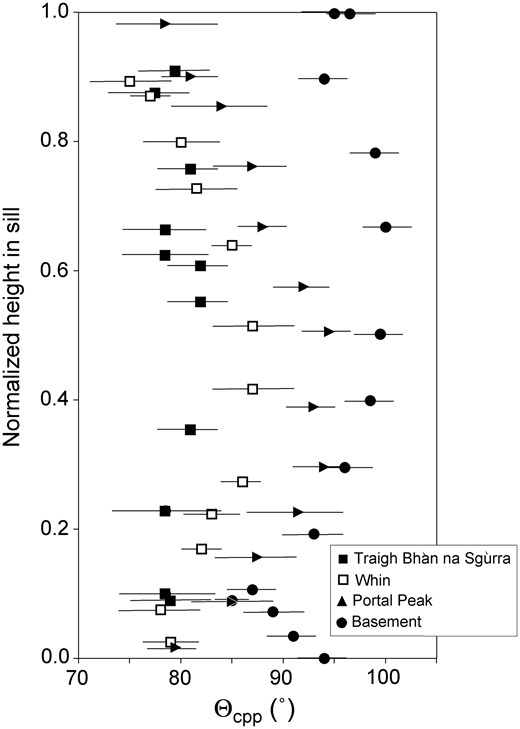
The variation of Θ cpp with stratigraphic height in dolerite sills. Data from Holness et al. (2012 b ) , with the addition of data for the Traigh Bhàn na Sgùrra sill (shown in Table 1 ).
![(a) A coarse-grained, glass-rich vein from the crust of the Kilauea Iki lava lake. Although many of the plagioclase–plagioclase junctions have been filled with augite, many still contain glass (asterisk). It should be noted how the plagioclase–augite grain boundaries are planar at the junctions (arrows). The value of Θ cpp in this sample is ∼78°. Sample KI76‐140.3, plane-polarized light. The scale bar is 1 mm long. (b) Sample ROM48‐219 from the Traigh Bhàn na Sgùrra sill, in which Θ cpp is 78·5 ± 4·5° ( Table 1 ). The augite–plagioclase grain boundaries are planar where they meet to form three-grain junctions (arrowed), whereas the narrower junctions between impinging plagioclase grains are filled with (partially devitrified) glass (asterisks). Plane-polarized light. Scale bar is 200 µm long. (c, d) A glass-rich vein from the crust of the Kilauea Iki lava lake (sample KI76‐143.3), showing the development of slight curvature of the left-hand augite–plagioclase grain boundary at the three-grain junction (arrowed) [(c) plane-polarized light; (d) crossed polars of the same field of view as (c)]. The scale bar is 1 mm long.](https://oup.silverchair-cdn.com/oup/backfile/Content_public/Journal/petrology/56/11/10.1093_petrology_egv065/3/m_egv065f2p.jpeg?Expires=1716434221&Signature=Zx5GX1fb9a6ZvobZb74Poxbv-6XN~dKE~qU-MXaw5DfNJAVGOLYwUJZCidqphBzNWH3I19evBtSINlJ2Z5LhFxoqTe4W6kZql5FG1V3GrXRmNzHSsiWw8BHfpHLusoOeUKCBO8WqJou0qYnKfe4E2lJCXKpeSX5QGokAIBytGektLN9Kq1wMHX5Wt0fhinJrmTUK58sWAX-ODZICbNK-n2TvPMog5JGvr~do8ejoQBOxe2e8AOKJ-WuKo9eoHna9ovgcKTIP5ACCHlWZHZYa728TgsSdx3vl-oJHq8u8GiSD0KhPAj1naRcZcR0vOX1AACY0cOtDb~x824KoXqHC9A__&Key-Pair-Id=APKAIE5G5CRDK6RD3PGA)
(a) A coarse-grained, glass-rich vein from the crust of the Kilauea Iki lava lake. Although many of the plagioclase–plagioclase junctions have been filled with augite, many still contain glass (asterisk). It should be noted how the plagioclase–augite grain boundaries are planar at the junctions (arrows). The value of Θ cpp in this sample is ∼78°. Sample KI76‐140.3, plane-polarized light. The scale bar is 1 mm long. (b) Sample ROM48‐219 from the Traigh Bhàn na Sgùrra sill, in which Θ cpp is 78·5 ± 4·5° ( Table 1 ). The augite–plagioclase grain boundaries are planar where they meet to form three-grain junctions (arrowed), whereas the narrower junctions between impinging plagioclase grains are filled with (partially devitrified) glass (asterisks). Plane-polarized light. Scale bar is 200 µm long. (c, d) A glass-rich vein from the crust of the Kilauea Iki lava lake (sample KI76‐143.3), showing the development of slight curvature of the left-hand augite–plagioclase grain boundary at the three-grain junction (arrowed) [(c) plane-polarized light; (d) crossed polars of the same field of view as (c)]. The scale bar is 1 mm long.
In fractionated bodies such as layered intrusions, Θ cpp varies in a fundamentally different way, exhibiting a constant value over great stretches of stratigraphy followed by discrete step-wise changes associated with changes in the liquidus assemblage ( Fig. 3 a). Θ cpp increases when the number of phases in the assemblage increases, with a corresponding decrease when the liquidus assemblage loses a phase ( Holness et al. , 2013 a ). This behavior has been ascribed to step-wise changes in the cooling rate caused by changes in the latent heat of crystallization ( Morse, 2011 ; Holness et al. , 2013 a ). Because the formation of three-grain junctions occurs during the last stages of solidification, Θ cpp is therefore providing information about solidification at or near the base of the crystal mushy layer ( Holness et al. , 2012 a ).
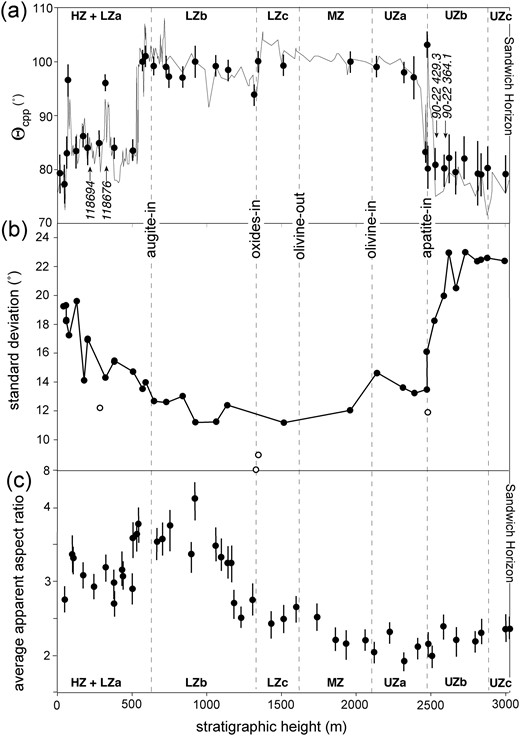
Microstructural variation in the Skaergaard Layered Series. The position of the progressive arrival of the different liquidus phases is shown. It should be noted that although the stratigraphic heights at which cumulus oxides and apatite are well known and easy to constrain, the arrival of cumulus augite can be ambiguous owing to the progressive change from a poikilitic to granular habit ( Holness et al. , 2015 ); it does fall above the associated step-wise increase in Θ cpp , however. (a) Θ cpp as a function of stratigraphic height. The continuous fine line shows the data presented by Holness et al. (2007 a, b ) whereas the data points with error bars are those presented by Holness et al. (2013 b ) . Also shown are the positions of the four samples for which more detailed dihedral angle data are presented in Table 4 . (b) The variation of standard deviation of augite–plagioclase–plagioclase dihedral angles as a function of stratigraphic position. Black dots denote samples for which 100 measurements were made, and the open circles those for which fewer measurements were made: the standard deviation for the latter is likely to be incorrect. These data were previously presented by Holness et al. (2013 b ) . (c) The stratigraphic variation of average apparent plagioclase aspect ratio, AR (data in Table 3 ).
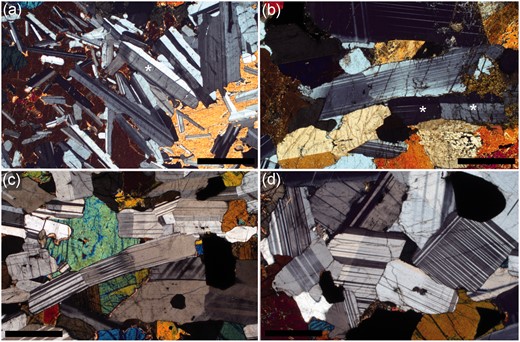
An exception to the generally observed step-wise behavior of Θ cpp in layered intrusions is found in the upper parts of the floor cumulates of the Skaergaard Intrusion, East Greenland. In these highly evolved, and last to crystallize, cumulates, which one might expect to have had the slowest crystallization rate, Θ cpp is ∼78°, a value typical of rapidly cooled dolerites ( Holness et al. , 2007 b , 2013,a ). Importantly, in contrast to stratigraphically lower, high-Θ cpp samples ( Fig. 4 a), the grain boundaries between (ferro-)augite and plagioclase in these more evolved cumulates are not curved in the vicinity of the three-grain junction but are planar, like those seen in rapidly cooled dolerites ( Fig. 4 b). Many of the narrower junctions between plagioclase grains are filled with granophyre ( Fig. 4 c and d), again similar to dolerites. These microstructural characteristics, coupled with the much greater grain size typical of slowly cooled gabbros, suggest the term ‘macro-dolerite’ to differentiate these rocks from less-evolved cumulates with high Θ cpp . The macro-dolerite microstructure has been attributed by Holness et al. (2013 a ) to cessation of plagioclase growth during the final stages of solidification at the base of the mushy layer. The growth behavior of plagioclase therefore appears to play a vital role in determining Θ cpp . This is supported by the observation of Holness et al. ( 2012 b , 2013 a ) that the dihedral angle population is the same for low-Ca pyroxene and Ca-rich pyroxene in the same sample: the composition and mineral structure of the second phase (at least in the pyroxene group of minerals) appears to be immaterial to the final dihedral angle population.
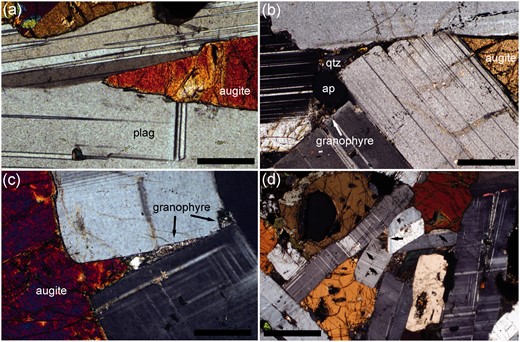
Photomicrographs of microstructural features of the Skaergaard Layered Series. (a) Augite–plagioclase–plagioclase junction with pronounced curvature of the two augite–plagioclase grain boundaries, leading to a higher dihedral angle than that formed by the original impingement of the two plagioclase grains. Sample 458285 (LZc) described by Tegner et al . (2009) . Cross polars. Scale bar is 200 µm long. (b) Sample 90‐22 40.9 (UZb) from the 90‐22 drill core. The planar augite–plagioclase grain boundaries forming a low dihedral angle should be noted. To the left of the image is a pocket of late-stage liquid that has crystallized to form a grain of apatite (ap), with quartz (qtz) and granophyre. The plagioclase walls of this pocket have not grown significantly and remain planar. Scale bar is 200 µm long. (c) Sample 90‐22 47.7 (UZb) from the 90‐22 drill core. The grain of augite has not grown into the narrow pore formed by the impingement of two plagioclase grains. Instead the pore has filled with granophyre. The planar walls bounding this pore, attesting to minimal growth of plagioclase subsequent to impingement, should be noted. Crossed polars. Scale bar is 200 µm long. (d) Sample 90‐22 87.7 (UZb) from the 90‐22 drill core, showing abundant pockets of granophyre (arrowed). The generally low aspect ratio of the cumulus plagioclase should also be noted. Crossed polars. Scale bar is 1 mm long.
Because the population of dihedral angles preserved in mafic intrusions is not in textural equilibrium, the range of angles in any one sample is some function of the processes that acted to create the three-grain junction, rather than reflecting the natural variation of equilibrium angles caused by anisotropy of interfacial energies. The detailed information provided by Holness et al. (2013 a ) for the floor cumulates of the Skaergaard Intrusion of East Greenland shows that the standard deviation of angles within each sample decreases steadily through the lower part of the sequence ( Fig. 3 b), with approximately constant values until the upper parts of the stratigraphy, where the standard deviation increases over some tens of metres to much higher values that are then maintained to the top of the cumulate pile. This abrupt increase in standard deviation, caused by a broadening of the monotonic range of dihedral angles, is accompanied by the change in morphology of pyroxene–plagioclase–plagioclase junctions from those with some curvature of the pyroxene–plagioclase grain boundaries to those formed by the meeting of planar pyroxene–plagioclase grain boundaries (i.e. the change to a macro-dolerite microstructure).
Although there is clear and strong evidence that the majority of mafic rocks preserve the original three-grain junction geometries created during solidification, some rocks have higher values of Θ cpp than expected for their likely cooling rates ( Fig. 1 ; Holness et al. , 2012 a , 2012,b ). Such rocks are typified by a fine grain size and a granular microstructure, and are generally found on the margins of large intrusions. The increase in Θ cpp from expected values can be attributed to significant sub-solidus textural equilibration, driven by the reduction in interfacial energy, leading to smoothly curved grain boundaries and an approach to the equilibrium three-grain junction geometry [the ‘metamorphic process’ of Holness et al. (2012 a ) ].
Plagioclase grain shape
It is not straightforward to determine the 3D shape of (non-spherical) mineral grains, such as plagioclase, using 2D sections through rocks, unless all grains have the same shape. Although this assumption underpins the 2D to 3D conversion method of Higgins (1994) it is unlikely to hold for natural samples (see Mock & Jerram, 2005 ; Duchene et al. , 2008 ). All assumptions about the 3D shape of non-spherical grains can be avoided by using a measurement technique based only on what grains look like in 2D sections. One such measure is the average apparent aspect ratio (AR), which is simply the average of the ratios of the long and short axes of all grain intersections visible in a thin section. As long as enough grains are measured to give a representative population, the average apparent aspect ratio for tabular grains is a reproducible (and rapidly acquired) parameter that is representative of the sample despite its relationship to the true 3D grain shape or range of grain shapes being unknown. In the most general sense, high values of AR are to be expected in samples containing randomly oriented platy grains, whereas low AR is to be expected either in samples containing randomly oriented equant grains or in samples in which platy grains have a preferred orientation parallel to the plane of the thin section.
Using the method of Higgins (1994) to convert apparent aspect ratios to 3D shapes, Hammer et al. (1999) found a systematic change, from tabular to prismatic, of plagioclase microlite shape in dacites from a series of pre-climactic eruptions of Mt. Pinatubo with increased repose interval duration. This was interpreted as a consequence of a change from a nucleation-dominated to a growth-dominated regime in the underlying magma chamber. Earlier, Cashman (1992) pointed out that the average apparent aspect ratio for plagioclase in the groundmass of Mount St. Helens dacite decreased with an assumed decrease in undercooling, and Higgins (1994) proposed that plagioclase becomes more platy (which would lead to higher values of AR) in situations where there is a high chemical potential gradient around the growing crystal. Higgins & Chandrasekharam (2007) developed this concept and suggested that plagioclase departs further from an equant habit (leading to higher AR) as the velocity of liquid flowing past the growing crystal increases. Thus highly tabular or platy grains are expected have grown in strongly convecting magmas.
Variation of plagioclase shape was put into a spatial and temporal context by Holness (2014) , who showed that AR for plagioclase varies systematically across dolerite sills and in basaltic lava lakes ( Fig. 5 ). In general, the lowest values of AR (expected to be generally associated with relatively equant grains, as the plagioclase grains are randomly oriented) are seen in the centres of sills. Furthermore, when sills of different thickness are compared, it is found that AR maps onto the crystallization time (calculated assuming diffusive heat transport): thus the highest values of AR (and greater departure from an equant shape) are observed in thin sills, and the lowest values are observed in thick sills. Because convection is expected to be strongest in thicker sills, this demonstrates that plagioclase grain shape in these bodies is not a function of convective vigour (see Higgins & Chandrasekharam, 2007 ), but is controlled by the differing response of the growth faces to undercooling (see Cashman, 1992 ).
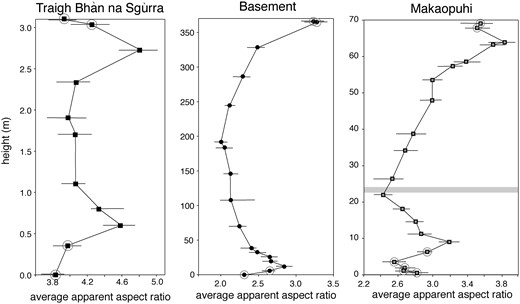
The variation of average apparent aspect ratio (AR) of plagioclase across two sills and the prehistoric Makaopuhi lava lake (from Holness, 2014 ). The shaded band in the Makaopuhi plot shows the position of the highest olivine mode, assumed to represent the slowest cooled horizon ( Evans & Moore, 1968 ). The circled data points denote marginal samples with low average apparent aspect ratios (see Fig. 9 ).
In dolerite sills and layered intrusions, plagioclase is generally tabular, with the large faces parallel to (010). The high AR (and generally platy shape) of plagioclase in rapidly cooled dolerites is therefore a consequence of the (010) faces growing more slowly than the (100) and (001) faces. As the cooling rate is reduced, the (010) faces grow at a rate closer to that of the (100) and (001) faces, resulting in a more equant shape and a lower AR.
In detail, AR variation forms an M-shaped profile across sills and lava lakes, with lower than expected values at the roof and floor ( Fig. 5 ). This has been attributed to the higher nucleation density in the most rapidly cooled parts of the body, resulting in early impingement of plagioclase grains, which can continue to grow only by becoming wider rather than longer ( Holness, 2014 ).
There is no relationship between the AR and Θ cpp in the marginal samples of sills. For the thinner sills, the M-shape variation of AR is not reflected in Θ cpp , which decreases smoothly down to the margins. For those thicker sills in which sub-solidus textural equilibration has been significant (resulting in higher than expected Θ cpp in the marginal samples as seen, for example, at the floor of the Basement Sill, Fig. 1 ), the geometry of three-grain junctions has been modified whereas the overall shape of the plagioclase grains has not. This is simply because textural equilibration begins with the establishment of the equilibrium dihedral angle, whereas the continued reduction of internal energies achieved by a change of grain shape to a granular microstructure requires much longer times, particularly in polymineralic materials.
HYPOTHESIS
Previously published studies have demonstrated that, in the absence of significant sub-solidus textural equilibration, the median augite–plagioclase–plagioclase dihedral angle in a sample from an essentially unfractionated mafic body is a function of the time it took to crystallize ( Holness et al. , 2012 b ). Furthermore, the population of dihedral angles formed at the junctions of two plagioclase grains and a pyroxene grain is the same regardless of the composition or crystal structure of the pyroxene ( Holness et al. , 2012 b , 2013 a ). This suggests that whatever is controlling the way dihedral angles at plagioclase junctions respond to changes in crystallization time is something that primarily affects plagioclase. A significant further observation is that the shape of plagioclase grains in dolerites is controlled by the cooling rate, with platy grains common in rapidly cooled dolerites whereas more blocky grains dominate in slowly cooled dolerites.
Although Θ cpp is the median of a population of angles formed at junctions between impinging plagioclase grains with random orientations, the majority of dihedral angles measured in thin section, particularly in dolerites in which plagioclase has no preferred orientation, are formed by the infilling of pores created by the impingement of the (010) faces of the two plagioclase grains. A high dihedral angle is a consequence of significant growth of these (010) faces during the formation of the three-grain junction (i.e. during the last stages of solidification). If a relatively high proportion of the volume of crystallizing plagioclase is added to (010) faces, then the final median value of the dihedral angle will be high ( Fig. 6 a and c). A generally low dihedral angle is formed if the (010) faces do not grow appreciably so that the melt-filled pore is effectively filled entirely by the mafic mineral ( Fig. 6 b and d).
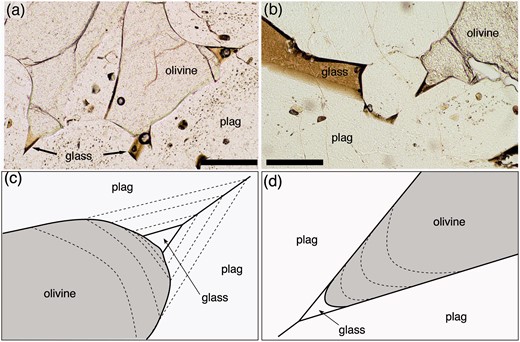
The effects of changing the relative growth rates of augite and plagioclase on the final geometry of the three-grain junction. (a, b) Glassy olivine gabbro nodules entrained in an Icelandic lava flow. Scale bars in both images are 200 µm long. (a) The olivine–plagioclase grain boundaries close to the remaining pockets of glass are curved, denoting simultaneous growth of the olivine and plagioclase (010) faces. If this were to continue the resultant olivine–plagioclase–plagioclase dihedral angle would be higher than that of the original impingement angle between the plagioclase grains (c). In (b) the olivine grain appears to be growing into the melt-filled pore formed by the impingement of two plagioclase grains with no associated growth of the plagioclase walls. Were this to continue, the resultant olivine–plagioclase–plagioclase dihedral angle would be the same as that of the original impingement angle (d).
If the critical variable is the proportion of plagioclase volume added to the (010) faces relative to that being added to the other growth faces for every volume increment of solidification (i.e. the increase in the total volume of solids), then the growth rate of the mafic mineral is immaterial. Therefore, although there is a wide variation of the orientations of impinging plagioclase grains, and of the geometry of the junctions formed by this impingement, the behavior of (010) faces has a dominant effect on the median value of the final population. This leads to the hypothesis that the underlying control on the systematic variation of Θ cpp is the response of plagioclase growth faces to changes in cooling rate. In this contribution this hypothesis is tested by a detailed investigation of the relationship between plagioclase growth behavior and dihedral angle populations in a wide variety of mafic igneous bodies.
MEASUREMENT TECHNIQUES
True dihedral angles were measured using a four-axis Leitz universal stage mounted on a James Swift monocular optical microscope, with a UM32 Leitz objective and a 10× eyepiece. The median value of a population of angles can be determined satisfactorily for a minimum of 25 measurements ( Riegger & van Vlack, 1960 ), although reduction of the uncertainty on the median to <±4–5° generally requires more than 50 measurements for those samples with a wide range of true angles ( Holness, 2010 ). Tight constraints can be placed on the standard deviation of dihedral angle only as the population approaches 100 ( Holness, 2010 ). Accurately constraining the skew of the population (the third moment) requires many more than 100 measurements. For each sample, up to 100 measurements were made, although for some only ∼25 measurements were possible. Quoted uncertainties are the 2σ confidence intervals about the median calculated according to the method of Stickels & Hücke (1964) .
Average apparent aspect ratios for plagioclase were determined from images of thin sections, following the procedure of Holness (2014) . The finer-grained samples were imaged using a camera mounted on an optical microscope, and images of the coarser-grained samples were obtained with a high-resolution scanner using two polaroid sheets. The long and short axes on each grain in any given image were drawn on by hand, and the aspect ratio was determined using ImageJ. Between 115 and 306 grains were measured for each sample. The 2σ uncertainties on the average apparent aspect ratio were determined using a bootstrap method based on random sampling of the measurement population.
QEMSCAN (quantitative evaluation of minerals by scanning electron microscopy) images were obtained for two Skaergaard gabbros using a Quanta 650 F field emission gun (FEG) scanning electron microscope (SEM), equipped with two Bruker XFlash 6130 energy dispersive spectrometers (EDS) at the Department of Earth Sciences, University of Cambridge. The fully automated system includes an automated spectrum acquisition and classification procedure. Analyses were performed by obtaining field-scans, providing a complete characterization of particle surfaces above a predefined electron backscatter threshold. In this study the threshold was set to values above the backscatter coefficient of resin, therefore effectively allowing the instrument to ignore the resin in the sample during the scan. The brightness coefficients were calibrated against quartz, gold and copper. Spectra were collected at 25 kV and 10 nA with 2000 total X-ray counts at a 7·5 µm spacing, and compared with a species identification protocol (SIP) that discriminates between minerals on the basis of their characteristic X-ray and electron backscatter intensities.
The QEMSCAN images were used to create maps of Ca concentration, to distinguish between plagioclase grain cores and rims. The division between core and rim was placed at An 62 , the average composition for plagioclase cores in the samples, with the rim having lower anorthite content. Apparent aspect ratios were obtained by measuring the long and short axes of 100 grains per sample, with two sets of measurements for each grain, one for the overall shape and the other for the compositionally unzoned grain core.
PETROGRAPHIC OBSERVATIONS OF MAFIC INTRUSIONS
Progress towards understanding the systematic variation of Θ cpp in mafic intrusions can be made only by careful observation of natural examples, documenting the way in which Θ cpp varies in a wide range of settings to constrain the controlling parameters. This contribution involves a return to the group of small bodies that were the focus of earlier work by Holness et al. ( 2012 b , 2013 b ) and Holness (2014) on the effects of cooling rate on microstructure: the Traigh Bhàn na Sgùrra, Whin, Portal Peak, Koffiefontein and Basement sills, the prehistoric Makaopuhi lava lake, and the Skaergaard Campsite dykes; the reader is referred to these publications for background details of the general geological setting, and for the source of the previously published microstructural data, some of which is reproduced in Figs 1 and 5 . Whereas AR data have previously been reported for all of these bodies ( Holness, 2014 ), Θ cpp data have been published only for the Traigh Bhàn na Sgùrra, Whin, Portal Peak and Basement sills ( Holness et al. , 2012 b ), and for the Campsite Dykes ( Holness et al. , 2013 b ). For the present study Θ cpp data were collected for the Koffiefontein sill and the prehistoric Makaopuhi lava lake, with further data collected from the Traigh Bhàn na Sgùrra sill ( Table 1 ).
Dihedral angle data for clinopyroxene–plagioclase–plagioclase three-grain junctions
| Sample | Height (m) | n | Θ cpp | SD | Skew |
|---|---|---|---|---|---|
| Traigh Bhàn na Sgùrra sill (3·1–3·5 m thick) | |||||
| ROM48‐32 | 0·32 | 80 | 79 ± 4 | 18·4 | 0·0 |
| ROM48‐219* | 2·19 | 60 | 78·5 ± 4·5 | 19·4 | –0·9 |
| ROM48‐318 | 3·18 | 100 | 79·5 ± 3·5 | 21·0 | –0·4 |
| ROM43‐35* | 2·75 | 100 | 78·5 ± 4·5 | 23·1 | –0·5 |
| ROM43‐80* | 2·30 | 104 | 78·5 ± 5·5 | 20·5 | –0·3 |
| ROM43‐110 | 2·00 | 80 | 81 ± 3 | 13·2 | –0·3 |
| ROM43‐170* | 1·40 | 80 | 82 ± 3 | 14·8 | 0·0 |
| ROM43‐190 | 1·20 | 71 | 82 ± 3 | 16·4 | –0·2 |
| ROM43‐233 | 0·77 | 80 | 81 ± 3 | 18·8 | –0·3 |
| ROM43‐272 | 0·38 | 80 | 77·5 ± 4 | 18·2 | –0·1 |
| Koffiefontein sill (188 m thick) | |||||
| 1127 | 1·7 | 50 | 79·5 ± 3 | 16·8 | –0·2 |
| 1125 | 4·0 | 50 | 79·5 ± 4·5 | 18·5 | –0·6 |
| 1073 | 9·6 | 50 | 84 ± 3·5 | 13·4 | –0·8 |
| 1070 | 12·7 | 50 | 87 ± 6 | 15·2 | –1·2 |
| 1065 | 18·0 | 50 | 90 ± 3 | 12·7 | –1·6 |
| 1042 | 41·0 | 50 | 97·5 ± 3 | 11·8 | –0·4 |
| 945 | 84·4 | 50 | 96·5 ± 4 | 12·8 | –0·6 |
| 912 | 117·0 | 50 | 100·5 ± 3 | 10·0 | –0·7 |
| 871 | 158·0 | 50 | 93 ± 1·5 | 15·6 | –1·0 |
| 860 | 170·0 | 50 | 88 ± 3 | 14·4 | –1·1 |
| 843 | 187.0 | 50 | 85·5 ± 5 | 19·3 | –0·6 |
| Makaopuhi prehistoric lava lake (68 m deep) | |||||
| MP-57 | 66·5 | 100 | 78 ± 3·5 | 17·4 | –0·4 |
| MP-72 | 61·9 | 100 | 84 ± 3 | 16·7 | –0·7 |
| MP-87 | 57·3 | 100 | 87 ± 3·5 | 14·0 | –0·4 |
| MP-91 | 56·1 | 100 | 88·5 ± 2 | 15·5 | –1·0 |
| MP-103 | 52·4 | 100 | 88 ± 2 | 11·2 | –0·3 |
| MP-121 | 47·0 | 100 | 89 ± 2·5 | 10·2 | –0·6 |
| MP-151 | 37·8 | 100 | 90 ± 3 | 14·1 | –0·9 |
| MP-166 | 33·2 | 100 | 91 ± 3·5 | 14·7 | –0·6 |
| MP-191 | 25·6 | 100 | 92 ± 3 | 11·8 | 0·0 |
| MP-218 | 17·4 | 100 | 93 ± 3 | 11·1 | –1·0 |
| MP-229 | 14·0 | 100 | 93 ± 2 | 10·3 | –0·4 |
| MP-240 | 10·7 | 100 | 94·5 ± 2·5 | 14·6 | –0·5 |
| MP-247 | 8·6 | 100 | 93 ± 2 | 10·9 | –0·8 |
| MP-256 | 5·8 | 100 | 92 ± 3 | 11·6 | –0·6 |
| MP-265 | 3·1 | 100 | 89 ± 3 | 13·5 | –1·3 |
| MP-275 | 0·0 | 100 | 89·5 ± 2·5 | 12·1 | 0·0 |
n , number of single measurements; uncertainty on the median angle, Θ cpp , is the 2σ confidence interval calculated according to Stickels & Hücke (1964) ; SD, standard deviation of the population; skew is the skew of the population.
*Samples previously reported by Holness et al. (2012 a ) , although dihedral angles in ROM43‐170 were re-measured for the present study.
To this group are added examples from four mafic layered intrusions: the Skaergaard Intrusion (East Greenland), the Upper Zone of the Bushveld Complex (South Africa), the Eastern Layered Intrusion of Rum (Inner Hebrides, Scotland), and the Sept Iles Intrusion (Quebec, Canada). Each of these intrusions has a generally basaltic composition, but with distinctly different liquid lines of descent [a summary of which has been given by Holness et al. (2013 a ) ]. Dihedral angle data for augite–plagioclase–plagioclase junctions in all samples have previously been documented ( Holness et al. , 2007 a , 2007 b , 2013a ). Published datasets for Θ cpp from the upper part of the Skaergaard Layered Series were augmented by adding further measurements to create the larger populations necessary to reduce the 95% confidence intervals about the median value ( Table 2 ).
Dihedral angle data for clinopyroxene–plagioclase–plagioclase three-grain junctions in the 90‐22 drill core
| Sample | n | Θ cpp | SD | Skew |
|---|---|---|---|---|
| 90‐22 585.8 | 100 | 97 ± 2·5 | 13·3 | −0·8 |
| 90‐22 563.3 | 50 | 96 ± 2 | 14·2 | −1·0 |
| 90‐22 530.9 | 50 | 94 ± 4 | 11·2 | −0·3 |
| 90‐22 490.8 | 32 | 92·5 ± 4 | 9·8 | −0·4 |
| 90‐22 487.15 | 50 | 91 ± 3 | 11·7 | −0·4 |
| 90‐22 486.05 | 40 | 88 ± 2·5 | 12·7 | −2·4 |
| 90‐22 485 | 100 | 80 ± 4 | 13·5 | 0·5 |
| 90‐22 483.3 | 100 | 83 ± 2·5 | 16·1 | −1·2 |
| 90‐22 482.2 | 30 | 82 ± 3 | 7·0 | 1·1 |
| 90‐22 480.1 | 50 | 82 ± 2 | 12·4 | 0·3 |
| 90‐22 478.2 | 50 | 83 ± 3 | 8·2 | 0·6 |
| 90‐22 477.1 | 50 | 84·5 ± 2 | 12·0 | 0·0 |
| 90‐22 475.5 | 50 | 90 ± 2 | 8·6 | −1·8 |
| 90‐22 475 | 50 | 103 ± 2·5 | 12·0 | −0·7 |
| 90‐22 471.8 | 50 | 96·5 ± 3 | 14·0 | 2·3 |
| 90‐22 466.97 | 50 | 95 ± 2 | 10·7 | −0·5 |
| 90‐22 461.8 | 50 | 89 ± 5 | 23·4 | −0·5 |
| 90‐22 455 | 50 | 90·5 ± 2 | 12·7 | −2·0 |
| 90‐22 450 | 50 | 90·5 ± 3 | 13·7 | −2·4 |
| 90‐22 441.7 | 50 | 90·5 ± 4 | 14·2 | 0·7 |
| 90‐22 429.3 | 50 | 83 ± 3 | 11·5 | 0·0 |
| 90‐22 421 | 100 | 80·5 ± 4 | 18·2 | 0·0 |
| 90‐22 364.1 | 100 | 80 ± 3 | 20·0 | −0·3 |
| 90‐22 323.8 | 95 | 82 ± 4 | 22·9 | −0·6 |
| 90‐22 210.9 | 100 | 82 ± 4 | 23·0 | −0·8 |
The number in the sample name, after the prefix 90‐22, gives the depth in the core in metres. n , number of single measurements; uncertainty on the median angle, Θ cpp , is the 2σ confidence interval calculated according to Stickels & Hücke (1964) ; SD, standard deviation of the population; skew is the skew of the population.
Samples were chosen for which the greatest number of possible phases formed three-grain junctions with plagioclase, covering a large stratigraphic range and range of Θ cpp . Dihedral angles were measured at junctions between two plagioclase grains and a range of other minerals including augite, low-Ca pyroxene (orthopyroxene), amphibole, biotite and olivine, regardless of whether the mafic phase is interstitial or cumulus. No attempt was made to measure Fe–Ti oxide–plagioclase–plagioclase junctions because the opacity of the oxide in thin sections of standard thickness prevents determination of the orientation of the grain boundaries. Olivine–plagioclase–plagioclase dihedral angles were commonly difficult to measure accurately because of late-stage hydrous alteration of the edges of the olivine grains. Apatite–plagioclase–plagioclase angles were not measured because there was insufficient apatite in any sample to produce satisfactory numbers of measurements. However, note was taken of the morphology of interstitial apatite grains.
Sills, dykes and lava lakes
Θ cpp data from samples of the Koffiefontein sill and the prehistoric Makaopuhi lava lake are given in Table 1 and shown in Fig. 7 . The dataset for the Traigh Bhàn na Sgùrra sill [for which some data were presented by Holness et al. (2012 b ) ] is also given in Table 1 .
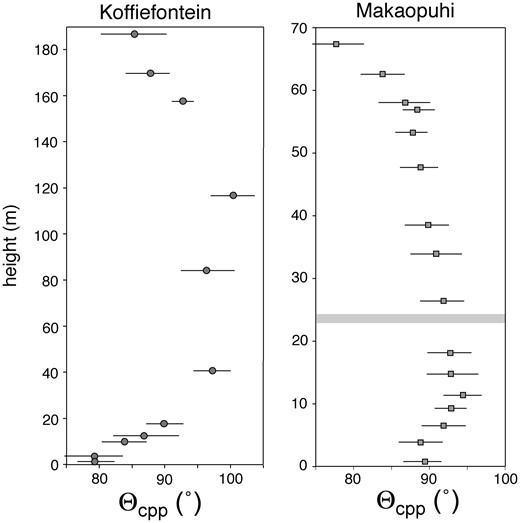
The stratigraphic variation of Θ cpp in the Koffiefontein sill and the prehistoric Makaopuhi lava lake. The data are presented in Table 1 .
For a single sample of the Portal Peak sill, 87‐110, the angle formed by the impingement of two plagioclase grains at 100 three-grain junctions was measured; that is, the angle made by the two bounding (010) faces of the impinging grains far from the actual junction. For comparison, the actual augite–plagioclase–plagioclase dihedral angle at each of these junctions was also measured. The value of Θ cpp for this sample is 94·5° ± 3·5° with a standard deviation of 15° ( Holness et al. , 2012 b ). In contrast, the median impingement angle is 81·5° ± 8°, with a standard deviation of 25°, similar to the impingement angle populations found in glassy nodules ( Holness et al. , 2012 a ). The actual augite–plagioclase–plagioclase dihedral angle at each of the 100 junctions is plotted in Fig. 8 as a function of the angle at which the two (010) plagioclase faces impinge.
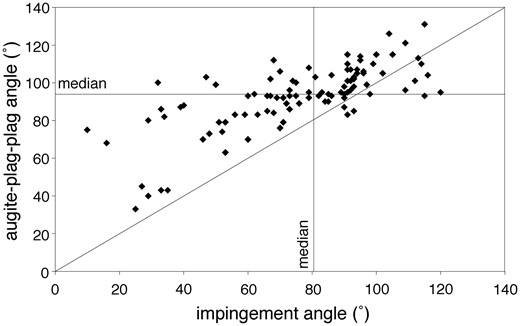
The augite–plagioclase–plagioclase dihedral angle as a function of the original angle at which the two plagioclase grains impinged. The 100 junctions were measured in sample 87‐110 from the Portal Peak sill. The two orthogonal lines show the median values of the two separate populations. The 1:1 slope is also shown.
Figure 9 is a plot of AR against Θ cpp for the five sills, the Makaopuhi lava lake and the Campsite dykes. For comparison the plot also includes a data point representing textural equilibrium, for which it is assumed that the aspect ratio of plagioclase is 1·0 (i.e. the microstructure is granular) and the equilibrium value of Θ cpp is 109° ± 2° ( Holness, 2010 ). All the data fall on a trend between complete textural equilibrium and a region of low Θ cpp and high AR populated mainly by data from the rapidly cooled, 3·5 m thick, Traigh Bhàn na Sgùrra sill. The slowest-cooled samples (those from the central regions of the thicker sills) lie closer to textural equilibrium. The sill and lava lake samples identified as marginal on the basis of a lower than expected AR ( Fig. 5 ) are circled, with those from the upper margin of the bodies tending to lie towards the top of the distribution and those from the lower margin tending to lie towards the bottom of the distribution.
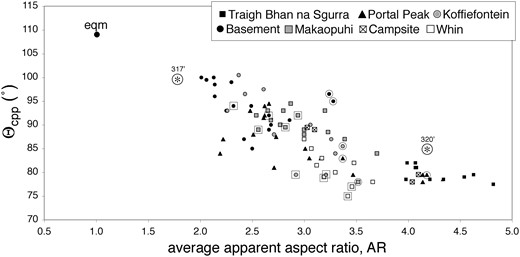
Θ cpp as a function of the average apparent aspect ratio (AR) for sills, the Makaopuhi lava lake, and the Campsite dykes. The data point labeled ‘eqm’ shows the expected position of a sample in complete textural equilibrium, with Θ cpp = 109° and a granular microstructure with AR = 1. The data points surrounded by a circle are those from the top margin whereas those surrounded by a square are from the bottom margin. The two data points labeled 317′ and 320′ are those for the overgrowths of plagioclase primocrysts for the two Skaergaard gabbros imaged using QEMSCAN ( Fig. 14 ). (See text for details.)
The Layered Series of the Skaergaard Intrusion, East Greenland
General petrographic observations
The Layered Series of the Skaergaard Intrusion formed by accumulation of crystals on the floor of a closed magma chamber ( Wager & Deer, 1939 ). It is characterized by a continuous sequence of progressively more fractionated cumulates. The liquidus assemblage at the base comprised plagioclase and olivine [Hidden Zone (HZ) and Lower Zone a (LZa)]. This assemblage was sequentially augmented by the addition of augite (LZb) and Fe–Ti oxides (LZc). The disappearance of olivine marks the base of the Middle Zone (MZ), the top of which is defined by the reappearance of olivine [marking the base of Upper Zone a (UZa)]. The arrival of cumulus apatite defines the base of UZb, whereas UZc is defined by the appearance of a mosaic formed of ferrohedenbergite inverted from β-ferrobustamite. The top of the sequence is marked by the Sandwich Horizon, where the floor cumulates meet those crystallizing downwards from the roof (the Upper Border Series; UBS). Further details of the petrology of this intrusion have been given by McBirney (1996) .
The samples examined as part of this study have been studied extensively before. The sample set comprises the Cambridge 1966 drill core that samples HZ, LZa and the lower part of LZb, the part of a reference section of surface samples collected by Christian Tegner and others in 2000 that includes LZa, LZb and LZc ( Tegner et al. , 2009 ), samples collected by Karen Bollingberg from MZ, UZa, UZb and UZc ( Bollingberg, 1995) , and the 90‐22 drill core, which samples MZ, UZa and UZb ( Holness et al. , 2007 b ; Tegner et al. , 2009 ). There are areas of stratigraphic overlap between the different sample sets, providing the opportunity to test whether any microstructural variations might be localized or general to the intrusion. The locations of cores and surface samples are shown in Fig. 10 . Stratigraphic heights are assigned to each sample according to the stratigraphy used by Holness et al. (2007 b ) , which was based on the model of Nielsen (2004) ; the zero point of the stratigraphy is placed at the base of the Cambridge 1966 drill core.
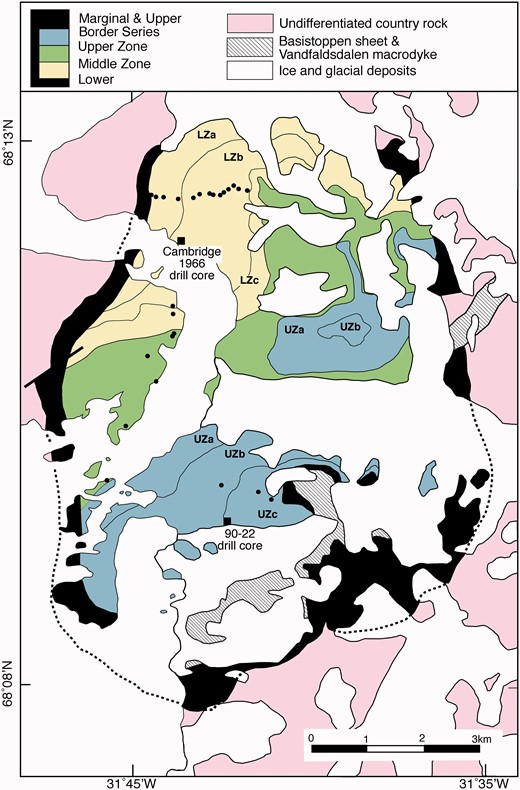
Simplified geological map of the Skaergaard Intrusion, after McBirney (1989) , showing the position of the two drill cores and the surface samples used to determine the stratigraphic variation of AR ( Fig. 3 a).
Augite–plagioclase grain boundaries in the lower parts of the Layered Series are curved in the immediate vicinity of the three-grain junctions, often with some asymmetry, and commonly have relatively Na-rich plagioclase immediately adjacent to the junction. The sense of the asymmetry is generally such that the convex grain boundary involves that plagioclase grain whose (010) face defines the orientation of the plagioclase–plagioclase grain boundary ( Holness et al. , 2013 a ) ( Fig. 11 a). The curvature of augite–plagioclase grain boundaries at three-grain junctions decreases at the top of UZa, resulting in a reduction of Θ cpp (and a macro-dolerite microstructure). The arrival of cumulus apatite is marked by the reappearance of grain boundary curvature and high Θ cpp , but high values of Θ cpp persist for only a few tens of metres of stratigraphy before grain boundaries become planar again; they remain planar, resulting in Θ cpp of ∼78° (i.e. a macro-dolerite microstructure), for the rest of UZb and all of UZc ( Figs 3 and 4 b). Planar augite–plagioclase grain boundaries at three-grain junctions are closely associated with a tendency for all mafic phases to infill small pores between plagioclase grains.
![Photomicrographs of late-stage features in the Skaergaard Intrusion. (a) Sample from 252′4″ depth in the Cambridge drill core (LZb). The curvature of the augite–plagioclase grain boundaries is asymmetrical at each of the two three-grain junctions, although the asymmetry is much less marked at the left-hand junction than at the right-hand junction. On the left, the two plagioclase grains have similar orientations [with a low angle between their (010) planes] whereas the two on the right have very different orientations. The sense of the asymmetry is such that the most strongly curved boundary is associated with the plagioclase grain whose (010) plane is nearly parallel to the plagioclase–plagioclase grain boundary, so only weak asymmetry is seen if the two plagioclase grains have a low original impingement angle. Crossed polars. Scale bar is 200 µm long. (b) Sample with macro-dolerite microstructure showing anhedral apatite (ap) filling pores between plagioclase grains. Crossed polars. Scale bar is 200 µm long. (c) Sample 90‐22 893.6 from drill core 90‐22 (UZa) showing reactive symplectite of anorthitic plagioclase and clinopyroxene replacing primocryst plagioclase. Plane-polarized light. Scale bar is 200 µm long. (d) Sample 90‐22 87.7 from the 90‐22 drill core (UZc), showing pockets of granophyre bounded by planar plagioclase walls. Crossed polars. Scale bar is 200 µm long. (e) Sample 90‐22 364.1 from the 90‐22 drill core (UZb) showing ilmenite intergrown with fayalitic olivine. The large cumulus grains of apatite should be noted. Plane-polarized light. Scale bar is 200 µm long. (f) Sample 90‐22 482.2 from the 90‐22 drill core (UZa) showing pockets filled with quartz (qtz). The irregularity of the plagioclase walls and the strong compositional zoning should be noted; both features denote significant overgrowth of the pore walls during quartz crystallization. Crossed polars. Scale bar is 200 µm long.](https://oup.silverchair-cdn.com/oup/backfile/Content_public/Journal/petrology/56/11/10.1093_petrology_egv065/3/m_egv065f11p.jpeg?Expires=1716434221&Signature=Guu53dMKycDEPObpnT1iaNjuPC2SGW3meol9Kr--VqVVU29jFBAvCiFNKstFeqFsPjDoeEf6290DRwBybsZlcNRZkdEOyjS-9KnXid287WTc-0f234tuT6NWtZlUZIleoI8qzKsjjuAuX0922DgRlOPOPHXNGi~NtidoaHu-ydxuX-PpVsKMaAFW6bQbRSztHN6h~5-5-jihgV0AcuwOn9UiCX8Jt-3MtWxHW3sEOavX6ym~PncOcz~4p2VhfYfrsur1dKGQeOEOFcWaz0m2~p9t-dqSEvbFS8Sc-RTDii4rABs5Cd4FgK~DhgWDviml0y-V0qxCuDUEL-zr7lHLZg__&Key-Pair-Id=APKAIE5G5CRDK6RD3PGA)
Photomicrographs of late-stage features in the Skaergaard Intrusion. (a) Sample from 252′4″ depth in the Cambridge drill core (LZb). The curvature of the augite–plagioclase grain boundaries is asymmetrical at each of the two three-grain junctions, although the asymmetry is much less marked at the left-hand junction than at the right-hand junction. On the left, the two plagioclase grains have similar orientations [with a low angle between their (010) planes] whereas the two on the right have very different orientations. The sense of the asymmetry is such that the most strongly curved boundary is associated with the plagioclase grain whose (010) plane is nearly parallel to the plagioclase–plagioclase grain boundary, so only weak asymmetry is seen if the two plagioclase grains have a low original impingement angle. Crossed polars. Scale bar is 200 µm long. (b) Sample with macro-dolerite microstructure showing anhedral apatite (ap) filling pores between plagioclase grains. Crossed polars. Scale bar is 200 µm long. (c) Sample 90‐22 893.6 from drill core 90‐22 (UZa) showing reactive symplectite of anorthitic plagioclase and clinopyroxene replacing primocryst plagioclase. Plane-polarized light. Scale bar is 200 µm long. (d) Sample 90‐22 87.7 from the 90‐22 drill core (UZc), showing pockets of granophyre bounded by planar plagioclase walls. Crossed polars. Scale bar is 200 µm long. (e) Sample 90‐22 364.1 from the 90‐22 drill core (UZb) showing ilmenite intergrown with fayalitic olivine. The large cumulus grains of apatite should be noted. Plane-polarized light. Scale bar is 200 µm long. (f) Sample 90‐22 482.2 from the 90‐22 drill core (UZa) showing pockets filled with quartz (qtz). The irregularity of the plagioclase walls and the strong compositional zoning should be noted; both features denote significant overgrowth of the pore walls during quartz crystallization. Crossed polars. Scale bar is 200 µm long.
Apatite is anhedral at the top of UZa in the low Θ cpp macro-dolerites below apatite-in ( Fig. 11 b), becoming euhedral in UZb, once apatite joins the liquidus assemblage. Apatite is also locally anhedral in the lowest part of the Layered Series, in LZa and the lower part of LZb ( Holness et al. , 2013 a ), becoming invariably euhedral above 754 m stratigraphic height (i.e. between the two samples 458225 and 458226 of the reference section of surface samples ( Tegner et al ., 2009 )) until the macro-dolerites of upper UZa—this change corresponds to a significant and sharp reduction in the calculated volume of trapped liquid ( Tegner et al. , 2009 ).
Because dihedral angles form during the last stages of solidification, the amount, composition and behavior of the late-stage evolved liquid are of great importance in any effort to understand their formation. There is considerable disagreement in the literature concerning the Skaergaard liquid line of descent, with some arguing for Fe-enrichment in the last liquids ( Wager, 1960 ; McBirney & Naslund, 1990 ; Tegner, 1997 ; Thy et al. , 2009 ; Tegner & Cawthorn, 2010 ) whereas others have argued for progressive Si-enrichment ( Hunter & Sparks, 1987 ; Toplis & Carroll, 1995 , 1996 ). Recent work has shown that, as it evolved, the bulk magma ( Jakobsen et al. , 2011 ) and the interstitial liquid ( Holness et al. , 2011 ) entered the two-liquid field, splitting into Fe-rich and Si-rich immiscible conjugates. The history of interstitial crystallization in the Skaergaard cumulates is thus characterized by the presence or absence of features such as reactive symplectites ( Fig. 11 c), pockets of granophyre ( Fig. 11 d) and ilmenite-rich intergrowths ( Fig. 11 e). Holness et al. (2011) showed that reactive symplectites are a consequence of loss of the silica-rich conjugate liquid from the crystal mushy layer once the interstitial liquid intersects the two-liquid solvus. The Fe-rich liquid that remains reacts with the primocrysts, forming symplectites of anorthitic plagioclase and a mafic phase (usually clinopyroxene, but it may also be olivine) that grow outwards from Fe–Ti oxide grains and replace plagioclase ( Fig. 11 c). Reactive symplectites are present throughout the lower part of the Layered Series but are absent from much of UZ ( Holness et al. , 2011 ). In their place are coexisting interstitial pockets of granophyre (intergrowths of K-feldspar and quartz, generally closely associated with plagioclase-rich regions of the rock; Fig. 11 d) and patches of ilmenite intergrown with a variety of different minerals (e.g. olivine in Fig. 11 e, but may also be intergrown with clinopyroxene, apatite or feldspar). Ilmenite-rich intergrowths are generally concentrated in regions rich in mafic minerals. This transition has been interpreted as marking the stratigraphic height at which the viscous silica-rich conjugate liquid was no longer lost but was retained in the mush ( Holness et al. , 2011 ), perhaps because it became the volumetrically dominant phase in the emulsion. The transition is transgressive with relation to the stratigraphy, occurring at lower stratigraphic heights at the margins compared with the centre of the intrusion [ Holness et al. , 2011 ; see also fig. 5 of McBirney (1996) , which shows the transition as ‘the limit of rocks containing abundant interstitial granophyre’].
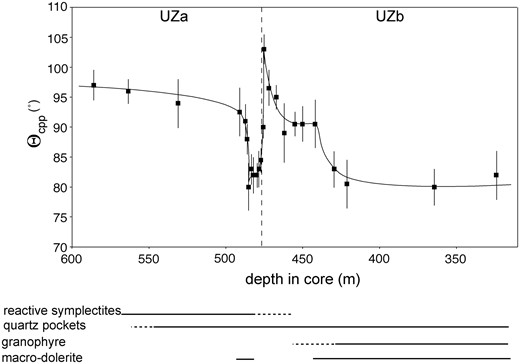
In detail, the transition occurs over 100–200 m of stratigraphy in which symplectites coexist with small interstitial pockets of quartz (invariably surrounded by plagioclase; Fig. 11 f), with a gradual appearance of granophyre (i.e. the arrival of K-feldspar as an interstitial phase) and disappearance of symplectites higher in the stratigraphy. In the suite of samples examined here, the transition from a symplectite-dominated late-stage assemblage to one containing granophyre and ilmenite-rich intergrowths is seen in drill core 90‐22, in the vicinity of the UZa–b boundary. The lowest appearance of quartz pockets occurs at about 550 m depth in the core, with the final disappearance of reactive symplectites at about 450 m depth, where the first interstitial granophyre appears ( Fig. 12 ). Granophyre is a common constituent at ∼430 m and increases in abundance upwards through the rest of the core. The volume of granophyre is invariably greater than that of the ilmenite-rich intergrowths; this difference increases with increasing stratigraphic height as ilmenite-rich intergrowths become rare or absent in UZc. We measured Θ cpp in closely spaced samples from the transition zone in drill core 90‐22, which coincides with the gradual appearance of the macro-dolerite microstructure at the top of UZa ( Fig. 12 ; Table 2 ).
Plagioclase grain shape
The average apparent aspect ratio of plagioclase, AR, varies systematically in the Layered Series ( Fig. 3 c, Table 3 ). AR in the lowest parts of the stratigraphy is ∼3 ( Fig. 13 a), and increases in a step-wise manner at ∼500 m stratigraphic height, with a step-wise decrease at ∼1170 m. The step-wise decrease is associated with an increase in evidence for intra-crystalliine deformation of plagioclase ( Fig. 13 b and c). Further up the stratigraphy AR decreases to a minimum of ∼2·0 at ∼2300 m stratigraphic height (Figs 3b and 13d), followed by a slow increase to ∼2·4 at the Sandwich Horizon. There is no obvious relationship between either the median or the standard deviation of Θ cpp and AR ( Fig. 3 ).
Photomicrographs (all under crossed polars) showing the shape of plagioclase as a function of height in the Skaergaard Layered Series. (a) Sample 118727 from the Cambridge drill core (104 m stratigraphic height. AR = 3·37). The prominent rim on the grain marked with an asterisk should be noted; rims of this kind are shown clearly in the QEMSCAN images in Fig. 14 . Scale bar is 1 mm long. (b) Sample 90‐22 555.5 from the 90‐22 drill core (2412 m stratigraphic height, AR = 2·12). The large grain in the centre of the image has been bent and deformed with the development of deformation twins. It is possible that the two grains immediately below it in the image (marked with asterisks) were also part of a single, now recrystallized, grain. Scale bar is 1 mm long. (c) Sample 458285 from the Tegner (2000) reference section (1517 m stratigraphic height, AR = 2·49). The grain in the centre of the image is very significantly bent and appears to be recrystallizing into three separate grains. Scale bar is 1 mm long. (d) Sample 90‐22 893.6 from the 90‐22 drill core (2121 m stratigraphic height, AR = 2·05), showing almost equant cumulus plagioclase grains. Scale bar is 1 mm long.
Plagioclase grain shape data for the Skaergaard Layered Series
| Sample | Height | n | Apparent aspect ratio | Sample set | |||
|---|---|---|---|---|---|---|---|
| (m) | Average | Min. | Max. | ||||
| 118738 | HZ | 50 | 261 | 2·76 | 2·58 | 2·94 | Cambridge drill core |
| 118727 | HZ | 104 | 260 | 3·37 | 3·12 | 3·63 | Cambridge drill core |
| 118726 | HZ | 109 | 211 | 3·32 | 3·11 | 3·47 | Cambridge drill core |
| 879′12″ | HZ | 175 | 260 | 3·08 | 2·91 | 3·26 | Cambridge drill core |
| 118684 | HZ | 248 | 259 | 2·93 | 2·78 | 3·11 | Cambridge drill core |
| 651′2″ | LZa | 326 | 259 | 3·19 | 3 | 3·37 | Cambridge drill core |
| 458242 | LZa | 381 | 257 | 2·98 | 2·76 | 3·16 | Tegner, 2000 |
| 561′1″ | LZa | 383 | 277 | 2·7 | 2·53 | 2·86 | Cambridge drill core |
| 118645 | LZa | 434 | 244 | 3·16 | 2·94 | 3·41 | Cambridge drill core |
| 458212 | LZa | 439 | 278 | 3·07 | 2·89 | 3·27 | Tegner, 2000 |
| 458213 | LZa | 505 | 262 | 2·9 | 2·69 | 3·11 | Tegner, 2000 |
| 371′7″ | LZa | 507 | 266 | 3·59 | 3·32 | 3·81 | Cambridge drill core |
| 320′6″ | LZa | 534 | 211 | 3·64 | 3·41 | 3·83 | Cambridge drill core |
| 317′6·5″ | LZa | 542 | 305 | 3·78 | 3·52 | 4 | Cambridge drill core |
| 458219 | LZa | 668 | 281 | 3·54 | 3·29 | 3·73 | Tegner, 2000 |
| 458224 | LZb | 703 | 248 | 3·58 | 3·34 | 3·82 | Tegner, 2000 |
| 458225 | LZb | 754 | 221 | 3·75 | 3·41 | 3·97 | Tegner, 2000 |
| 458227 | LZb | 898 | 147 | 3·36 | 3·12 | 3·54 | Tegner, 2000 |
| 458231 | LZb | 922 | 189 | 4·12 | 3·83 | 4·33 | Tegner, 2000 |
| 458201 | LZb | 1062 | 122 | 3·48 | 3·28 | 3·73 | Tegner, 2000 |
| 458202 | LZb | 1097 | 191 | 3·33 | 3·15 | 3·59 | Tegner, 2000 |
| 458203 | LZb | 1143 | 201 | 3·25 | 3·04 | 3·48 | Tegner, 2000 |
| 458204 | LZb | 1168 | 152 | 3·25 | 2·99 | 3·49 | Tegner, 2000 |
| 458205 | LZb | 1183 | 135 | 2·71 | 2·5 | 2·89 | Tegner, 2000 |
| 458206 | LZb | 1231 | 115 | 2·51 | 2·37 | 2·67 | Tegner, 2000 |
| 458277 | LZb | 1310 | 247 | 2·75 | 2·54 | 2·98 | Tegner, 2000 |
| 458280 | LZc | 1434 | 235 | 2·43 | 2·23 | 2·61 | Tegner, 2000 |
| 458285 | LZc | 1517 | 251 | 2·49 | 2·31 | 2·69 | Tegner, 2000 |
| 458287 | LZc | 1598 | 164 | 2·66 | 2·46 | 2·81 | Tegner, 2000 |
| SK84‐404 | MZ | 1739 | 306 | 2·52 | 2·33 | 2·7 | Bollingberg |
| SK84‐363 | MZ | 1865 | 271 | 2·21 | 2·06 | 2·38 | Bollingberg |
| SK84‐409 | MZ | 1936 | 186 | 2·16 | 1·95 | 2·34 | Bollingberg |
| SK84‐367 | MZ | 2063 | 152 | 2·21 | 2·07 | 2·36 | Bollingberg |
| 90/22 893.6 | UZa | 2121 | 165 | 2·05 | 1·91 | 2·19 | 90‐22 drill core |
| 90/22 769.1 | UZa | 2228 | 140 | 2·32 | 2·16 | 2·46 | 90‐22 drill core |
| 90/22 660.6 | UZa | 2322 | 304 | 1·92 | 1·8 | 2·05 | 90‐22 drill core |
| 90/22 555.5 | UZa | 2412 | 236 | 2·12 | 1·96 | 2·25 | 90‐22 drill core |
| 90/22 471.8 | UZb | 2485 | 134 | 2·16 | 1·98 | 2·33 | 90‐22 drill core |
| 90/22 450 | UZb | 2505 | 188 | 1·99 | 1·84 | 2·14 | 90‐22 drill core |
| 90/22 364.1 | UZb | 2585 | 153 | 2·39 | 2·22 | 2·56 | 90‐22 drill core |
| 90/22 270.3 | UZb | 2672 | 217 | 2·21 | 1·98 | 2·39 | 90‐22 drill core |
| SK84‐373 | UZb | 2800 | 244 | 2·19 | 2·07 | 2·32 | Bollingberg |
| 90/22 87.7 | UZb | 2841 | 284 | 2·31 | 2·15 | 2·5 | 90‐22 drill core |
| SK84‐376 | UZc | 3003 | 195 | 2·36 | 2·19 | 2·56 | Bollingberg |
| SK84‐377 | UZc | 3027 | 303 | 2·36 | 2·23 | 2·54 | Bollingberg |
The stratigraphic height is calculated using the scheme of Holness et al. (2007 b ) . n , number of single grains measured in each sample. The average apparent aspect ratio is bracketed by minimum and maximum values that are the 95% confidence intervals calculated using a bootstrap method. Tegner, 2000 refers to the reference section of surface samples collected by Christian Tegner and others in 2000 ( Tegner et al ., 2009 ). Bollingberg refers to the sample suite described by Bollingberg (1995) . (See the text for details of the sample origin and Fig. 10 for an indication of sample localities.)
The data shown in Fig. 3 c and Table 3 concern the overall, final, shape of plagioclase in the Layered Series. However, plagioclase grows in two stages, with the first being the cumulus stage, when it grows in direct contact with the bulk magma, whereas the second occurs in the mushy layer when plagioclase grows predominantly from the interstitial liquid. Dihedral angles are primarily formed during this second stage ( Holness et al. , 2012 a ). The distinction between the two growth stages can be made using plagioclase composition; in particular, the presence of compositionally distinct outer rims ( Toplis et al. , 2008 ; Humphreys, 2009 ; Namur et al. , 2014 ). Zoning is generally normal, although locally rims may have a constant composition, interpreted as a consequence of local thermal buffering during the crystallization of the interstitial liquid ( Namur et al. , 2014 ).
The variation in shape of plagioclase cumulus cores and overgrowths in thin section was examined using QEMSCAN images. Figure 14 shows images of two samples, 1 m apart, from the 1966 Cambridge drill core. The two samples are on either side of the step-change in dihedral angle at 540 m stratigraphic height attributed to the arrival of liquidus augite. Because dihedral angles are formed during the last stages of solidification, the position of the step-wise change closely approximates the stratigraphic horizon corresponding to the base of the mushy layer at the moment the bulk liquid became saturated in augite—the two samples are therefore some distance below the actual LZa–b boundary (the precise position of which is difficult to determine in the drill core; Holness et al. , 2015 ) and contain the same liquidus assemblage of olivine + plagioclase (with interstitial augite). The composition of the plagioclase primocryst cores is also the same in both. The colours in each image are graded to highlight Ca content. The core region of each plagioclase grain is shown in green, with a darker blue–green used for the rims, thus distinguishing those parts of each grain that grew close to the magma–mush interface from those that grew from interstitial liquid at deeper levels in the mush. It should be noted that no rims are present on the plagioclase where it is directly adjacent to olivine. The absence of any intercumulus overgrowth on the cumulus plagioclase here shows that the grain boundaries between the two cumulus phases (plagioclase and olivine) formed early.
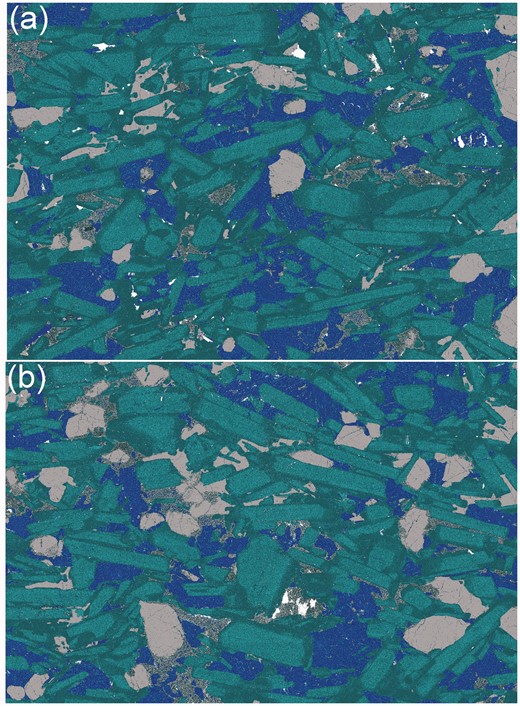
QEMSCAN images of (a) sample 320′ and (b) sample 317′ from the Cambridge drill core, with colours according to the Ca concentration. Olivine is grey and augite is bright blue. Low-Ca pyroxene (inverted pigeonite) is a mottled grey. Plagioclase grains are turquoise with dark rims. The cores of the plagioclase grains formed close to the magma–mush interface whereas the rims, of composition <An 61 , formed within the mush. It should be noted that the rims on the ends of the plagioclase laths are generally thicker in comparison with the rims on the sides of the laths in (a) compared with (b). Both images are 1 cm across.
One hundred plagioclase grains, each with a clearly defined core and rim, were measured in each sample. In the sample from 320 ft depth in the 1966 Cambridge drill core ( Fig. 14 a; Θ cpp = 85°, Holness et al. , 2007 b ) the overall AR of the entire grains (4·2 ± 0·3, based on these 100 grains) was the same as that of the inner, unzoned cores (4·1 ± 0·3), with an average apparent thickness of 70 µm of rim material grown on the (010) faces and a corresponding 290 µm of rim material on the ends of the elongate grains [although because the grains are randomly oriented this may not be representative of the average true thickness of overgrowth]. Were the core not present, this overgrowth would have created grains with an AR of 4·2. A datum representing such a hypothetical grain is shown in Fig. 9 .
In the sample from 317 ft depth in the core ( Fig. 14 b; Θ cpp = 99·5°, Holness et al. , 2007 b ), the (010) faces grew by an average of 100 µm during overgrowth in the mush whereas the ends of the elongate grains grew by an average of 180 µm (as viewed in thin section). The overall average apparent aspect ratio is significantly lower (3·8 ± 0·3) than that of the inner unzoned core (4·5 ± 0·3), whereas the overgrowth alone would create grains with AR of 1·8. A datum representing such a hypothetical grain is shown in Fig. 9 .
It should be noted that the average overall aspect ratios for the two samples plotted in Fig. 3 c are 3·64 ± 0·2 (320 ft depth in core) and 3·6 ± 0·25 (317 ft depth in core) ( Table 3 ). The difference between these values and those obtained from the QEMSCAN images is likely to be a result both of the smaller sample size of the QEMSCAN-based measurements and of only grains showing clearly defined cores and rims being measured on the QEMSCAN images—this selection is unlikely to be representative of all the grains visible in the thin section.
Dihedral angles for minerals other than clinopyroxene
At LZa times, the crystal mushy layer on the chamber floor contained up to 45 vol. % liquid ( Tegner et al. , 2009 ) that crystallized abundant interstitial augite, biotite, apatite, low-Ca pyroxene, and oxides. Biotite takes several forms: some is interstitial, with shapes controlled by growth faces of the surrounding grains, whereas some forms rims and radiating sheaves of crystals that surround oxide grains, apparently owing to some reaction between the oxide and late liquids ( Fig. 15 a). The sheaves of biotite grains cut across plagioclase, often presenting the (001) faces of the biotite to the plagioclase–plagioclase grain boundaries (thus making a dihedral angle of 180°). In contrast, the three-grain junctions formed by the growth of interstitial biotite are not dominated by the biotite (001) faces, thus creating a biotite–plagioclase–plagioclase dihedral angle population with a median value of ∼86° ± 4° in sample 118676 (290 m stratigraphic height) ( Table 4 ). The high standard deviation of 19·4° reflects the strong anisotropy of biotite interfacial energies.
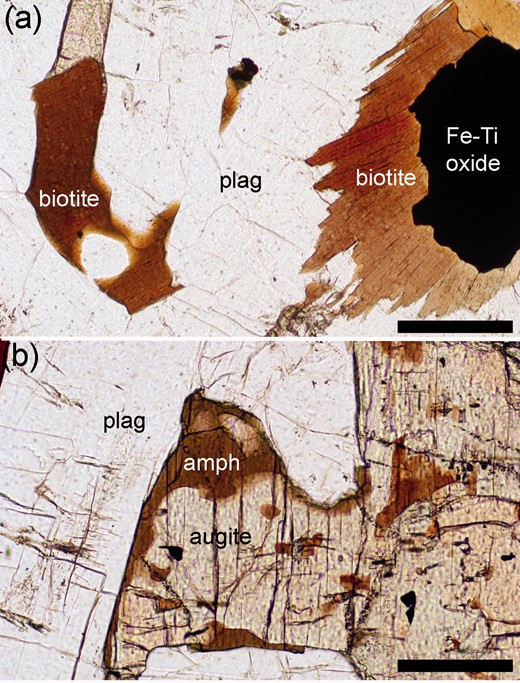
Photomicrographs in plane-polarized light of late-stage minerals in sample 118676 from the Cambridge drill core (HZ, stratigraphic height 294 m). (a) Biotite can grow either interstitially (left) or as reactive polycrystalline rims around interstitial grains of Fe–Ti oxides (right). Meaningful values of biotite–plagioclase–plagioclase dihedral angles can be measured on the former. Scale bar is 200 µm long. (b) Amphibole (amph) grows as localized replacive patches in intercumulus augite, and on the outer edges of augite grains, interpreted as topotactic overgrowths during solidification as the interstitial liquid becomes sufficiently rich in H 2 O to stabilize amphibole rather than pyroxene. Scale bar is 200 µm long.
Dihedral angle data for three-grain junctions involving two grains of plagioclase and one of another mineral phase
| Sample | Cumulus | Mineral | n | Θ xpp | SD | Skew | Reference |
|---|---|---|---|---|---|---|---|
| Skaergaard Layered Series | |||||||
| 118676 | po-C | augite | 70 | 85 ± 1·5 | 12·8 | −0·3 | Holness et al. (2007b) |
| amphibole | 50 | 85·5 ± 2 | 13·7 | −0·6 | |||
| biotite | 43 | 86 ± 4 | 19·4 | 2·1 | |||
| 118694 | po-C | augite | 60 | 85 ± 2·5 | 12·3 | −0·8 | Holness et al. (2007b) |
| amphibole | 50 | 85 ± 3 | 11·5 | 0·6 | |||
| orthopyroxene | 50 | 85·5 ± 2 | 11·2 | 0·3 | |||
| olivine | 40 | 85 ± 7 | 12·1 | 0·8 | |||
| 90‐22 429.3 | pocmia-C | augite | 50 | 83 ± 3 | 11·5 | 0·0 | Holness et al. (2007b) |
| olivine | 25 | 85 ± 5 | 18·0 | −2·1 | |||
| 90‐22 364.1 | pocmia-C | augite | 100 | 80 ± 3 | 20·0 | −0·3 | Holness et al. (2007b) |
| olivine | 26 | 82·5 ± 7 | 15·7 | −0·4 | |||
| Rum Eastern Layered Intrusion | |||||||
| R12-J5 | po-C | augite | 100 | 79 ± 4 | 23·4 | 0·1 | Holness et al. (2013a) |
| olivine | 50 | 79·5 ± 5 | 15·7 | 0·1 | Holness & Winpenny (2009) | ||
| R12-J4 | po-C | augite | 100 | 83·5 ± 4·5 | 22·5 | −0·3 | Holness et al. (2013a) |
| olivine | 50 | 82·5 ± 4 | 16·7 | −1·2 | Holness & Winpenny (2009) | ||
| 8A1 | poa-C | augite | 100 | 104 ± 2·5 | 11·7 | 0·6 | Holness (2005) |
| olivine | 50 | 103·5 ± 3·5 | 7·7 | 0·2 | |||
| 8A6 | poa-C | augite | 100 | 92 ± 2·5 | 14·8 | −0·6 | Holness (2005) |
| olivine | 40 | 92 ± 3 | 11·3 | 0·7 | |||
| Bushveld Complex Upper Zone | |||||||
| 3 W 300 | pocmi-C | augite | 100 | 91 ± 2·5 | 8·8 | 0·1 | Holness et al. (2013a) |
| olivine | 50 | 91·5 ± 2 | 7·6 | 0·1 | |||
| 1 W 1423.4 | pocmia-C | augite | 60 | 96 ± 1·5 | 10·4 | −0·9 | Holness et al. (2013a) |
| olivine | 50 | 95·5 ± 2·5 | 10·9 | −0·7 | |||
| 1 W 446.6 | pocmia-C | augite | 40 | 97 + 2·5 | 13·5 | −2·1 | |
| amphibole | 30 | 77·5 ± 5 | 14·0 | −0·3 | |||
| 1 W 441.4 | pocmia-C | augite | 40 | 98 ± 3 | 10·3 | −0·2 | |
| amphibole | 60 | 78 ± 4 | 17·5 | −0·4 | |||
| quartz | 40 | 70·5 ± 10 | 26·1 | 0·2 | |||
| 1 W 426.0 | pocmia-C | augite | 40 | 95 ± 3 | 10·6 | 0·6 | |
| olivine | 35 | 96·5 ± 5 | 12·4 | 0·9 | |||
| amphibole | 50 | 77 ± 3 | 16·2 | −0·2 | |||
| Sept Iles Megacyclic Unit I | |||||||
| DC99‐2382.5 | po-C | augite | 50 | 83 ± 2 | 13·0 | −0·8 | Holness et al. (2013a) |
| orthopyroxene | 33 | 84 ± 3 | 13·9 | −0·1 | |||
| amphibole | 50 | 98·5 ± 5 | 14·3 | −0·9 | |||
| olivine | 50 | 96·5 ± 4·5 | 13·3 | −0·1 | |||
| DC99‐2363.5 | po-C | augite | 50 | 85·5 ± 2·5 | 12·7 | 0·6 | Holness et al. (2013a) |
| amphibole | 50 | 98·5 ± 4 | 13·0 | 0·5 | |||
| olivine | 40 | 102 ± 3 | 12·6 | 0·6 | |||
| DC99‐1833.5 | pomi-C | augite | 50 | 93 ± 1·5 | 7·3 | 0·2 | Holness et al. (2013a) |
| amphibole | 49 | 98 ± 5 | 12·7 | −0·3 | |||
| olivine | 50 | 100 ± 2·5 | 11·6 | −0·3 | |||
| DC99‐1081 | pmic-C | augite | 50 | 99 ± 3 | 12·7 | −1·8 | Holness et al. (2013a) |
| olivine | 40 | 100 ± 2·5 | 12·4 | 0·3 | |||
| DC99‐740.5 | pmic-C | augite | 41 | 97 ± 3 | 10·3 | 0·8 | |
| olivine | 40 | 98 ± 3 | 7·9 | −0·3 | |||
The cumulus assemblage is given following Irvine (1982). n , number of single measurements; uncertainty on the median angle, Θ xpp , is the 2σ confidence interval calculated according to Stickels & Hücke (1964) ; SD, standard deviation of the population. The final column gives the first published reference to Θ cpp in the sample. The stratigraphic position of the four Skaergaard samples is shown in Fig. 3 a.
Amphibole forms patchy replacement of interstitial augite, and also grows instead of augite during the last stages of primary solidification ( Fig. 15 b), presumably as the interstitial liquid becomes sufficiently enriched in H 2 O to permit amphibole to crystallize instead of pyroxene. The resultant amphibole–plagioclase–plagioclase dihedral angles form a population with a median of ∼85·5° ± 2°. In 118676, Θ cpp is 85° ± 1·5°, the same as those angles measured for biotite and amphibole. A further sample from LZa, 118694 (200 m stratigraphic height) shows a similar pattern, with identical median values of dihedral angle for augite, amphibole, orthopyroxene (inverted pigeonite) and olivine forming junctions with plagioclase grains. Two samples from UZb macro-dolerites were also investigated, and in both the olivine–plagioclase–plagioclase dihedral angle population is indistinguishable from that of augite–plagioclase–plagioclase ( Table 4 ).
The Eastern Layered Intrusion, Rum
The Eastern Layered Intrusion of the Rum Igneous Complex formed in a sub-volcanic magma chamber that experienced multiple episodes of magma replenishment and eruption ( Renner & Palacz, 1987 ; Emeleus et al. , 1996 ; Holness & Winpenny, 2009 ). The cumulate pile is formed of alternating layers of olivine cumulates and plagioclase-bearing cumulates. For this study two samples were chosen of troctolitic cumulates [plagioclase and olivine on the liquidus; the samples are from Traverse J of Holness & Winpenny (2009) and Θ cpp has previously been reported by Holness et al. (2013a) ], and two of olivine gabbroic cumulates [with augite as an additional cumulus phase; the samples are from the top of Traverse i of Holness (2005) ].
The troctolitic allivalites contain primocrysts of olivine and plagioclase. Neither mineral has significant compositional zoning. Minor primocrystic Cr-spinel may be present. Minor interstitial augite forms thin monocrystalline rims around olivine primocrysts. The gabbroic allivalites contain equant primocrysts of augite in addition to olivine and plagioclase. Both the troctolites and gabbros are close to adcumulate, with almost no interstitial minerals that might have grown from evolved liquid. Augite–plagioclase grain boundaries are generally curved (denoting simultaneous growth of the two phases), often with some asymmetry at the junction itself.
In the two troctolites, the augite–plagioclase–plagioclase dihedral angle population is indistinguishable from the olivine–plagioclase–plagioclase dihedral angle population, despite augite being intercumulus (with a mode < 10 vol. %) and olivine having cumulus status ( Table 4 ). In each sample the dihedral angle was measured at both augite–plagioclase–plagioclase junctions (i.e. the mafic phase is intercumulus) and olivine–plagioclase–plagioclase junctions (i.e. the mafic phase is cumulus). In the two gabbros (in which both augite and olivine are cumulus), the olivine–plagioclase–plagioclase dihedral angle population is again indistinguishable from that at augite–plagioclase–plagioclase junctions. In sample 8A1, from immediately below an intrusive peridotite body ( Holness, 2005 ), the two median angles are 103·5° ± 3·5° and 104° ± 2·5°, whereas those from 8A6, collected far from the intrusive peridotite, are both 92° with 95% confidence limits of 2·5° and 3° respectively ( Table 4 ).
The Upper Zone of the Bushveld Complex, South Africa
The Upper Zone of the Bushveld Complex, sampled for this study by two of the three Bierkraal drill cores, formed from a single, fractionating, body of magma ( von Gruenewaldt, 1973 ; Molyneux, 1974 ; Kruger et al. , 1987 ), with the liquidus assemblage of the lowermost cumulates comprising plagioclase, augite and low-Ca pyroxene (hypersthene), with interstitial Fe–Ti oxides, biotite and minor quartz. The arrival of Fe–Ti oxides as a cumulus phase is marked by a significant increase in the Fe–Ti oxide mode and a step-wise change in Θ cpp ( Holness et al. , 2013 a ). Higher in the stratigraphy, the arrival of cumulus olivine is associated with the gradual loss of orthopyroxene (which it replaces), resulting in an unchanging value of Θ cpp . The last phase to arrive is apatite ( Tegner et al. , 2006 ), although the presence of cumulus apatite is cyclical ( Cawthorn & Walsh, 1988 ; Tegner et al. , 2006 ) and is associated with a bimodal variation of Θ cpp ( Holness et al. , 2013 a ).
The most highly evolved rocks sampled by the Bierkraal drill cores are ferrodiorites typified by a cumulus assemblage of plagioclase (An 43 ), fayalitic olivine, ferro-augite, Fe-Ti oxides and apatite, with abundant oikocrystic amphibole ( Fig. 16 a) and biotite [see Tegner et al. (2006) for mineral compositions]. The augite commonly contains abundant and irregular patches replaced by brown amphibole ( Fig. 16 a and b). K-feldspar and quartz form large interstitial grains generally enclosing rounded grains of cumulus plagioclase ( Fig. 16 c and d). The three-grain junctions formed by the three late-stage phases (amphibole, K-feldspar and quartz) are generally typified by straight grain boundaries and a consequently low median angle ( Fig. 16 d and e), in contrast to the curved boundaries at augite– (and olivine)–plagioclase–plagioclase junctions ( Fig. 16 b).
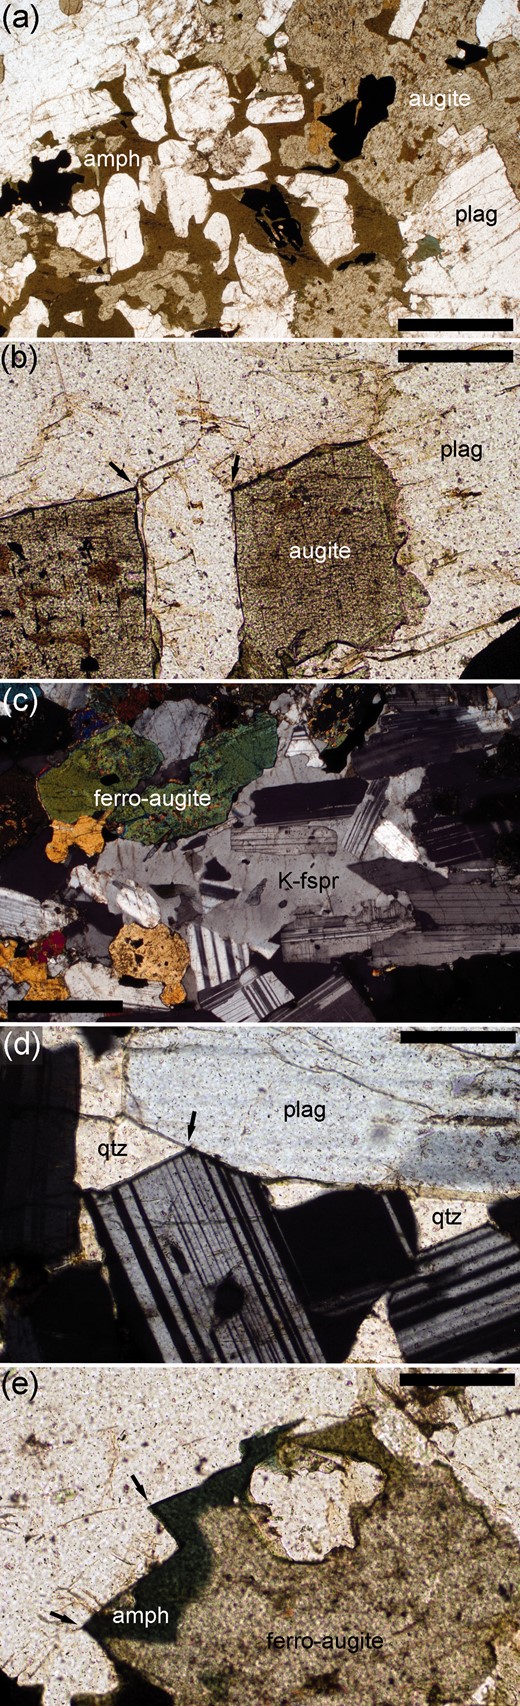
Photomicrographs of cumulates from the Upper Zone of the Bushveld Intrusion, (a) Sample 1 W 446.6 showing cumulus augite, plagioclase and Fe–Ti oxides, with oikocrysts of late-stage brown amphibole. Plane-polarized light. Scale bar is 1 mm long. (b) Sample 1 W 441.4 showing patchy amphibole replacement in the augite. The rounded junctions with adjacent plagioclase (arrowed), denoting a high value of Θ cpp (98° ± 3°), should be noted. Scale bar is 200 µm long. (c) Sample 1 W 426.0 showing a large oikocryst of K-feldspar (K-fspr) enclosing plagioclase. Scale bar is 1 mm long. (d) Sample 1 W 426.0 with pockets of interstitial quartz bounded by planar plagioclase grains consistent with no overgrowth of the plagioclase walls (compare Fig. 11 f). The arrow shows a quartz–plagioclase–plagioclase junction formed of straight quartz–plagioclase grain boundaries. Scale bar is 200 µm long. (e) Sample 1 W 441.4 showing overgrowth of green amphibole on cumulus augite. The arrows show three-grain junctions formed of straight amphibole–plagioclase grain boundaries, resulting in a low dihedral angle (median value 78° ± 4°). Scale bar is 200 µm long.
Dihedral angles for augite–plagioclase–plagioclase junctions in samples 3 W 300 (from 300 m depth in drill core 3) and 1 W 1423.4 (from 1423·4 m depth in drill core 1) have been previously presented by Holness et al. (2013 a ) . For the present study these data were augmented by measurements of olivine–plagioclase–plagioclase angles in the two samples (olivine is a cumulus phase in both): for both, the olivine angle is indistinguishable from that for coexisting augite ( Table 4 ).
For comparison with the most evolved rocks of the Skaergaard Layered Series the dihedral angle populations were investigated in three samples from the very topmost rocks of the Bushveld Upper Zone as sampled by the Bierkraal drill cores. Dihedral angles were measured for cumulus augite in each, with that for cumulus olivine in 1 W 426.0 and interstitial amphibole ( Fig. 16 e) and quartz for 1 W 441.4 (from 441·4 m depth in drill core 1) and 1 W 426.0 (from 426 m depth in drill core 1). Whereas the angle population for olivine is indistinguishable from that of coexisting augite, the median angles for the two late-stage minerals are significantly lower ( Table 4 ; it should be noted that the very high standard deviation of the quartz–plagioclase–plagioclase population, together with the relatively small number of angles, means that the 95% confidence intervals about the median are large).
The Sept Iles Intrusion, Quebec
The lower part of the Layered Series of the Sept Iles Intrusion of Quebec formed from a single batch of fractionating magma, creating a series of progressively more fractionated cumulates denoted Megacyclic Unit I (MCU-I) ( Namur et al. , 2010 , 2011 ). The lowermost part of this sequence has only plagioclase and olivine as cumulus phases, with the sequential addition of Fe–Ti oxides and augite. Further fractionation led to the loss of olivine (with no corresponding arrival of low-Ca pyroxene) with its reappearance, together with apatite, at the top of the sequence. Θ cpp variation through this sequence of cumulates has been reported by Holness et al. (2013a) .
The cumulates from the lowest part of MCU-I contain cumulus plagioclase and olivine only, with interstitial augite, orthopyroxene, oxides, biotite, apatite and amphibole. Augite and the orthopyroxene form cuspate grains in plagioclase-rich areas and rims around cumulus olivine. The orthopyroxene is likely to have formed by reaction between cumulus olivine and interstitial liquid, as the orthopyroxene rims commonly form intergrowths with Fe–Ti oxides in embayments in the olivine grains ( Fig. 17 a and b). The interstitial amphibole is replacive, affecting both augite and orthopyroxene ( Fig. 17 c): the replacement is most pronounced at the outside of the pyroxene rims surrounding cumulus olivine, with common complete replacement to form thick amphibole rims. Dihedral angles were measured in two samples (DC99‐2382.5 and DC99‐2363.5) with cumulus plagioclase and olivine. The dihedral angle populations for the two pyroxenes in each sample are indistinguishable, whereas those for both olivine and amphibole are significantly higher ( Fig. 17 d, Table 4 ). In both samples the 2σ confidence intervals on the median amphibole–plagioclase–plagioclase dihedral angle are relatively large ( Table 4 ), attesting to highly variable junction geometry.
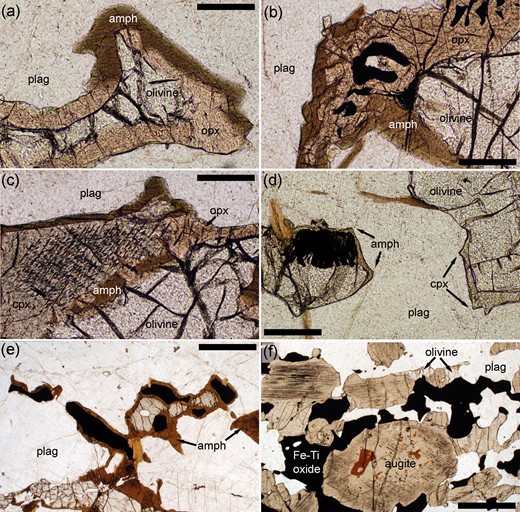
Photomicrographs of microstructures in MCU-I of the Sept Iles Intrusion. (a) Sample 9‐2382.5, containing cumulus plagioclase and olivine. The olivine grain is embayed and surrounded by orthopyroxene, suggestive of a reaction relationship between cumulus olivine and interstitial liquid. The later replacement of the orthopyroxene by amphibole should be noted. Plane-polarized light. Scale bar is 200 µm long. (b) Sample 9‐2363.5, with a cumulus assemblage of olivine and plagioclase. The olivine has been partly replaced by orthopyroxene, locally in a symplectic intergrowth with Fe–Ti oxides. This intergrowth is locally replaced by amphibole. Plane-polarized light. Scale bar is 200 µm long. (c) Sample 2363.5 showing olivine surrounded by orthopyroxene and augite, with both pyroxenes being replaced by amphibole. Plane-polarized light. Scale bar is 200 µm long. (d) Sample 9‐2382.5 showing the contrast in dihedral angle between the amphibole–plagioclase–plagioclase junctions (high dihedral angle, arrowed on the left) and augite–plagioclase–plagioclase dihedral angles (arrowed on the right). The partial replacement of the olivine grain on the left by an intergrowth of orthopyroxene and Fe–Ti oxides should be noted. Data for this sample are in Table 3 . Plane-polarized light. Scale bar is 1 mm long. (e) Sample 9‐1833.5 with a cumulus assemblage of plagioclase, olivine and Fe–Ti oxides. Cumulus grains of olivine and Fe–Ti oxides are enclosed by a thick rim of late-stage amphibole. Plane-polarized light. Scale bar is 1 mm long. (f) Sample 9‐1081 with a cumulus assemblage of plagioclase, Fe–Ti oxides and augite. The localized internal replacement of cumulus augite by amphibole should be noted. Intercumulus olivine is present as irregular patches and rims. Plane-polarized light. Scale bar is 1 mm long.
Further up the stratigraphy, progressive fractionation leads to the saturation of the liquid with Fe–Ti oxides, which form abundant rounded grains. Interstitial pyroxene is locally replaced by brown amphibole, which may form extensive rims and patches surrounding cumulus oxide and olivine grains ( Fig. 17 e). The median dihedral angle at olivine– and amphibole–plagioclase–plagioclase junctions is higher than that at augite–plagioclase–plagioclase junctions ( Table 4 ), similar to the lowest cumulates. The mode of the replacive amphibole decreases up-section: it is uncommon by the point at which the bulk liquid became saturated in augite, probably owing to decreasing amounts of residual liquid in the cumulates ( Namur & Charlier, 2012 ).
The arrival of cumulus augite is marked by a change in morphology and an increase in mode, together with the disappearance of interstitial orthopyroxene. Augite now forms large grains, with local internal replacement by brown amphibole ( Fig. 17 f): there is no longer any evidence for extensive late-stage reaction and replacement. Dihedral angles were measured in two samples from cumulates in which olivine was no longer a cumulus phase. In these rocks olivine tends to grow as extensive rims around oxides ( Fig. 17 f). In both samples (DC99‐1081 and DC99‐740.5) the median dihedral angles for olivine and augite are indistinguishable ( Table 4 ).
DISCUSSION
Effect on dihedral angle of replacing augite with other minerals
In the Skaergaard and Rum intrusions, and in the lower parts of the Bushveld Upper Zone, the dihedral angle at junctions formed by two grain of plagioclase and one grain of another mineral is the same for all minerals in the rock, regardless of the nature of the mafic mineral forming the three-grain junction (ignoring instances where highly anisotropic phases such as biotite and apatite locally grow with highly prominent planar faces), and regardless of whether that phase is interstitial or cumulus. This supports the earlier finding of Holness et al. (2012 b ) that the dihedral angle populations are the same for monoclinic Ca-rich and orthorhombic Ca-poor pyroxene in the Basement Sill, and that of Holness et al. (2013 a ) that pyroxene composition and structure does not affect three-grain junction geometry in the lower parts of the Sept Iles Intrusion. These results support the hypothesis that whatever is controlling the geometry of three-grain junctions is primarily affecting plagioclase. There are, however, notable exceptions to this, and these are found in the most evolved parts of the Bushveld Upper Zone and in the lower parts of Sept Iles MCU-I.
In contrast to the amphibole observed in the Skaergaard Intrusion, which crystallizes locally instead of augite during the last stages of solidification, the Sept Iles amphibole is replacive after original pyroxene ( Fig. 17 b). Although it most probably crystallized from a silicate liquid (rather than being a result of post-solidification metasomatism) its replacive relationship with the augite shows that it did not grow simultaneously with the adjacent plagioclase. The median amphibole–plagioclase–plagioclase dihedral angles are the same in the three samples investigated here, and have a generally wide range in any one sample, leading to 2σ confidence intervals of the order 5° (the measurement population is not sufficiently large to determine the standard deviation with much accuracy). I suggest that the higher median and greater spread of angles, compared with augite, show that the two types of three-grain junction are not equivalent in terms of formation processes, and thus cannot be directly compared.
The olivine–plagioclase–plagioclase junctions in the Sept Iles MCU-I cumulates are not so straightforward to explain. They have an unchanging geometry through the stratigraphy, with higher median angles than augite–plagioclase–plagioclase junctions in the lower parts of MCU-I, but with the same median as the augite junctions in the upper parts ( Table 3 ). Olivine is cumulus, but is locally resorbed in the lower parts of the stratigraphy. Interestingly, the Skaergaard olivines also show evidence for localized reaction with late liquids, resulting in partial replacement by orthopyroxene and Fe–Ti oxides ( Holness et al. , 2011 ), but in the case of Skaergaard this does not result in a median dihedral angle different from that of augite junctions. The similarity of olivine–plagioclase–plagioclase junctions to augite–plagioclase–plagioclase junctions in the Skaergaard, Bushveld and Rum intrusions is consistent with the former being generally subject to the same controls as the latter, suggesting that there is something unusual about the olivine–plagioclase–plagioclase junctions in the lower part of MCU-I. They have perhaps been affected by the late-stage reactions that resulted in amphibole growth.
The amphibole and quartz in the upper part of the Bushveld Upper Zone are primary, but late-crystallizing, magmatic minerals, with no microstructural evidence for reaction with earlier-crystallizing minerals. Both have significantly lower median dihedral angles compared with augite. Importantly, these low angles are caused by an absence of plagioclase growth at the three-grain junctions ( Fig. 16 d and e), which are formed by generally straight grain boundaries, in contrast to the rounded boundaries caused by plagioclase growth at junctions with augite. Amphibole and quartz (and K-feldspar) were the last-crystallizing major phases in these ferro-gabbros and it seems that plagioclase had simply ceased to grow from the highly evolved liquid present during the last stages of solidification—it was not a major part of the mineral assemblage at the time of amphibole, quartz and K-feldspar crystallization.
In conclusion, for minerals growing simultaneously with plagioclase, the dihedral angle populations formed at junctions between two grains of plagioclase and one of the other mineral are the same, regardless of whether the second mineral is cumulus or interstitial. The exceptions to this rule are replacive minerals that grew by late-stage reactions, and minerals that grew from highly evolved late-stage liquids from which plagioclase was not growing in significant volumes.
Correlations between plagioclase grain shape and dihedral angles
The observations presented above therefore support the hypothesis that dihedral angles are primarily controlled by the behavior of plagioclase (010) growth faces. At first sight, one might conclude that for this to be true there necessarily must always be a direct correlation between plagioclase grain shape and dihedral angle in those gabbros and dolerites that have not undergone sub-solidus textural equilibration. Although there is certainly a first-order correlation between the two in sills and lava lakes ( Fig. 9 ), there is no direct correlation at sill margins, and no relationship between overall plagioclase grain shape and Θ cpp in the Skaergaard Layered Series ( Fig. 3 ).
The margins of sills and lava lakes
In the absence of significant sub-solidus textural equilibration, Θ cpp in essentially unfractionated bodies maps closely onto the expected crystallization time. In contrast, AR variation forms an M-shaped profile ( Fig. 5 ), which means that the margins of these bodies have lower AR than expected for their (calculated) cooling rate and observed Θ cpp .
Holness (2014) suggested that AR is affected by the nucleation density and the timing of impingement of the growing plagioclase grains: early impingement of the highly platy grains in the rapidly cooled sill margins results in significant growth on the (010) faces and a reduction in AR as solidification proceeds. A direct correlation between AR and Θ cpp at sill margins would necessitate this growth on the (010) faces to be achieved by an absolute increase in the (010) growth rate to produce the high Θ cpp expected for the low AR, but the absence of a direct correlation suggests instead that the absolute growth rate of the (010) faces does not increase. The reduction in growth of the (100) and (001) faces caused by early grain impingement is clearly not sufficient to increase undercooling and hence affect the growth rate of the (010) faces.
A further factor resulting in the decoupling of AR and Θ cpp occurs at the margins of thicker sills, where significant sub-solidus textural equilibration of fine-grained chill zones results in an increase of dihedral angles. The increase of Θ cpp occurs on a much shorter time-scale than that required to affect the overall shape of plagioclase grains, destroying any potential relationship between the two.
Decoupling of plagioclase grain shape and Θ cpp in layered intrusions
Although the evidence that dihedral angle geometry is controlled by the growth kinetics of plagioclase predominantly comes from close observation of three-grain junction geometry in gabbros (e.g. Fig. 4 ), there is no link between overall plagioclase grain shape and Θ cpp in the Skaergaard Intrusion. There is, however, an apparent link between the shape of the overgrowth and Θ cpp ( Fig. 9 ).
The crystals that form the floor cumulates of large layered intrusions are likely to have grown in a range of environments, with crystals that nucleated and grew in situ on the chamber floor joined by those that nucleated and grew on its walls and roof, or were added to the chamber by replenishing magmas. Furthermore, the cumulus grains have undergone growth in two very different environments, the first at, or close to, the magma–mush interface, and the second within the mush under fluid-poor conditions. Given this complexity, it is perhaps surprising that the stratigraphic variation of AR in the Skaergaard Layered Series is as robust as it appears in Fig. 3 c, with reproducible results for stratigraphically equivalent samples with significant lateral separation ( Table 3 ), and a generally narrow range of values for adjacent samples. The simplest conclusion one can make from this uniformity of AR is that the chamber was well mixed, with either similar cooling rates across the chamber (at least on the length-scales of sample separation; Fig. 10 ) or the homogeneous redistribution of crystals grown under slightly different conditions.
The general pattern of AR variation in the 3 km of cumulates is similar to that seen in (much thinner) sills, with a well-defined reduction from the middle part of LZb towards the base, creating a broad but incomplete M-shaped profile. One might expect that AR in the UBS, the roof sequence overlying the floor cumulates analysed here, would continue the upwards trajectory from the minimum value at ∼2300 m stratigraphic height, with a marginal reduction at the roof contact. The position of the minimum value of AR well above the mid-point of the entire intrusion’s thickness, most probably corresponding to the level at which crystallization occurred at the slowest rate, is consistent with the great bulk of crystals ending up on the chamber floor—UZb cooled faster than UZa because of the increasing proximity of the chamber roof. The position of minimum AR, and hence the slowest rate of plagioclase crystallization, at 2300 m stratigraphic height is also consistent with the evidence from the contact aureole, which points to the greatest release of latent heat of crystallization near the Sandwich Horizon ( Norton & Taylor, 1979 ; Manning et al. , 1993 ; Bufe et al. , 2014 ).
The abrupt reduction in AR at ∼1170 m stratigraphic height ( Fig. 3 c) is a feature not observed in sills. It is associated with the appearance of abundant deformed plagioclase ( Fig. 13 ). This point in the stratigraphy is somewhat higher than the abrupt reduction that occurs between 754 and 837 m height [using the Holness et al. (2007b) stratigraphic scale] in the amount of trapped liquid, calculated by Tegner et al. (2009) from bulk-rock P 2 O 5 concentrations. The reduction in bulk-rock P 2 O 5 concentration is most plausibly attributed to the onset of efficient loss of interstitial liquid, perhaps by an abrupt increase in the efficiency of gravitationally driven compaction. The change in plagioclase grain shape, as measured by the reduction in AR at ∼1170 m, suggests that, at the point in the intrusion’s history marked by this horizon, the cooling rate had reduced sufficiently for plagioclase to begin to respond to gravitationally driven compaction by bending and recrystallizing, rather than by mechanical rearrangement of essentially undeformed grains. At least some of the AR signature from this point is therefore affected by recrystallization of primocrysts. This is unlikely to have had any effect on Θ cpp , however, as any such recrystallization is likely to have occurred while there was still abundant liquid present.
Although the details of the changing plagioclase grain shape (as measured in thin section) are worthy of further study and refinement, the data presented in Fig. 3 c are sufficient to demonstrate that the overall stratigraphic variation of AR is essentially that expected for a large intrusion for which the rate of heat loss is governed by the thermal conductivity of the country rocks. The relevance of these data to understanding the variation of Θ cpp lies in the difference between AR determined from the overall shape of plagioclase grains and that determined from the shape of the plagioclase grain cores ( Fig. 14 ). The overall grain shape is an integral of growth at, or close to, the magma–mush interface and growth within the mushy layer. The first stage generally dominates the overall shape, as is clear from Fig. 14 . However, it is the second stage of growth, within the mushy layer, that controls Θ cpp . The two samples on either side of the step-wise increase of Θ cpp associated with the arrival of liquidus augite demonstrate this clearly ( Fig. 14 ). The sample with low Θ cpp (320′, Fig. 14 a) has significantly more overgrowth in directions parallel to the (010) faces than the sample with high Θ cpp (317′, Fig. 14 b). If the overgrowth alone is considered, there is an excellent correlation between AR and Θ cpp of these two samples and the data collected from the sills and lava lakes ( Fig. 9 ). The step-wise increase in Θ cpp at this stratigraphic level is thus linked to an increase in the rate of growth of the (010) faces and, by comparison with the sills, to an increase in the time taken to fully solidify. What this means is that the step-wise changes in crystallization time associated with the changing number of liquidus phases, and manifest by a step-wise change in Θ cpp , are recorded in the changing shape of the interstitial overgrowths on cumulus plagioclase grains and not by the overall shape of the plagioclase in the fully solidified gabbro.
The corollary is that Θ cpp is controlled by the thermal history on a different length-scale from that of the entire intrusion. The intrusion as a whole cools at a rate determined by the difference in temperature between it and its surroundings, together with the conductivity of its surroundings, and this cooling history is recorded in the smoothly changing overall shape of the cumulus plagioclase in the floor cumulates ( Fig. 3 c). The growth behavior of plagioclase within the lower parts of the mushy layer, where dihedral angles are forming, changes in a step-wise manner in response to step-wise changes in the enthalpy budget in the immediate environment—this is essentially the ‘latent heat hump’ of Morse (1986) , where the thermal profile at the chamber floor is determined by the latent heat release where most of the crystallization is happening.
Recent work on plagioclase in the Skaergaard Layered Series has shown that overgrowth rims of constant composition form during localized thermal buffering by crystallization of the interstitial liquid, with step-wise compositional changes corresponding to the saturation of the interstitial liquid in an additional mineral ( Namur et al. , 2014 ). In contrast, dihedral angles respond to the liquidus assemblage of the bulk magma. Thus a gabbro from LZa will have a dihedral angle corresponding to thermal buffering by the assemblage olivine + plagioclase, but will contain plagioclase with rims buffered by the interstitial assemblage olivine + plagioclase + augite. Similarly, an LZc gabbro will have a dihedral angle corresponding to buffering by the assemblage olivine + plagioclase + augite + oxides, whereas any plagioclase rims present would be buffered by an apatite-bearing assemblage. That the dihedral angles are not apparently affected by localized thermal buffering by the interstitial liquid suggests that it provides only a small component to the overall thermal budget in the crystal mush.
The macro-dolerite microstructure
The uppermost rocks of the Skaergaard Layered Series, display a significant decoupling between Θ cpp and the liquidus phase assemblage. Θ cpp is reduced despite there being no change in the number of phases on the liquidus of the bulk magma, and low AR ( Fig. 3 c) consistent with slow cooling rates. In detail, this reduction happens twice in drill core 90‐22, both below the arrival of cumulus apatite and above ( Fig. 12 ). This reduction of Θ cpp (and of dihedral angles at all three-grain junctions involving two plagioclase grains; Table 4 ) is caused by the essentially complete cessation of plagioclase growth from the last liquids present near the base of the mush, as shown by the planar plagioclase grains bounding the pockets of granophyre, with little evidence of overgrowth from the interstitial liquid ( Figs 4 b, c and 11d). Plagioclase is clearly not a volumetrically significant crystallizing phase in the late-stage liquid in these rocks. By comparison with the highly evolved rocks of the Bushveld Upper Zone, I suggest that the macro-dolerite microstructure results when the late-stage, highly evolved, interstitial liquid reaches a composition that cannot crystallize significant quantities of plagioclase.
The bulk magma from which the Sandwich Horizon primocrysts grew (i.e. the most evolved bulk liquid composition) was evidently saturated in plagioclase, as this mineral forms up to 30 vol. % of the primocryst assemblage. However, dihedral angles form during the last stages of crystallization in the mushy layer, from a more highly evolved liquid than that present above the magma–mush interface. We therefore need to know the composition of the late-stage, evolved, interstitial liquids in the UZ and the Sandwich Horizon. An indication of the composition of such a liquid is given by the interstitial minerals and microstructures preserved in the UZ, the Sandwich Horizon and the lowermost rocks of the UBS [into which late-stage liquids formed in the underlying Sandwich Horizon are likely to have migrated ( McBirney, 2002 )].
In the lower parts of the UZ, the interstitial liquid is likely to have been in the two-phase field, comprising immiscible Si- and Fe-rich conjugate liquids, now represented by coexisting pockets of granophyre (comprising K-feldspar and quartz) and ilmenite-rich intergrowths ( Fig. 11 ). The upwards-decreasing abundance of ilmenite-rich intergrowths, and their absence in the upper parts of the UZ, suggests that the Fe-rich conjugate was an insignificant (or absent) component of the interstitial liquid by UZc, consistent with an overall evolution towards Si-enrichment, or the departure of the liquid from the two-liquid field in late-stage interstitial liquids. Primary magmatic aqueous fluid inclusions are ubiquitous in the intrusion ( Larsen et al. , 1992 ) and it is therefore likely that the late-stage interstitial liquid in UZa and UZb was hydrous. Plagioclase crystallization may have been suppressed in the highly evolved, relatively hydrous and potassic liquid present during the last stages of solidification, when only a few volume per cent melt remained (e.g. Botcharnikov et al. , 2008 ).
Macro-dolerite microstructures are also present immediately below the UZa–b boundary ( Fig. 12 ). By comparing the highly evolved rocks from the Bushveld Upper Zone with Skaergaard UZb, one can speculate that the observed gradual reduction in Θ cpp from ∼600 m to ∼480 m depth in the core may be a result of the interstitial liquid deep in the mush becoming increasingly evolved, with an associated reduction in the amount of plagioclase that it crystallizes. The importance of such an effect is likely to be greatest in mush in which interstitial liquid is efficiently expelled, as the bulk of liquid lost in this way occurs high in the mushy layer, leading to a generally more highly evolved composition of the remaining liquid.
Late-stage plagioclase growth increases markedly, with an abrupt increase in Θ cpp when the bulk liquid saturates in apatite. An expected consequence of the addition of a phase to the liquidus assemblage is an increase in crystal productivity ( Ghiorso, 1997 ; Holness et al. , 2007 b ; Morse, 2011 ). It is possible that this would lead to a decreased permeability of the mushy layer and thus an increase in the amount of interstitial liquid. An increase in the amount of interstitial liquid would result in a less evolved average composition of the liquid from which augite–plagioclase–plagioclase junctions form (as liquid expulsion generally occurs early, and therefore preferentially affects the relatively unevolved liquid) and therefore permit plagioclase crystallization at the three-grain junctions. This is effective over only a limited stratigraphic range, as the composition of the bulk liquid in the magma chamber, and hence the composition of the liquid in the mush, becomes increasingly evolved with stratigraphic height. By ∼450 m depth in core 90‐22 the interstitial liquid is clearly unable to generate significant plagioclase growth while three-grain junctions are forming.
For a mush in which the interstitial liquid close to the magma–mush interface has a composition close to that from which plagioclase will not grow, one might expect the early formed minerals to have high dihedral angles, with the later-forming minerals growing at a time when the interstitial liquid had evolved sufficiently to suppress further plagioclase crystallization. This is observed in the Bushveld UZ, where augite–plagioclase–plagioclase junctions display curved boundaries indicative of continued plagioclase growth, while the later-crystallizing amphibole–plagioclase–plagioclase junctions do not. Another example of this is provided by apatite, the last major phase to crystallize from the Skaergaard liquid. Apatite is an interstitial phase in the Skaergaard LZ and commonly forms strikingly anhedral grains below 754 m stratigraphic height, indicating that it crystallized from interstitial liquid that had, at least locally, reached a composition that could no longer crystallize plagioclase in significant quantities ( Holness et al. , 2013 a ). This anhedral habit of the interstitial apatite is no longer seen above 754 m height (with the exception of the macro-dolerite zone at the top of UZa). The change in habit from anhedral to euhedral corresponds to the major, apparently step-wise, reduction in the calculated amount of residual liquid in the mush ( Tegner et al. , 2009 ). I suggest that an anhedral habit of interstitial apatite results when there is sufficient liquid in the mush to allow the development of pockets of highly evolved hydrous, granophyric liquids in the very last stages of solidification, with the consequent local suppression of plagioclase growth resulting in the filling of remaining pore space by anhedral apatite (e.g. Holness et al. , 2013 a ).
Stratigraphic variation in the spread of disequilibrium dihedral angle populations in the Skaergaard Layered Series
Figure 3 b shows that the standard deviation of the population of disequilibrium augite–plagioclase–plagioclase dihedral angles is high at the base of the Layered Series, with a decrease to lower and approximately constant values through HZ, LZa and into LZb. Standard deviation increases abruptly in UZb to values typical of those formed by random impingement ( Holness et al. , 2012 b ), corresponding to the development of the macro-dolerite microstructure and the cessation of plagioclase growth during the formation of the three-grain junctions.
We can understand the stratigraphic variation of standard deviation below UZ by examining the behavior of single junctions as recorded by the ‘before’ and ‘after’ dihedral angle populations in the Portal Peak sample 87‐110 ( Fig. 8 ). In this sample, those dihedral angles formed at junctions created by the low-angle impingement of two plagioclase grains are incommensurately wider than those dihedral angles formed at junctions created by relatively high-angle impingement. Dihedral angles formed where two plagioclase grains have impinged at a high angle are lower than the original impingement angle. What this shows is that there is significantly more outwards growth of the (010) plagioclase growth faces in the narrower pores compared with the wider pores. This is most probably due to the effects of pore size on growth rates: at any given undercooling flat interfaces can grow more rapidly than curved interfaces ( Cahn, 1980 ; Scherer, 1999 ). The plagioclase–melt interfaces bounding the pore at the nascent three-grain junction are generally flat, whereas the augite–melt interface is more rounded, with a radius of curvature that decreases with a decreasing angle of impingement of the plagioclase (compare the geometry of the pore walls shown in Fig. 6 ). This means that augite growth is inhibited in the narrower pores, whereas that of the plagioclase is unchanged (ignoring the effects of mass transport limitations in the narrowest pores, which should affect both phases equally). This provides a mechanism whereby the narrower pores result in incommensurately greater final dihedral angles than the wider pores, leading to not only a higher Θ cpp , but also a lower standard deviation of augite–plagioclase–plagioclase angles, compared with the original population of impingement angles.
Such an effect of surface curvature on the relative growth rates of augite and plagioclase as a function of pore width, superimposed on the first-order control on Θ cpp by the rate of growth of (010) faces, will be controlled by the global cooling rate. At greater global cooling rates and hence undercoolings, the effect will be least but, as the country rocks warm up and the global cooling rate of the intrusion decreases, the undercooling will also decrease, leading to an increase in the importance of this effect. This is consistent with the gradual reduction of standard deviation upwards through the Layered Series. It also explains why the standard deviation of augite–plagioclase–plagioclase dihedral angle populations is generally higher in (rapidly cooled) dolerite sills.
CONCLUSIONS
Observations from a wide range of basaltic bodies demonstrate that the underlying control on Θ cpp is the growth behavior of plagioclase, specifically the extent to which growth occurs on the (010) faces, with a clear relationship between plagioclase crystal shape and Θ cpp in unfractionated bodies, resulting from the control of cooling rate on the relative rates of growth of the different plagioclase faces. The relationship between plagioclase shape and Θ cpp is obscured in layered intrusions. The main reason for this is that the dominant control on the overall plagioclase grain shape is the macro-scale cooling rate of the intrusion, with much of each grain growing either above or close to the magma–mush interface with a shape controlled primarily by the global cooling rate. The dihedral angle is created deep in the mush, by overgrowth of the plagioclase primocrysts: the extent to which overgrowth occurs on (010) faces (and hence the resultant dihedral angle population) is controlled by the local thermal budget and latent heat buffering. A further factor preventing a universal direct correlation between plagioclase grain shape and dihedral angle is the cessation of plagioclase crystallization from highly evolved late-stage interstitial liquids in layered intrusions.
These observations suggest that attempts to quantify the time-scales of crystallization on the magma chamber floor should involve two stages. Quantification of crystallization times at or near the magma–mush interface in layered intrusions (leading to the creation of a porous mushy layer) could be achieved by comparison of the shape of plagioclase primocryst cores with that in dolerite sills, whereas the second stage of crystallization, leading to a completely solidified mushy layer, could be quantified by comparing either Θ cpp with dolerite sills, or the shape of intercumulus overgrowths on plagioclase primocrysts with the shape of plagioclase in dolerite sills. These ideas will be explored in a later contribution.
It might be asked whether dihedral angles could be of general application to speedometry in crystallizing systems. The detailed work described above concerns three-grain junctions involving two grains of plagioclase, and it is the particular growth behavior of plagioclase that determines the way cooling history is recorded by dihedral angles. One might expect a similar pattern to be present at junctions formed by other minerals with a strong cooling-rate control on the relative growth rates of different faces, but few data are available. Spatial variations of olivine–olivine–pyroxene dihedral angles have been observed in clinopyroxene oikocrysts enclosing rounded olivine primocrysts in an olivine cumulate, with higher dihedral angles in the oikocryst centre and lower angles on the margin ( Holness et al. , 2005 ). Given that fluctuations in cooling rate (and therefore the shape of growing grains) are very unlikely over the short length-scales involved, the published interpretation that these angle variations are the result of variable extents of sub-solidus textural equilibration, with a greater approach to sub-solidus equilibrium of the earlier-formed junctions in the centre of the oikocryst, is almost certainly correct. Similar variations of dihedral angle are observed at junctions involving quartz and feldspar in migmatites ( Holness & Sawyer, 2008 ) and, again, this is most probably a sub-solidus effect rather than a consequence of growth rate mediated changes in mineral shape. It would be instructive, however, to examine other systems in which cooling rate results in measurable shape changes, such as quartz–plagioclase–plagioclase junctions in silicic plutons, or to explore the possibility that potassium feldspar may also exhibit a cooling rate control on shape.
ACKNOWLEDGEMENTS
This contribution is the result of many years’ work with numerous colleagues, including Troels Nielsen, Christian Tegner, Dan McKenzie, Mike Cheadle, Tony Morse, Madeleine Humphreys, Ilya Veksler, Ed Sawyer, Roz Helz, Chris Richardson, Grant Cawthorn and Jens Christian Andersen. I am grateful to them all for their support, encouragement and robust discussions. More recent discussions with Jerome Neufeld, Rob Farr, Olivier Namur and Mike Bickle led to refinement of the ideas expressed here. Troels Nielsen is thanked for the loan of the Bollingberg samples. Iris Buisman generated the QEMSCAN images. Constructive and helpful comments by Michael Higgins and Tony Morse resulted in significant improvements to an earlier version of this paper.
FUNDING
This work was funded by the Natural Environment Research Council (grant number NE/J021520/1).
REFERENCES
