


Abstract
Background. Infection is a common cause of mortality and morbidity in haemodialysis patients. Few prospective studies have examined the clinical consequences of infection-related hospitalizations in haemodialysis patients or the risk factors predictive of clinical outcomes.
Methods. The outcomes of all first infection-related hospitalizations of patients enrolled in the HEMO Study were categorized in terms of mortality, requirement for intensive care unit (ICU) stay and length of hospitalization. In addition, the association of hospitalization outcomes with clinical and laboratory parameters was evaluated.
Results. Among the 783 first infection-related hospitalizations, 57.7% had a severe outcome (death, ICU stay or hospitalization ≥7 days). The likelihood of a severe outcome increased with patient age (P<0.0001) and with decreased serum albumin (P<0.001). The frequency of a severe outcome varied greatly by infectious disease category (P<0.001), being highest for cardiac infections (95.6%) and infection of unknown source (68.4%), and lowest for urinary tract infections (35.5%) and access-related infections (43.8%). On multivariate analysis, hospitalization outcome was independently associated with patient age, serum albumin and disease category, but not with the randomized Kt/V or flux, gender, race or diabetic status.
Conclusion. In summary, infection-related hospitalizations are associated with substantial morbidity. Patient age, serum albumin and infectious disease category are independently correlated with the hospitalization outcome, and can be used to estimate the likelihood of serious outcomes at the time of hospital admission.
Introduction
Infection is a common cause of morbidity and mortality in haemodialysis patients [1–5]. Among the 1846 patients with prospective follow-up in the HEMO Study, infection was the cause of 23% of deaths and 22% of hospitalizations [6]. The severity of infection-related hospitalizations can vary greatly. At one extreme are patients who die, require an intensive care unit (ICU) stay or have a prolonged admission, whereas at the other extreme are patients with relatively mild illness who can be discharged home after a brief hospitalization. Few studies have categorized the outcomes of infection-related hospitalizations in haemodialysis patients, or evaluated the predictive value of baseline clinical or laboratory features on the frequency of severe outcomes. Moreover, there has not been any systematic attempt to identify prognostic clinical or laboratory factors for the outcomes of infection-related hospitalizations.
The purpose of the present study was to use the prospective database in the HEMO Study to (i) classify the clinical outcomes of infection-related hospitalizations in a large population of haemodialysis patients; and (ii) evaluate the association of clinical and laboratory parameters with the likelihood of severe outcomes (death, ICU stay or prolonged hospitalization).
Subjects and methods
Study design
The design and methods of the HEMO Study have been reported previously [7]. In brief, the HEMO Study was a multi-centre, prospective, randomized, 2 × 2 factorial clinical trial that evaluated the effect of dialysis dose and flux on the morbidity and mortality of haemodialysis patients. The study was approved by the Institutional Review Board at each of 15 clinical centres associated with 72 participating dialysis units, and all patients gave written informed consent.
Baseline
The subjects were enrolled in the baseline phase between March 1995 and October 2000, and randomized between May 1995 and February 2001. Eligibility requirements for baseline enrolment included age between 18 and 80 years, receiving in-centre haemodialysis thrice weekly, and on haemodialysis for >3 months. Demographic and clinical information was collected at baseline. An Index of Coexisting Disease (ICED) score was computed excluding diabetes [8]. Patients were excluded during baseline if (i) their residual urea clearance in a 24–46 h urine collection was >1.5 ml/min per 35 l of urea volume; (ii) their serum albumin (nephelometry) was <2.6 g/dl; (iii) they failed to achieve the high target dialysis dose in ≤4.5 h on two of three consecutive monitored dialysis sessions; (iv) they had serious co-morbid medical conditions, including active malignancy or infection, unstable angina, or end-stage cardiac, pulmonary or hepatic disease; or (v) they were scheduled for a living donor kidney transplant.
Interventions
Patients meeting the inclusion and exclusion criteria were randomized to the study interventions in a 2 × 2 factorial design with equal allocation. Each patient was randomized to receive either a standard (eKt/V 1.05) or high (eKt/V 1.45) dialysis dose, and to dialyse with either a low-flux (β2-microglobulin clearance <10 ml/min) or high-flux (β2-microglobulin clearance >20 ml/min) membrane. Unmodified cellulose dialysers were excluded. The target dialysis dose was achieved by manipulating dialyser clearance, dialysis blood flow and treatment time (minimum ≥2.5 h). Adherence to dose intervention was monitored by monthly urea kinetic modelling. Dialyser reuse was permitted, but the number of reuses was limited in the high-flux arm to meet the target β2-microglobulin clearance. The mean achieved equilibrated Kt/V (eKt/V) was 1.53±0.09 in the high dose group and 1.16±0.08 in the standard dose group; the single pool Kt/V (spKt/V) was 1.71±0.11 and 1.32±0.09, respectively. The mean achieved β2-microglobulin clearances were 3.4±7.2 and 33.8±11.4 ml/min in the low-flux and high-flux groups, respectively. Other than the study interventions, the dialysis and medical management of the patients conformed to current standards of care. Monthly laboratory tests collected on all study patients included a serum albumin. Data collection ended in December 2001. The mean patient follow-up for mortality was 2.84 years.
Quantification of severity of infection-related hospitalizations
Infection-related hospitalization was one of the pre-defined secondary outcomes of the HEMO Study. Each hospitalization of a study subject was reported by the clinical centre, following review of the discharge summary, pertinent medical records and diagnostic tests. Specific infectious disease categories were assigned to the hospitalizations from a pre-defined list. All hospitalization reports classified by the clinical centre as a first infection-related hospitalization were audited by the Outcome Review Committee, which agreed with this classification 96% of the time. Specific outcomes reported for each infection-related hospitalization included (i) whether the patient died; (ii) whether the patient required a stay in the ICU; and (iii) the length of hospitalization. This information was used to classify the outcome of each hospitalization into one of five mutually exclusive severity categories (Table 1). A severe outcome of an infection-related hospitalization was defined as death, an ICU stay or a prolonged hospitalization (≥7 days).
Clinical outcomes of infection-related hospitalizations
| Outcome | No. of hospitalizations | Percentage of hospitalizations |
|---|---|---|
| Deatha | 108 | 13.8% |
| ICU without deathb | 120 | 15.3% |
| Hospitalization ≥7 daysc | 224 | 28.6% |
| Hospitalization 4–6 daysc | 166 | 21.2% |
| Hospitalization <3 daysc | 165 | 21.1% |
| Outcome | No. of hospitalizations | Percentage of hospitalizations |
|---|---|---|
| Deatha | 108 | 13.8% |
| ICU without deathb | 120 | 15.3% |
| Hospitalization ≥7 daysc | 224 | 28.6% |
| Hospitalization 4–6 daysc | 166 | 21.2% |
| Hospitalization <3 daysc | 165 | 21.1% |
aRegardless of ICU stay or length of hospitalization.
bRegardless of length of hospitalization.
cWithout death or ICU stay.
Statistical analyses
We examined the association of hospitalization outcomes with clinical and laboratory factors. The severity category was treated as an ordered categorical variable, and the χ2 test was used to evaluate the association of the severity category with individual categorical factors. In multivariable analyses, ordinal logistic regression was used jointly to relate the severity category to a designated set of clinical variables. For the purpose of this analysis, we used the most recent monthly serum albumin value obtained prior to the first infection-related hospitalization. The type of vascular access used for dialysis was reported monthly by the clinical centre. For the purpose of this analysis, we assumed that the type of access reported preceding the hospitalization was the one in use at the time of the infection-related hospitalization.
Results
Among the 1846 chronic haemodialysis patients randomized in the HEMO Study, 783 (42.4%) had at least one infection-related hospitalization. The clinical characteristics of this patient subset are summarized in Table 2. There was a slight preponderance of women. Almost two-thirds were black, reflecting the demographic composition of the participating centres. About half the patients were diabetic. As compared with the patients without an infection, those having an infection-related hospitalization were older, more likely to have diabetes and had a lower baseline serum albumin.
Clinical characteristics of HEMO Study patients with a first infection-related hospitalization
| Factors | All patients with infection (n = 783) | All patients without infection (n = 1063) | P-value |
|---|---|---|---|
| Age, years | 59.0±13.6 | 56.6±14.3 | 0.0002 |
| Female (%) | 56.6 | 56.0 | 0.80 |
| Black (%) | 64.1 | 61.5 | 0.26 |
| Diabetic (%) | 50.1 | 40.6 | <0.0001 |
| Duration of dialysis, years | 3.9±4.3 | 3.7±4.4 | 0.29 |
| Serum albumin, g/dla | 3.6±0.3 | 3.7±0.4 | <0.0001 |
Values are means±SD or percentages.
aBaseline value.
Among the patients with a first infection-related hospitalization, ∼58% had a severe outcome (death, ICU stay or prolonged hospitalization ≥7 days) (Table 1). The frequency of a severe hospitalization outcome was similar between patients randomized to a high or standard Kt/V (57.5 vs 58.0%), and for patients randomized to a high-flux or low-flux dialyser (56.7 vs 58.7%) (Table 3). Similarly, the likelihood of a severe outcome during an infection-related hospitalization was not affected by patient gender (56.2% for men vs 58.9% for women), race (57.8% for blacks vs 57.7% for non-blacks), diabetic status (58.7% for diabetics vs 56.8% for non-diabetics) or ICED score (55.5% for patients with scores <2.0 vs 58.6% for scores ≥2.0). Similar conclusions were reached on the relative likelihood of outcomes between subgroups when the definition of severe outcomes was limited to death or ICU stay.
Association of clinical variables with outcomes of first infection-related hospitalizations
| Clinical variable | n | Hospitalization outcome (% of total) | P-value | ||||||||
|---|---|---|---|---|---|---|---|---|---|---|---|
| Death | ICU | Hospitalization ≥7 days | Hospitalization 4–6 days | Hospitalization ≤3 days | |||||||
| Kt/V | 0.47 | ||||||||||
| High | 381 | 15.5 | 13.4 | 28.6 | 21.8 | 20.7 | |||||
| Standard | 402 | 12.2 | 17.2 | 28.6 | 20.6 | 21.4 | |||||
| Flux | 0.52 | ||||||||||
| High | 386 | 15.0 | 13.7 | 28.0 | 22.8 | 20.5 | |||||
| Low | 397 | 12.6 | 16.9 | 29.2 | 19.6 | 21.7 | |||||
| Gender | 0.03 | ||||||||||
| Male | 340 | 15.0 | 17.1 | 24.1 | 19.1 | 24.7 | |||||
| Female | 443 | 12.9 | 14.0 | 32.0 | 22.8 | 18.3 | |||||
| Race | 0.46 | ||||||||||
| Black | 502 | 13.2 | 16.5 | 28.1 | 22.3 | 19.9 | |||||
| Non-black | 281 | 15.0 | 13.2 | 29.5 | 19.2 | 23.1 | |||||
| Diabetes | 0.001 | ||||||||||
| Yes | 392 | 12.8 | 12.5 | 33.4 | 23.7 | 17.6 | |||||
| No | 391 | 14.8 | 18.2 | 23.8 | 18.7 | 24.6 | |||||
| ICED score | 0.89 | ||||||||||
| <2.0 | 236 | 13.6 | 14.8 | 27.1 | 21.2 | 23.3 | |||||
| ≥2.0 | 547 | 13.9 | 15.6 | 29.2 | 21.2 | 20.1 | |||||
ICED = Index of Coexisting Disease.
In contrast, the frequency of severe outcomes increased with patient age (Table 4). The likelihood of death, ICU stay or prolonged hospitalization increased from 24.1% in patients under the age of 30 years, to 48.0% in patients in their 40s, and to 66.1% in patients in their 70s. It is possible that this association may follow a ‘step function’, rather than being strictly linear. Thus, it appears that the risk of severe outcomes increased abruptly after age 30, remained fairly flat between ages 30–60, and increased once again after age 60 (Table 4).
Association between patient age and outcomes of first infection-related hospitalization
| Age (years) | n | Percentage hospitalizations | ||||||||
|---|---|---|---|---|---|---|---|---|---|---|
| Death | ICU | Hospitalization ≥7 days | Hospitalization 4–6 days | Hospitalization ≤3 days | ||||||
| <30 | 29 | 3.4 | 0.0 | 20.7 | 37.9 | 37.9 | ||||
| 30–39 | 59 | 6.8 | 18.6 | 27.2 | 28.8 | 18.6 | ||||
| 40–49 | 104 | 6.7 | 17.3 | 24.0 | 23.1 | 28.8 | ||||
| 50–59 | 159 | 11.3 | 15.1 | 32.7 | 18.2 | 22.6 | ||||
| 60–69 | 248 | 17.7 | 13.7 | 27.8 | 21.4 | 19.3 | ||||
| 70–79 | 180 | 17.2 | 18.3 | 30.6 | 17.8 | 16.1 | ||||
P<0.0001 by χ2 test.
Conversely, the frequency of severe outcomes was inversely related to the serum albumin (Table 5), increasing from 39.9% in patients whose serum albumin was ≥4.0 g/dl to 57.8% in patients with a serum albumin of 3.0–3.4 g/dl to 82.7% among those patients with a serum albumin <2.5 g/dl. Similar to the association with age, the association of outcomes with serum albumin appeared to follow a ‘step function’. Thus, the risk of severe outcomes appeared to increase abruptly for patients with a serum albumin <4.0 g/dl, remained fairly constant for serum albumin between 3.0 and 3.9 g/dl, and then increased again for serum albumins <3.0 g/dl.
Association between serum albumin and outcomes of first infection-related hospitalizations
| Alb values (g/dl) | n | Percentage hospitalizations | ||||||||
|---|---|---|---|---|---|---|---|---|---|---|
| Death | ICU | Hospitalization ≥7 days | Hospitalization 4–6 days | Hospitalization ≤3 days | ||||||
| ≥4.0 | 65 | 4.6 | 13.8 | 21.5 | 26.2 | 33.8 | ||||
| 3.5–3.9 | 312 | 13.8 | 15.4 | 26.9 | 21.8 | 22.1 | ||||
| 3.0–3.4 | 277 | 13.4 | 15.5 | 28.9 | 22.7 | 19.5 | ||||
| 2.5–3.0 | 100 | 20.0 | 15.0 | 32.0 | 14.0 | 19.0 | ||||
| <2.5 | 29 | 17.2 | 17.2 | 48.3 | 13.8 | 3.4 | ||||
P<0.001 by χ2 test.
The effects of patient age and serum albumin on hospitalization outcomes were independent (Figure 1). For patients in any age subset, decreasing albumin was associated with higher likelihood of severe outcomes during infection-related hospitalizations. Likewise, for patients in any subcategory of albumin values, increasing age was associated with a higher risk of severe outcomes. The frequency of severe outcomes ranged from a low of 16.7% in patients under age 30 years with a serum albumin ≥4.0 g/dl to a high of 73.2% in those over age 65 years with a serum albumin <3.0 g/dl.
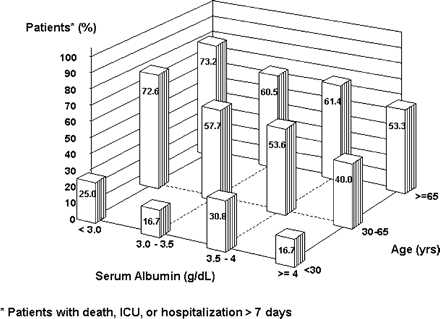
The interaction between patient age and serum albumin in predicting the likelihood of a severe outcome (death, ICU stay or prolonged hospitalization) among patients with a first infection-related hospitalization.
The infectious disease category was highly associated with the hospitalization outcome (Table 6). A severe outcome was most likely among patients with cardiac infections (95.6%) and infections of unknown source (68.4%), and least likely among those with urinary tract infections (35.5%) and access-related infections (43.8%). The association between serum albumin and hospitalization outcome persisted after adjustment for infectious disease category (P<0.0001). Among patients with an access-related infectious hospitalization, the likelihood of a severe outcome was not significantly different by access type (47.6% for fistulas, 39.3% for grafts and 38.5% for catheters) (Table 7).
Association between disease category and outcomes of first infection-related hospitalization
| Disease category | n | Percentage hospitalizations | ||||||||
|---|---|---|---|---|---|---|---|---|---|---|
| Death | ICU | Hospitalization ≥7 days | Hospitalization 4–6 days | Hospitalization ≤3 days | ||||||
| UTI | 31 | 0 | 16.1 | 19.4 | 22.6 | 41.9 | ||||
| Access-related | 196 | 6.6 | 6.1 | 31.1 | 28.1 | 28.1 | ||||
| Diabetic foot infection | 40 | 10.0 | 5.0 | 52.5 | 12.5 | 20.0 | ||||
| MS or CTD | 33 | 9.1 | 9.1 | 60.6 | 15.2 | 6.1 | ||||
| Pulmonary infection | 184 | 13.6 | 19.0 | 20.6 | 21.2 | 25.5 | ||||
| PVD | 67 | 16.4 | 7.5 | 43.3 | 16.4 | 16.4 | ||||
| GI | 52 | 21.2 | 25.0 | 19.2 | 23.1 | 11.5 | ||||
| Infection of unknown sourcea | 250 | 24.0 | 18.8 | 25.6 | 17.6 | 14.0 | ||||
| Cardiac (endocarditis) | 23 | 30.4 | 26.1 | 39.1 | 4.4 | 0 | ||||
P<0.001 by χ2 test.
A single hospitalization may receive up to four diagnosis codes, such that the same hospitalization may be counted more than once. Only infection-related diagnosis codes are counted in each category.
aIncludes septic shock, bacteraemia or abscess not falling into another disease category.
PVD = peripheral vascular disease; MS or CTD = musculoskeletal or connective tissue disease; GI = gastrointestinal; UTI = urinary tract infection.
Two disease categories were omitted due to low numbers: heptobiliary disease (n = 14) and nervous system infection (n = 4).
Association between access type and outcomes of first access-related infectious hospitalization
| Accesss type | n | Percentage hospitalizations | ||||||||
|---|---|---|---|---|---|---|---|---|---|---|
| Death | ICU | Hospitalization ≥7 days | Hospitalization 4–6 days | Hospitalization ≤3 days | ||||||
| Graft | 82 | 4.9 | 12.2 | 30.5 | 22.0 | 30.5 | ||||
| Fistula | 28 | 14.3 | 3.6 | 21.4 | 28.6 | 32.1 | ||||
| Catheter | 52 | 3.8 | 9.6 | 25.0 | 28.8 | 32.7 | ||||
P = 0.53 by χ2 test.
On multivariate analysis, only serum albumin, disease category and patient age were independently associated with illness severity.
Discussion
This study classifies the outcomes of infection-related hospitalizations in haemodialysis patients, as judged by objective parameters including death, requirement for an ICU stay and prolonged hospitalization (≥7 days). Previous observational studies suggested that both a higher dialysis dose and use of a high-flux dialyser were associated with a reduction of infection-related deaths and hospitalizations [1,9]. In contrast, results from the randomized HEMO Study failed to confirm a beneficial effect of dialysis dose higher than current K/DOQI guidelines or of a high-flux dialyser on infection-related outcomes [6]. The present analysis further shows that, even among the subset of patients having an infection-related hospitalization, neither dialysis dose nor dialyser flux influences the frequency of severe outcomes (Table 3).
The assignment of infection outcome categories was somewhat arbitrary. One could argue that only deaths or ICU admissions should be counted as severe outcomes, without including prolonged hospitalizations. However, this designation would not take into account potential differences in practice patterns among hospitals or even individual physicians within a single hospital. A patient admitted with a severe infection might be admitted to the ICU at one hospital, but managed on a regular floor or step-down unit at another hospital. Moreover, due to the nature of the data collection, it is not possible to determine the specific criteria for ICU admissions, the duration of ICU stay, the timing of ICU stay relative to the hospitalization, whether the patient required administration of vasopressors, etc. For this reason, prolonged (≥7 days) hospitalization was used as a surrogate for more severe outcomes. However, when we re-analysed the outcomes of infection-related hospitalizations, restricting the definition to just deaths or ICU admissions, the same three factors were associated with severe outcomes (age, serum albumin and type of infection).
We have observed previously that patient age did not affect the rate of infection-related hospitalizations in the HEMO Study on multiple variable regression analysis [6]. The risk of cardiovascular events in haemodialysis patients is increased with age [10]. Hence, cardiovascular deaths may censor older patients before they have an infection-related hospitalization. This may in part explain the lack of association between patient age and frequency of infection-related hospitalization. We now report that increased age substantially increases the likelihood of severe outcomes (death, ICU or prolonged hospitalization) among those patients with an infection-related hospitalization (Table 4, Figure 1). This finding is in agreement with the increased frequency of infection-related deaths in older renal transplant recipients [11]. Similarly, other investigators have reported that in the general population, severe consequences of hospitalized patients with pneumonia are more likely in the elderly [12,13].
The observation of an inverse correlation between the likelihood of severe outcomes and serum albumin obtained in the month preceding the infection-related hospitalization is in keeping with numerous reports of hypoalbuminaemia as an adverse risk factor among acutely ill patients [14]. The association between hypoalbuminaemia and poor outcomes has also been confirmed in haemodialysis patients [15]. The extent to which hypoalbuminaemia reflected nutritional status or an inflammatory state cannot be ascertained from the present study. However, detailed albumin kinetics studies performed in a subset of HEMO Study patients concluded that a decrease in serum albumin in well-dialysed patients was largely due to an increase in the level of inflammation, rather than a decrease in protein intake [16]. Nevertheless, the level of inflammation and protein intake (as estimated by measurement of protein catabolic rate) interact to set serum albumin levels [17]. Infection, with its accompanying inflammation, leads to an increase in resting energy expenditure in subjects with chronic illness [18], making restoration of nutritional status difficult [19]. Hypoalbuminaemia may identify those subjects at risk.
The type of infection was strongly associated with the hospitalization outcomes. Severe outcomes were observed most frequently among patients with cardiac infections or infection of unknown source, and least frequently among those with urinary tract infections and access-related infections (Table 6). Cardiac infections, primarily bacterial endocarditis, carry a high mortality risk even in the general population [20]. They often represent a systemic infection with multiple foci of infection throughout the body, so their association with severe clinical outcomes is not surprising. Infections of unknown source often mean that a specific directed therapy is not feasible, thereby resulting in poorer outcomes. The relatively good outcomes of urinary tract infections and access-related infections probably reflect the ease with which the underlying source of infection can be corrected.
Fine et al. [13] stratified general medical patients hospitalized with community-acquired pneumonia into five risk classes, on the basis of age, co-morbidity and laboratory values at the time of initial assessment. Overall, 9.2% of the patients required an ICU admission, but the frequency ranged from a low of 4.3% for class I patients to a high of 17.3% for class V patients. The 19.0% rate of ICU admissions for haemodialysis patients with pulmonary infection in the present study (Table 6) is comparable with that observed in the highest risk class of general medical patients. Similarly, the 13.6% death rate from pulmonary infection in the current study is higher than the 9% rate reported for the general medical patients in risk class IV. Thus, the outcomes of pulmonary infection among haemodialysis patients are comparable with those observed in the sickest group of general medical patients.
It could be argued that the results from the HEMO Study may not generalize to the overall haemodialysis population due to the exclusion criteria. Although patients with severe co-morbidity and profound hypoalbuminaemia (<2.5 g/dl) were excluded, a large proportion of the study patients were older (Table 4), had substantial hypoalbuminaemia (Table 5), or had ischaemic heart disease or congestive heart failure [7]. Exclusion of patients unable to achieve the high target Kt/V necessarily reduced the proportion of catheter-dependent patients, so that the frequency of access-related infections in the HEMO Study underestimates the frequency in the general US haemodialysis population [6].
In summary, infection-related hospitalization in haemodialysis patients is associated with substantial adverse outcomes, including death, ICU admissions and prolonged hospitalization. The severity of these hospitalizations is independently associated with patient age, serum albumin and infectious disease category. Knowledge of these clinical factors at the time of hospital admission for an infection may be helpful in anticipating the likely outcome.
This study was supported by the National Institute of Diabetes and Digestive and Kidney Diseases (NIDDK). Portions of this manuscript have been presented in abstract form at the American Society of Nephrology meeting in San Diego, November 13–17, 2003.
Conflict of interest statement. None declared.
References
Bloembergen WE, Stannard DC, Port FK et al. Relationship of dose of hemodialysis and cause-specific mortality.
US Renal Data System.
Powe NR, Jaar B, Furth SL, Hermann J, Briggs W. Septicemia in dialysis patients: incidence, risk factors, and prognosis.
Hoen B, Paul-Dauphin A, Hestin D, Kessler M. EPIBACDIAL: a multicenter prospective study of risk factors for bacteremia in chronic hemodialysis patients.
Pastan S, Soucie M, McClellan WM. Vascular access and increased risk of death among hemodialysis patients.
Allon M, Depner TA, Radeva M et al. Impact of dialysis dose and membrane on infection-related hospitalization and death: results of the HEMO Study.
Eknoyan G, Beck GJ, Cheung AK et al. Effect of dialysis dose and membrane flux on mortality and morbidity in maintenance hemodialysis patients: primary results of the HEMO Study.
Miskulin DC, Athienites N, Yan G et al. Comorbidity assessment using the Index of Coexistent Diseases in a multicenter clinical trial.
Bloembergen WE, Hakim RM, Stannard DC et al. Relationship of dialysis membrane and cause-specific mortality.
Cheung AK, Sarnak MJ, Yan G et al., The Hemodialysis (HEMO) Study Group. Atherosclerotic cardiovascular disease risks in chronic hemodialysis patients.
Meier-Kriesche HU, Ojo AO, Hanson JA, Kaplan B. Exponentially increased risk of infectious death in older renal transplant recipients.
Goss CH, Rubenfled GD, Park DR, Sherbin VL, Goodman MS, Root RK. Cost and incidence of social comorbidities in low-risk patients with community-acquired pneumonia admitted to a public hospital.
Fine MJ, Auble TE, Yealy DM et al. A prediction rule to identify low-risk patients with community acquired pneumonia.
Vincent JL, Dubois MJ, Navickis RJ, Wilkes MM. Hypoalbuminemia in acute illness: is there a rationale for intervention? A meta-analysis of cohort studies and controlled trials.
Owen WF, Lew NL, Liu Y, Lowrie EG, Lazarus JM. The urea reduction ratio and serum albumin concentration as predictors of mortality in patients undergoing hemodialysis.
Kaysen GA, Dubin JA, Muller HG, Rosales L, Levin NW, Mitch WE, The HEMO Study Group. Inflammation and reduced albumin synthesis associated with stable decline in serum albumin in hemodialysis patients.
Kaysen GA, Greene T, Daugirdas JT et al. Longitudinal and cross-sectional effects of C-reactive protein, equilibrated normalized protein catabolic rate, and serum bicarbonate on creatinine and albumin levels in dialysis patients.
Coors M, Suttman U, Trimborn P, Ockenga J, Muller MJ, Selberg O. Acute phase response and energy balance in stable human immunodeficiency virus-infected patients: a doubly labeled water study.
Garcia-Lorda P, Serrano P, Jiminez-Exposito MJ et al. Cytokine-driven inflammatory response is associated with hypermetabolism of AIDS patients with opportunistic infections.
Author notes
1University of Alabama at Birmingham, AL, 2Cleveland Clinic, Cleveland, OH, 3Emory University, Atlanta, GA, 4University of Utah, Salt Lake City, UT, 5Duke University, Durham, NC, 6Washington University, St Louis, MO, 7University of California, Davis, CA, 8Beth Israel Medical Center, New York, NY and 9Vanderbilt University, Nashville, TN, USA


Comments