


Abstract
In higher eukaryotes, alternative splicing is a common mechanism for increasing transcriptome diversity. Affymetrix exon arrays were designed as a tool for monitoring the relative expression levels of hundreds of thousands of known and predicted exons with a view to detecting alternative splicing events. In this article, we have analyzed exon array data from many different human and mouse tissues and have uncovered a systematic relationship between transcript-fold change and alternative splicing as reported by the splicing index. Evidence from dilution experiments and deep sequencing suggest that this effect is of technical rather than biological origin and that it is driven by sequence features of the probes. This effect is substantial and results in a 12-fold overestimation of alternative splicing events in genes that are differentially expressed. By cross-species exon array comparison, we could further show that the systematic bias persists even across species boundaries. Failure to consider this effect in data analysis would result in the reproducible false detection of apparently conserved alternative splicing events. Finally, we have developed a software in R called COSIE (Corrected Splicing Indices for Exon arrays) that for any given set of new exon array experiments corrects for the observed bias and improves the detection of alternative splicing (available at www.fmi.ch/groups/gbioinfo ).
INTRODUCTION
Affymetrix exon arrays are commercially available for human, mouse and rat. These arrays contain probesets directed against all known and predicted exons described at their design times. This is typically in the order of one million probesets. A probeset typically represents a single exon, or part of an exon, and is generally comprised of four oligonucleotides which often show substantial sequence overlap with one another. In contrast to earlier Affymetrix 3′-UTR expression arrays, the higher number and closer spacing of probes within target sequences made it more difficult to select probes with similar GC content. As a result, the melting temperatures of these oligos vary more than was the case before. Also the independence of their signals is less secure because many of them overlap substantially because of short exon lengths. Splice junction oligos have not been included in the design. Affymetrix has provided the community with exon array tissue panel data, which may be freely downloaded in order to facilitate the development of bioinformatical tools for splicing analysis and to provide a common reference set for researchers. In addition, several other large-scale exon studies have been made publicly available by research labs around the world. The origin of this study was a simple desire to study the behavior of oligonucleotide hybridization in complex mixtures in a hope that it might contribute to our understanding of the relationship between fluorescent signal and input concentrations of nucleic acids. In the course of this analysis, we observed that the serial dilution of technical repeats of labeled mouse RNA with labeled Drosophila -carrier RNA resulted in the detection of splicing events that could not be biological in origin. Upon examination of publicly available exon array data sets, we discovered that the behavior we observed in our dilution experiment was also clearly detectable in these sets. In this articles, we set out to describe this phenomenon and to propose some steps that may be taken to minimize its effect.
One of the earliest attempts to investigate alternative splicing with microarrays was made using a printed two-color microarray with oligonucleotides directed against exon, intron and splice junction regions of the yeast transcriptome ( 1 ). In this landmark paper, Clark et al . propose two scores for observing differential splicing in yeast. These scores are the splice junction index and the intron accumulation index. These scores are simply the signal of the splice junction probes or intron probes normalized to the gene-level signal, respectively. As an evolution of this approach, Clark and colleagues shift to a single color Affymetrix array platform without junction probes ( 1 ), proposing a splicing index (SI) that normalizes each exon signal by dividing it by the gene expression level. They reported, based on the SI, that as many as 73% of detected genes were alternatively spliced across 16 normal human tissues ( 1 ).
Affymetrix recommends the use of their ANalysis Of Splice VAriation (ANOSVA) test ( 2 ) to apply statistical rigor to changes in SI. This test constructs a null hypothesis that all interaction terms in a two-way ANOVA are zero and that no exon probesets are over- or underresponders when compared with average gene expression. The alternative assumption is that some interaction terms are non-zero and Cline et al . ( 2 ) have proposed that this is an indication of alternative splicing. Cheung and coworkers ( 3 ) went on to propose the use of an alternative SI which they call the alternative splicing score which encapsulates both the ANOSVA and SI concepts by scaling the SI using the within group variance. Xing et al . ( 4 ) proposed an improved model of the gene-level estimate in order to improve the performance of the splicing index with their ‘microarray analysis of differential splicing’ (MADS). Rather than using all exons of a gene, they iteratively estimate a gene level based on the Li and Wong ( 5 ) linear model using only the least variant exons. In the FIRMA approach, Purdom et al . ( 6 ) used robust multichip analysis (RMA); ( 7 ) to estimate exon levels, and then additively modeled the expected behavior of an exon relative to a robust estimate of the gene expression level. Alternative splicing is proposed as a deviation from the fitted behavior.
The implicit assumption in all of these methods is that the gene-fold change and all exon-fold changes should be equal in the absence of alternative splicing. If correct, then any deviation from this behavior would be evidence for alternative exon inclusion. In this study, we show that this assumption does not apply to exon array data and results in substantial overestimation of the number of alternatively spliced exons.
MATERIALS AND METHODS
Affymetrix sample preparation
Total KC Drosophila , Stratagene universal human and Stratagene universal mouse RNA were processed and labeled using the Affymetrix whole transcript one-cycle labeling kits as per manufacturer's instructions. They were hybridized to Affymetrix Human Exon 1.0 or Mouse Exon 1.0 arrays, respectively. The arrays were scanned using an Affymetrix 7G scanner. Background correction and probeset condensation was performed using RMA ( 7 ). For most of the arrays, we used Affymetrix's Power Tools except for the dilution experiments for which we used exonmap ( 8 ) in bioconductor ( http://www.bioconductor.org ). Dilution experiments (at 100%, 50%, 25%, 10% and 0% human and mouse RNA) were performed in duplicates, therefore, we hybridized RNA to a total of 20 exon arrays (10 for each species). One of the 100% human RNA arrays was an outlier and excluded from further analysis.
Analysis of deep sequencing data
A total of 224.4 million reads for the tissues brain, liver and muscle (79.9, 75.8 and 69.8 Mio reads) ( 9 ) were downloaded from http://woldlab.caltech.edu/rnaseq . The fragments were mapped to the mouse genome (NCBI Build 37) using the softwares oligomap ( 10 ) for zero to one mismatches and SOAP ( 11 ) for two mismatches. We considered all fragments that mapped less than 100 times to the genome and weighted them by the inverse of their number of hits. Expression ei of each exon i (given as genome coordinates of the exon array probesets) was quantified by counting tags overlapping the exon ( ci ) and correcting for exon length ( ei = ci × avgExonLength/exonLength i ). After removing all nonexpressed exons (counts <2), we selected all genes for further analysis that had a sufficient number of tags per exon (>16 in all the samples) to enable reliable estimation of small expression changes. This resulted in a set of 3804 genes.
Finding homologous probesets in mouse and human
We used whole-genome alignments from UCSC ( http://genome.ucsc.edu/ ) to determine pairs of homologous probesets (roughly corresponding to exons) in mouse and human. Given the genomic coordinates of the probesets (from the Affymetrix exon array annotation files) in mouse (mm8) and human (hg18), we tested whether there are one or more alignment blocks that map >90% of the mouse probeset to a human one. In cases that linked one mouse probeset to multiple human candidates, we selected the one with the highest coverage.
Procedure to remove the bias from exon arrays
We analyzed a pool of 250 publicly available exon array experiments (training set, downloaded from Gene Expression Omnibus) to infer linear probeset response characteristics as follows: for each probeset i , we calculated the probeset response slope si using linear regression in the scatter plot depicting the gene expression and the splicing index for all 250 samples (examples shown in Figures 2 A and D). Given a new set of array experiments, we used those probeset response slopes to correct the data as follows: first, we calculated regular splicing indices SI i for each probeset i comparing each sample to the average sample. Then we calculated the ‘projected splicing index’ PSI i for every probeset which is the splicing index that we would expect if the probeset would react according to the training data given the gene-fold change gi (PSI i = gi · si ). The corrected splicing index CSI i was then defined as the difference between the actual and the PSI (CSI i = SI i − PSI i ). All calculations were performed in log2 space. As an improvement to the simple linear correction model, we further developed a nonlinear model that is powerful enough to capture probeset saturation effects observed in Figure 2 D. We chose to use the function y = a / d × log( e − dx + e − dc ) + b , which has the asymptotic behavior of y = ax + b for small x and y = ac + b (horizontal) and for large x ( Supplementary Figure 1 ). The variable c sets the position of the knee and d parameterizes the smoothness of the transition from the linear part on the left to the constant plateau on the right after the knee. The parameters c and d have to be set within certain limits, namely c should be within the range of gene expressions ( gmin and gmax ) and d should not be smaller than 0.2 as this would result in a kink in the function. Guided by the experimental data ( Supplementary Figure 1 ), we set the limits of d to be between 0.2 and 0.6. For each probesets, we fitted the parameters a , b , c and d by iterating through combinations of c [ gmin : 0.25 : gmax ] and d [0.2 : 0.1 : 0.6] and performing least squares to determine a and b . Once computed, the parameters were stored and used subsequently to correct novel sets of array experiments. In order to correct a probeset, we required that the gene expressions observed in the test data are within the range of observed gene expressions of the training data, extended by 2 in log2 space on both sides.
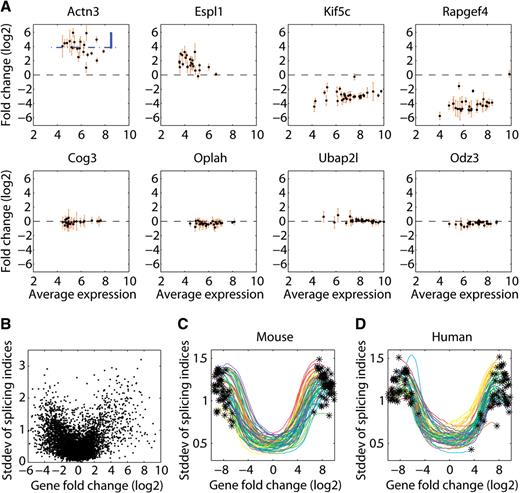
Relationship between transcript-fold change and the splicing index in pairwise sample comparisons. ( A ) MA plots for eight genes when comparing mouse embryo with mouse brain RNA. The average log2 expression is depicted on the x -axis and the log2 expression change on the y -axis. Every dot represents one probeset. The error bars are computed from four technical replicates. ( B ) A scatter plot comparing the log2 gene expression change ( x -axis) with the standard deviation of splicing indices from probesets of that gene ( y -axis). To reduce array boundary effects, all the nonexpressed probesets, as well as all genes with very low and very high expression levels, were removed. The same quantity is shown in ( C ) mouse and human ( D ), for all 55 pairwise comparisons between any two of the 11 array samples from the tissue panel data. Each comparison is represented as a smoothed interpolation curve with asterisks at its ends. In all the figure parts, only the core annotation sets of the human and mouse exon arrays were used.
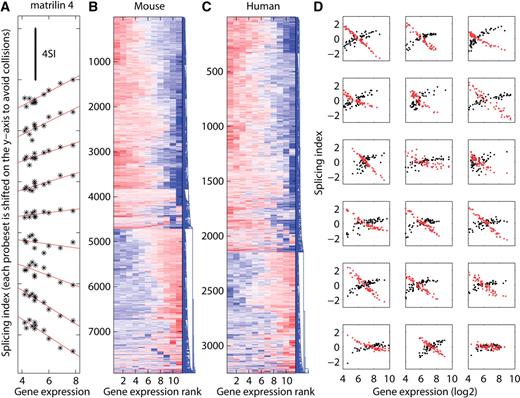
Probeset response characteristics. ( A ) The behavior of all probesets from one example gene (matrillin 4) across 11 mouse tissues (Affymetrix tissue panel data) in log–log space. The x -axis represents the expression of the gene, whereas the y -axis represents the splicing index of the probeset (determined by comparing each tissue to the average of all tissues). Individual probesets were sorted by their slope and shifted along the y -axis to avoid overlaps. The black line at the top illustrates the scale of the y -axis and represents four units in splicing index space. Mouse ( B ) and human ( C ) are condensed representations showing the behavior of many more probesets. Depicted is a hierarchical clustering of probesets that have high splicing index variability and reside in genes that change their expression in the 11 tissues (expression max − expression min > 3). Each row represents one probeset, the x -axis denotes gene expression rank amongst the 11 tissues (sorted independently for each exon) and the splicing index is color coded (red: ≥2.67, blue: ≤−2.67). ( D ) A more refined picture of individual probeset behavior based on another dataset comprising 57 lymphoblastoid cell line samples in triplicates ( 14 ). Eighteen genes are randomly selected from differentially expressed genes (expression max − expression min > 4). For each selected gene the behavior of the highest (black) and the lowest (red) responding probeset (based on the slope of a linear regression) is depicted.
RESULTS AND DISCUSSION
Systematic relationship between gene-fold change and the splicing index
Observed changes in the level of an exon can, in principle, be explained in at least two different ways. Either the gene's overall transcription rate has changed, or the exon's inclusion rate into mRNA has been altered, through mechanisms such as alternative splicing, alternative promoter usage or poly-A site usage. Identification of alternative exons requires the decoupling of these two components. If we assume that changes in gene expression should affect the expression of most of its exons and alternative splicing events should occur at a lower frequency than constitutive exon inclusion, then the splicing index ( 12 ) provides a solution to this decoupling problem. In logarithmic space, the SI is defined as the log probeset (roughly representing an exon or a part of an exon) expression change fi for probeset i corrected by the log gene expression change gi (SI i = fi − gi ). An intuitive graphical representation is given by standard MA plots depicting all probesets that belong to a particular gene, where M correspond to the change and A to the average level of each probeset in the two compared samples. Figure 1 A shows such MA plots for eight representative genes from an experiment comparing mouse embryo and brain RNA using Affymetrix mouse exon 1.0 arrays. Two of the eight selected genes are upregulated, two of them are downregulated and four appear unchanged in their expression in embryo compared with brain. The splicing index is simply the vertical distance between the probeset expression change and the gene expression change (see blue annotation in Figure 1 A). Inspecting many such example genes shows a subtle, but systematic, relationship between the gene expression change and the splicing index. Genes that show strong changes in expression have increased splicing index variability compared with their unchanging counterparts. We quantified this effect for all expressed genes in a scatter plot comparing the log gene expression change to the standard deviation of the splicing indices belonging to probesets of that particular gene ( Figure 1 B). To our surprise, we observed a U-shape relationship that implies that genes changing in their expression have more variability in splicing indices and thus would be subjected to more alternative splicing than genes that do not change their expression. We repeated this analysis for a series of independent exon array experiments in human (11 tissues in triplicates) and mouse (11 tissues in triplicates) from Affymetrix ( http://www.affymetrix.com ) and conclude that this phenomenon is general and can be reproduced in all pairwise expression comparisons (55 cases in human and mouse, Figures 1 C and D). A similar finding is described in ( 3 ) without further characterization. While all these data have been normalized using RMA, we made similar observations on data normalized by PLIER ( 13 ) (data not shown). We next wondered whether the phenomenon observed in the pairwise comparisons would be systematic across many samples from different tissues. We therefore reanalyzed the tissue panel dataset from Affymetrix including all tissues and calculated splicing indices by comparing each tissue to the average of all tissues. Figure 2 A depicts the behavior of all the probesets from one example gene (matrillin 4) across 11 mouse tissues. The probesets in this gene display a wide range of responses in log–log space: some increase at a lower rate compared with the gene (negative slope), others at an equal rate (horizontal), and yet others increase more than the gene (positive slope). To get a comprehensive picture, we generated heatmaps showing the behavior of all the probesets that have high splicing index variability and reside in genes that change their expression in the 11 tissues ( Figures 2 B and C). Hierarchical clustering grouped the majority of the probesets into only two distinct clusters. Probesets that have monotonically increasing splicing indices (over responders) and probesets with monotonically decreasing splicing indices (under responders).
Additional data from an independent experiment comprised of 57 lymphoblostoid cell lines ( 14 ) show that the behavior of individual probesets to a first approximation can be captured by the slope of a linear regression in log–log space, from now on referred to as the ‘probeset response slope’. However, the data also show that in detail the situation is more complex as overresponding probesets tend to saturate with increasing gene expression ( Figure 2 D).
The origin of the observed bias
We can envision two possible explanations for the observed dependency between changes in transcription rate and exon inclusion. It could be either a biological phenomenon or a technical artifact of the microarray platform. In the case of a biological phenomenon, one might imagine a global mechanism that couples transcription rate to exon inclusion. The spliceosome could be influenced by transcription rate and either over or under include individual exons upon expression change, similar to the reported ‘kinetic coupling’ between transcription and splicing machineries [reviewed in ( 15 )]. This model would be sufficient to explain the data; however it would have profound consequences for our understanding of gene expression. In the case of a technical microarray artifact, we could explain the effect by the known fact that response curves of individual probes (and thus probesets) differ significantly [see for example ( 16 )]. As gene expression increases, the signals of probes would increase with different rates (in log space) and thus drift further and further apart. It is known that probes respond in a nonlinear fashion, so this would represent a straightforward explanation of the observation. It should be mentioned that gene expression levels can be estimated with high confidence, as the number of probes for each gene is large and the slope differences of individual probes are averaged out. However, for detection of alternative exons, typically represented by only four (sometimes overlapping) probes, such differences are unlikely to be averaged out. The question about the origin of this effect is essential as it determines whether or not exon array data must be corrected for the observed bias. If there really is a massive coupling between transcription and exon inclusion, then no correction procedure should be applied since it would eliminate biologically important information. If no such coupling exists then the bias will obscure biologically important information.
Exon array dilution experiments in human and mouse
To gain insight into the nature of the observed bias, we performed a dilution experiment where we hybridized different amounts of the same mouse RNA to exon arrays. This allowed us to experimentally measure the differential behavior of individual probesets. The downside of a dilution experiment compared with a spike-in experiment ( 16 ) is that absolute abundance of the quantified material is not known. Therefore, only relative expression changes from one dilution condition to the other can be measured. This was no disadvantage here, as we were mainly interested in detecting alternative (relative) exon inclusion. The advantage of a dilution experiment is that it generates a large number of data points. In principle, with only two dilution conditions one can measure response slopes for every probe that belongs to an expressed gene. The setup of our dilution experiment was as follows: we hybridized 100%, 50%, 25%, 10% and 0% of Stratagene universal mouse RNA from a single pool of amplified and labeled material. To ensure that the total amount of RNA applied to the chips was always constant (in case of an effect caused by complexity reduction), we added increasing quantities of labeled Drosophila RNA isolated from KC cells at 0%, 50%, 75%, 90% and 100%, respectively. Due to the intrinsic differences in the expression distributions of individual experiments, only background correction was performed without quantile normalization. Note that in this case normalization was actually achieved physically by putting the same amount of material on the array. The same process was repeated using Stratagene human universal RNA diluted with KC Drosophila RNA. Experiments were performed in duplicates. The 0% mouse RNA (100% Drosophila ) was used to identify and remove all the probes (<4%) that cross-hybridized to the Drosophila RNA. Figure 3 A shows the distributions of probeset expression changes in 50%, 25% and 10% mouse RNA samples compared with undiluted (100%) mouse RNA. We can see that the array provides a good read out of the expected average gene-level expression changes. In the case of 50%, 25% and 10% dilution, the probesets go down approximately by −1, −2 and −3.3 respectively (in log2 space). To avoid saturation and boundary effects at the lower and upper expression range, we rigorously excluded those probesets from the analysis. Interestingly, in Figure 3 A, we can see that the variance of the expression changes increases with higher dilution (more variance at lower mouse RNA concentrations). This would be consistent with the idea that intrinsic differences in the probe response slopes exist as no alternative splicing can exist in our dilution experiment. Using linear regression, we summarized the behavior of each oligonucleotide across all dilution conditions by its slope (experimental probe response slope).
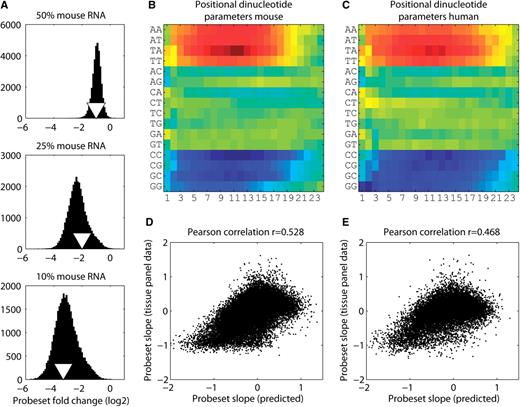
Probeset slope predictor based on a positional dinucleotide model. ( A ) The distributions of log2 probeset-fold changes for the mouse dilution experiment at three different dilutions. Each dilution condition (50%, 25% and 10%) was compared with the 100% mouse RNA array. To eliminate array boundary effects (low and high expression), we only considered a very narrow band of probe expression (between 6 and 8.5 in the 100% mouse RNA experiment). The triangles represent the expression change expected from the experiment. In log2 space this would be −1 for 50%, −2 for 25% and −3.3 for 10% dilution. ( B and C ) The positional contributions of individual dinucleotides after training a linear model with experimentally measured probe slopes from the dilution experiments. Position 24 represents the end of the probe that is attached to the surface of the microarray for mouse and human, respectively. Red color denotes positive contribution to the slope (overresponding) whereas blue denotes negative contribution (underresponding). The scatterplots in ( D and E ) show a comparison of the probeset response slopes either predicted by the dinucleotide model ( x -axis) or determined by linear regression from the Affymetrix tissue panel data ( y -axis) for mouse and human, respectively. Probe response slopes (predicted from the dinucleotide model) were converted to probeset response slopes by averaging the slopes of all the probes that belong to the probeset in question.
Probe response slope predictor based on a positional dinucleotide model
We speculated that there might be intrinsic sequence features of the probes that could determine their response behaviors. Therefore, we trained a positional dinucleotide model [similar to ( 4 , 17 )], using the experimentally determined probe response slopes from the dilution experiment as input. The positional dinucleotide model assumes that the behavior of a probe can be modeled by a positional contribution of its dinucleotides. We used a linear regression model converting the categorical dinucleotide variable with 16 states into 15 dummy variables. Since the probes have a length of 25 nt (24 dinucleotides), this resulted in a linear system of equations with 15 × 24 + 1 variables where the last variable represents a constant. To avoid entanglement of neighboring dinucleotides (resulting in an ill-conditioned system of equations), we trained two models, one containing the dinucleotides at even probe positions and one with those at odd positions (15 × 12 + 1 = 171 variables with >400 000 equations in mouse and human). The final predictor was the average of these two models. After least squares optimization, we obtained the parameters of the model which represent the importance or contribution of every dinucleotide as a function of its position. Figures 3 B and C show heat maps with the parameters obtained from the mouse and human dilution experiments, respectively. The dinucleotide parameters demonstrate that there exist sequence features predictive for probe response characteristics. CG-rich probes tend to be underresponders whereas AT-rich ones tend to be overresponders. Additionally, we can see that the end of the probe (attached to the surface) is generally less informative indicating that there might be reduced hybridization, possibly due to steric hindrance. This finding could be used to improve cross-hybridization prediction algorithms by either downweighting aligned nucleotides at the end or truncating the probes and to only use, e.g. the first 18–20 nt for alignment. Compared with internal dinucleotides, the very first one shows a distinct but informative pattern that is also consistent between mouse and human. We speculate that this could reflect distinct electron charge localization differences in this position because the base is bounded on one side by a free hydroxyl group rather than a phosphodiester bond to another nucleotide, which may affect base pairing, base stacking, or both.
Comparing the dinucleotide model with the Affymetrix tissue panel data
We wondered whether the dinucleotide model was powerful enough to recapitulate the probeset response slopes that we had previously observed in the Affymetrix tissue panel data ( Figures 3 D and E). Note that the dilution experiment by definition was devoid of alternative exons since a single source of material was hybridized multiple times at different concentrations. Therefore, the dinucleotide model was not confounded by alternative exon inclusion. Comparing the probeset response slopes predicted by our model with the slopes obtained from the Affymetrix tissue panel data, we detected a highly significant correlation both in mouse and human (Pearson correlation coefficient in mouse 0.528, P << 2.2 × 10 −16 , and in human 0.468, P << 2.2 × 10 −16 ). This demonstrates that a substantial part of the observed effect originates from a technical aspect of the microarray platform and not from a biological phenomenon. Since the correlation between predicted and observed exon slopes is rather weak, we cannot rule out the possibility that at least some of the effect is biological in nature.
Comparing exon arrays with deep sequencing data
Very recently, deep sequencing (RNA-seq) has emerged as a competing transcriptome profiling technology. In contrast to microarray technology, no probes have to be designed for detection of mRNAs. Briefly, input material is fragmented, ligated to adapters and a large number of molecules are sequenced in parallel. This results in millions of sequence tags that are annotated by mapping them to a reference genome. Expression of a particular stretch of DNA is measured by simply counting the tags that map within the region of interest. Since this method is radically different from microarray technology, a comparison of those two would provide additional information about the origin of the bias that we observed in exon array data. Unfortunately, accurate quantification of individual exon levels requires an enormous number of sequenced tags, as most exons are short and tag counts per exon have to be high enough to overcome sampling noise. Recently, a large RNA-seq study ( 9 ) was published that analyzed mouse brain, liver and muscle samples at sufficient depth using an Illumina Genome Analyzer instrument. To stay as close as possible to the setup of the exon array, we used identical coordinate annotations (core set, see Methods section). Finally, we selected genes for further analysis that had a sufficient number of tags to ensure reliable estimation of expression changes. The key question we wanted to answer was whether the U-shape relationship between gene expression change and standard deviation of splicing indices ( Figure 1 B) also exists when using deep sequencing data. Figure 4 shows that this is not the case. Together with the evidence from the dilution experiment, this strongly suggests that the characterized exon array bias is purely technical and does not even partially originate from a biological phenomenon.
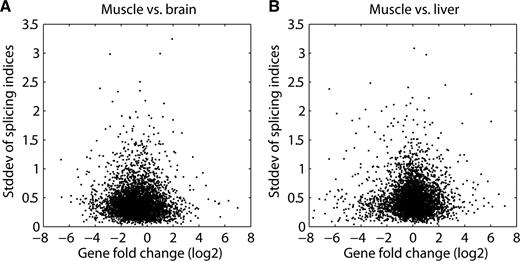
Relationship between transcript-fold change and the splicing index in deep sequencing data. ( A and B ) scatter plots derived from deep sequencing data ( 9 ) comparing the log2 gene expression change ( x -axis) to the standard deviation of the splicing indices belonging to exons of that particular gene ( y -axis).
Comparing exon array data across species boundaries
The positional dinucleotide model indicated that probeset characteristics (slopes) can be explained at least in part by simple sequence features. We, therefore, wondered whether such features could be conserved between species, which would result in the reproducible false detection of apparently conserved alternative splicing events. To test this, we used whole-genome alignments between human and mouse to link mouse probesets to their human homolog counterparts (see Methods section), and compared mouse probeset response slopes obtained from tissue panel data with corresponding human ones. Figure 5 A illustrates that slopes of matching probesets were indeed correlated (Pearson correlation coefficient of 0.426, P << 2.2 × 10 −16 ). This could have been expected since homologous exons typically display substantial sequence similarity. We tested this directly by comparing predicted response slopes of homologous mouse and human probesets, derived from the dinucleotide model trained for each species. As expected, predicted exon response slopes were correlated between mouse and human (Pearson correlation coefficient of 0.588, P << 2.2 × 10 −16 , Figure 5 B). This has profound implications in the context of cross-species exon array studies. If we profiled matching tissues in mouse and human and asked whether or not there was any conservation at the level of alternative splicing then because the technical response behavior of homologous exons is similar, we would expect to see a significant agreement when comparing splicing indices between the two species. In other words, this means that without taking this bias into account, one would always detect a significant number of conserved alternative splicing events even if not present in the samples.
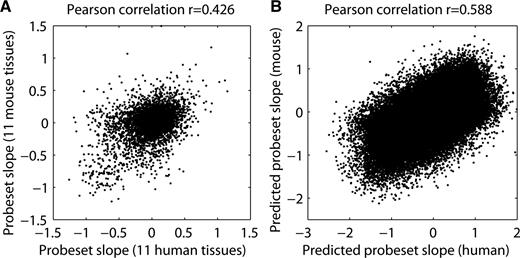
Cross-species exon array comparison. ( A ) A scatter plot comparing mouse to human probeset response slopes (determined from the tissue panel data). Mouse probesets were linked to their human homolog counterparts using whole-genome alignments (see Methods section). ( B ) A comparison of mouse and human exon response slopes based on the predictions from the positional dinucleotide model.
Avoiding and correcting the characterized bias
Having characterized the extent and origin of this systematic bias in exon array data, it is important to determine how to best identify true alternative exons. We will outline four possible approaches that could be applied depending on experimental design and amount of data. The simplest approach is to avoid the artifact by filtering out differentially expressed genes from the analysis ( 12 , 18 ). Based on the U-shaped curves in Figure 1 , it is possible to identify a range of tolerable gene-fold changes that do not display a bias in splicing indices. For example, all curves are almost flat for genes that do not change more than 2-fold (between −1 and +1 in log space. Filtering may, however, be undesirable if alternative exons need also to be detected in differentially expressed genes. A second possibility would be to train a model that predicts probe response slopes based on probe sequence, similar to the positional dinucleotide model presented here. A substantial amount of the artifact can be explained by probe sequence features alone, as discussed above. We think, however, that the prediction accuracy of at least our positional dinucleotide model is not high enough to enable robust correction of the data ( Figures 3 D and E). In most cases, the most accurate correction will be achieved by inferring response characteristics for each probeset directly from exon array data by regression and use this to correct observed splicing indices as a function of gene-fold change. In contrast to the positional dinucleotide model for slope prediction, this approach can only be applied when there are many samples analyzed to accurately estimate probeset response slopes. For example, this approach could be applied to the Affymetrix human and mouse tissue panel datasets, that each contain 11 different tissues, while it would not be robust when applied to data with just two or three different tissues. Finally, we observed that probeset response slopes estimated by linear regression from a training set of 250 arrays covering a large variety of tissues (downloaded from Gene Expression Omnibus) correlate well with those from an independent set of 171 lymphoblastoid cell line samples ( 14 ) (Pearson correlation coefficient of 0.92, Figure 6 A). This illustrates that probeset response slopes are robustly and consistently inferred across experiments from different laboratories, which opens the possibility to globally estimate them from a pool of all publicly available exon array data. These estimated slopes could then be used in the correction of any future experiment independent of the number of analyzed samples (see Methods section). We believe that this approach is the preferred correction method because of its accuracy and robustness. We thus applied this procedure to another independent dataset ( 19 ) comparing universal Human Reference RNA with human brain reference RNA (10 technical replicates each). Figure 6 illustrates the dependency between gene-fold change and splicing index variation, before and after applying the correction (panels C and D, respectively). The U-shaped dependency is to a large extent eliminated by the correction. As an improvement to the linear correction approach, we developed a nonlinear variant called COSIE (COrrected Splicing Indices for Exon arrays, available at www.fmi.ch/groups/gbioinfo ), which is capable of capturing saturation effects of the probesets ( Supplementary Figure 1 ). We applied both correction methods to the test data and counted the number of significant alternative exons ( t -test for each probeset, P < 10 −5 ). The linear correction method reduced the overall number of significant alternative exons by a factor of three and by a factor of six for genes changing at least 4-fold ( Figure 6 B). COSIE reduced the overall number by a factor of 4.4 and 11.9 for genes changing at least 4-fold. This shows that the described exon array bias when not corrected for results in a massive overestimation of alternative exons. The downside of this approach is that response behavior cannot necessarily be estimated for all probesets on the microarray. It is required that probesets are detectable and associated to a gene with a sufficient dynamic range in the training data. Based on our training set, COSIE corrects 95.1% of the 222 858 probesets in the test set. With the publication of additional exon array experiments, the training set will grow and this number will further increase in the future.
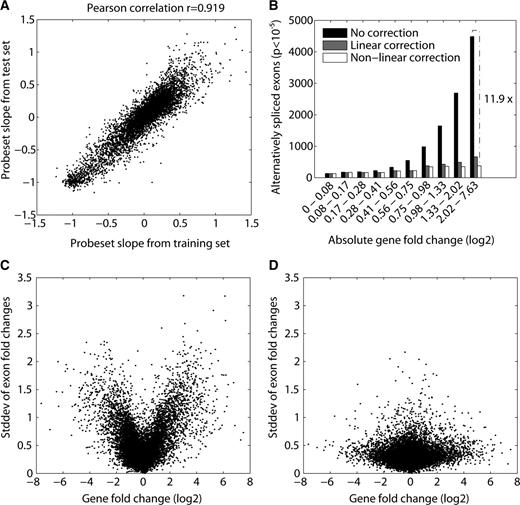
Correcting probeset response behavior. ( A ) A scatterplot, comparing probeset response slopes estimated by linear regression from a training set of 250 arrays (covering a large variety of tissues) to those from an independent set of 171 lymphoblastoid cell line samples ( 14 ). ( C and D ) The dependency between gene-fold change and splicing index variation (human universal RNA versus human brain RNA), before (C) and after (D) applying a correction based on a linear model using probeset slopes derived from the training set (250 arrays). ( B ) The number of significant alternative probesets detected in the uncorrected data compared with the corrected data using the linear and the nonlinear model ( t -test for every probeset based on 10 replicates, Pcutoff < 10 −5 ). The bar-groups represent equally sized populations of genes binned according to absolute gene-fold change.
CONCLUSIONS
We have characterized a technical bias of Affymetrix exon arrays that plays an important role in identification of alternative exons for differentially expressed genes. For similar samples with only few differentially expressed genes, this effect is strongly reduced, even though not absent. The effect is driven by differences in the response curves of individual microarray probes and can be partially explained by simple sequence features. These sequence-specific response characteristics are independent of the array design as similar response characteristics were observed for both human and mouse arrays. Gene expression levels can be robustly estimated on exon arrays, presumably because the signal for each gene is condensed from a large number of probes resulting in the different response characteristics of individual probes to be diluted. However, for identification of alternative exons, relying on exon levels typically measured from only four probes, the distinct behavior of individual probes plays an important role. We have shown that this is a global phenomenon that applies equally to mouse and human exon arrays and its magnitude is sufficiently large that it accounts for an important fraction of the observed significant alternative exons. Based on a dilution experiment and by comparison with deep sequencing data, it can be concluded that this effect is primarily of technical rather than of biological origin. Finally, we have developed a software in R called COSIE that for any given set of new exon array experiments corrects for the observed bias (available at www.fmi.ch/groups/gbioinfo ).
FUNDING
Novartis Research Foundation. Funding for open access charge: Novartis Research Foundation.
Conflict of interest statement . None declared.
ACKNOWLEDGEMENTS
We thank Andrew Su and John Walker (Genomics Institute of the Novartis Research Foundation, San Diego, CA) for providing unpublished exon array data that was included in the training of the mouse correction parameters.

Comments