


Abstract
We examine a well-resolved lensed image that is bent by an edge-on lenticular galaxy, in the Hubble Frontier Fields (HFF) data of MACSJ0416.1−20403. The fortuitous combination of a long arc (zs ≈ 1 ± 0.2) intersecting an edge-on galaxy from the cluster (z = 0.4) provides an opportunity to constrain its dark matter (DM) halo and its orientation. We model the stellar lensing contribution and we add to this a standard parametrized dark halo component. Irrespective of the detailed choice of parameters, we obtain a combined total mass of ≈3 × 10¹¹ M⊙. Depending on the dark halo parameters, the stellar contribution to this is limited to the range 5–15 × 1010 M⊙, or 20–50 per cent of the total mass, in good agreement with the independent (photmetric) stellar mass of 5 × 10¹⁰ M⊙ (Chabrier IMF), or 8 × 10¹⁰ M⊙ (Salpeter IMF). The major axis of the DM halo is constrained to be nearly orthogonal to the plane of the galaxy, and with an ellipticity e ≈ 0.15 corresponding to an axis ratio a/c = 0.54. We show that these conclusions are very weakly dependent on the model of the cluster, or the additional influence of neighbouring galaxies or the properties of the lensed source. Alternative theories of gravity that do not require DM are challenged by this finding since generically these must be tied to the baryonic component which is highly disfavoured by our results. Other such fortuitously useful lenses can be examined this way as they become uncovered with more HFF data to help provide a more statistical distribution of galaxy halo properties.
1 INTRODUCTION
Data from the Hubble Frontier Fields1 programme (Lotz 2013) is providing exquisite precise observations of lensing distortions around galaxy clusters. Clusters observed under this programme routinely contain tens of multiply lensed systems with well-defined colours that help identify counter-images. The abundance of strong lensing observables allows for an unprecedentedly detailed reconstruction of the dark matter (DM) distribution. We recently studied one of these clusters, MACSJ0416.1−2403, at z = 0.4, using the Hubble data. A precise model for the distribution of DM was obtained based on the gravitational lensing effect (Diego et al. 2015). Among other results, we found yet another example of a cluster halo without a pronounced cusp at its centre while numerical simulations predict that cold dark matter (CDM) form haloes with the density monotonously increasing towards the centre.
The tremendous success of the CDM model is being challenged by these types of inconsistencies between observations and predictions. Alternative models have been proposed invoking changes in the laws of gravity (Milgrom 1983; Sanders & McGaugh 2002; Clifton et al. 2012; Khoury 2015) that aim at explaining the observations without invoking the existence of DM. Some of the most popular alternative theories to CDM adopt a modified version of the laws of gravity and assume that there is no DM and the source of the gravitational force is in the baryonic matter itself. These alternative models had relative success in explaining some observations like rotation curves of galaxies but they have also been seriously challenged by observations of galaxy clusters where the source of the gravitational potential does not seem to always follow the bulk of the baryon component. One of these clusters is the bullet cluster where two clusters have crossed each other separating the plasma from the galaxies. As the plasma contains most of the baryonic mass in the cluster, these alternative models clearly predict the minimum of the gravitational potential to be at the position of the plasma, which contains most of the baryonic mass in the cluster. Instead, detailed analyses of the gravitational lensing effect around this cluster reveal that the minimum is located where the CDM model predicts, around the galaxies and their associated, and invisible, DM haloes. Other clusters show similar patterns, suggesting that the galaxies must have a large portion of DM around them. What these observations cannot tell in detail is the exact distribution of DM. Hence, it is still (in principle) possible that the source of the gravitational potential is associated with the galaxies rather than the diffuse gas, or DM halo. Unfortunately, the analysis of the gravitational lensing effect suffers important degeneracies. Results derived from gravitational lensing effect are very accurate in the prediction of the mass contained within certain radius, but in most cases they cannot provide accurate additional information about how the mass is distributed within that radius.
As a result, some room still exists for alternative theories where the baryons (i.e. the galaxies) are still the main source of the gravitational potential. Intriguingly, the success of lensing reconstruction methods based on the simple assumption that light traces matter suggests the existence of a strong link between the baryons and the DM while in theory, at the scales of the galaxies, DM haloes are expected to adopt triaxial shapes which do not necessarily need to be aligned with the galaxies they host (as suggested by numerical N-body simulations). The test proposed on this work and based on edge-on secondary lenses (EOSL), offer a unique opportunity to test cases where the baryons adopt an extreme distribution. If the baryons are the source of the gravitational field, whether gravity obeys a standard 1/r2 law or not, the extreme geometry should be reflected in the lensed background galaxy. If on the other hand, baryons are not the main source of the gravitational field (as expected for the standard LCDM model), the EOSL galaxy may reveal the need for a halo of DM surrounding the galaxy which is morphologically distinct from the peculiar geometry of the EOSL and that would directly challenge theories of modified gravity. EOSL galaxies take advantage of the lensing power of the galaxy cluster to stretch a background galaxy. The magnifying power of the host cluster stretches the background galaxy to produce nearly straight and featureless arcs. These elongated arcs are ideal background sources when relensed by a secondary lens. We note that the lensing distortion does not distinguish between the deflection from the host cluster and the secondary lens but mathematically we can separate the two effects. When the two lenses (cluster and EOSL) are in the same lens plane, the deflection angle, which is an integrated effect, can be viewed as a linear superposition where a background galaxy is first lensed by the host cluster and later lensed again by the secondary lens. In selected regions of the cluster where straight arcs are more likely to appear, the dominant deflection field from the galaxy cluster is able to transform an intrinsically small background galaxy (with unknown intrinsic shape) into an elongated arc with a shape that can be well approximated by a straight elongated line. If this arc is elongated enough, it can provide a wide range of angular distances over which one can test the deflection field from the EOSL. An example of this effect is shown in Fig. 1. Two prominent and very elongated arcs, marked A and B, can be seen in this image. These arcs are found in the south-west sector of the cluster MACSJ0416.1−2403 and beyond the Einstein radius. In the case of arc B, the distortion is mostly due to the host cluster with no nearby secondary lens affecting the arc. Using the lens model derived by Diego et al. (2015), we are able to predict the estimated orientation produced by the lens model at this position and we find that the predicted and observed orientations agree to within 3 deg. The straight nature of the arc B is an indication of the smoothness of the deflection field of the cluster in this region of the lens but also of its orientation. While no nearby galaxies are found near arc B that could distort this smoothness, the contrary occurs in arc A. In this case, the straight arc gets significantly distorted by the presence of a galaxy that adds a distortion to the smooth deflection field from the cluster. The edge-on galaxy responsible for the lensing effect has a photometric redshift consistent with being a cluster member zphot = 0.42 ± 0.06 so from now on we assume it is a cluster member at the same redshift of the cluster, z = 0.4. The difference between arcs A and B summarizes in a graphical way the power of the test proposed in this work. The cluster contributes to the effect by producing a very elongated nearly-straight arc with an orientation that can be constrained by the derived deflection field from the cluster (like in arc B). A galaxy member can introduce a correction to this effect and distorts the straight arc (like in arc A). This distortion depends, mostly, on the mass distribution of the EOSL. The power of this test resides in the combination of the two effects. The cluster produces an image with a known shape (a straight line with a well-constrained orientation) reducing one of the uncertainties in lensing reconstruction (the unknown intrinsic shape or orientation of the background galaxy). The magnifying power of the cluster produces also large elongated arcs. Long arcs are useful to constrain the shape of the mass distribution of the secondary lens over a wider range of distances. As opposed to Einstein rings that mostly constrain the mass enclosed in the ring (that is in the radial direction), the arc A aligns in a perpendicular direction to the lens effectively proving the two directions, radial and tangential, and thus exposing the real geometry of the lens. The EOSL adds a local correction to the deflection field that can be used to constrain the distribution of the mass in the member galaxy. If the member galaxy is found to be edge-on (like the member galaxy lensing arc A in Fig. 1), then the sensitivity to the mass in the halo versus the mass in the baryons gets maximized as the DM is not expected to concentrate in disc-like formations. Collisionless DM behaves very different than baryonic matter and tends to form triaxial haloes, not discs. If the best model for the EOSL is found to concentrate most of the mass in the disc region, this would have profound implications for the nature of DM since it would require DM to share some of the properties of baryons (like self-interaction) in order to explain such a distribution or provide immense support to theories of modified gravity. If on the contrary, the best model for the EOSL requires an extended halo of DM around the galaxy with a very different spatial distribution, this result would represent a new challenge for models of modified gravity that require the baryonic matter to be the source of the gravitational potential.
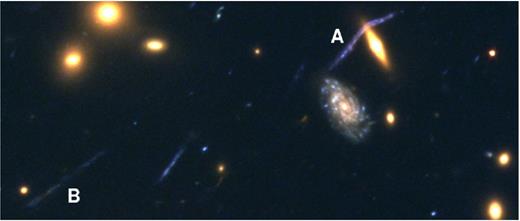
The background galaxy (|$z_{\rm phot} = 1.0^{+0.2}_{-0.3}$|) lensed by the EOSL (zphot = 0.42 ± 0.06) is marked with A. The EOSL galaxy is shown saturated here but it exhibits a thin disc and a very small bright nucleus. Another very elongated straight arc nearby is marked with a B. The orientation of arc B agrees well with the expected orientation from the lens model. The field of view is 31.4 × 13.2 arcsec2.
In this paper, we apply the EOSL test to the lensed galaxy A shown in Fig. 1 and derive constraints on the mass distribution of the EOSL galaxy. The EOSL galaxy is located at RA = 04h16m04|${^{\rm s}_{.}}$|094, Dec. = −24°05′22|${^{\prime\prime}_{.}}$|44 (J2000).2 In Section 2, we describe the method used in this paper. In Section 3, we present the main results from our analysis. We discuss possible sources of systematics and alternative models in Section 2.1 Throughout the paper, we assume a cosmological model with ΩM = 0.27, Λ = 0.73, H0 = 70 km s−1 Mpc−1. For this model, 1 arcsec equals 5.42 kpc at the redshift of the cluster.
2 METHODOLOGY
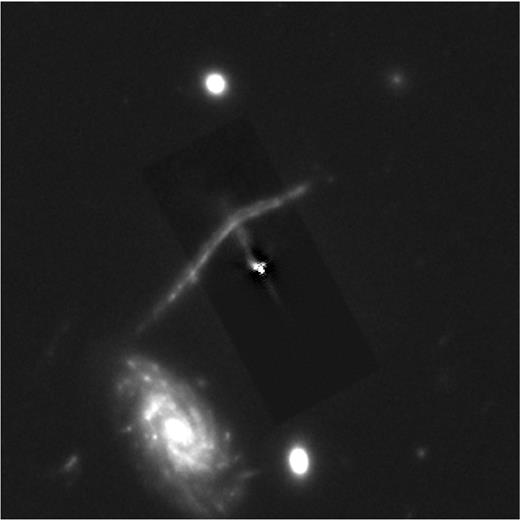
Background lensed galaxy after partially removing the foreground galaxy (lens). The field of view is 12 arcsec across.
In addition to the ellipticity, we allow the DM halo to have a given orientation, α, with respect to the normal of the EOSL disc. That is, the value α = 0° corresponds to the case when the longest axis, c, is perpendicular to the plane of the galaxy disc. When α = ±90° the longest axis of the triaxial DM halo, c, is aligned with the galaxy disc. As mentioned earlier, for the mass distribution we adopt a triaxial Navarro–Frenk–White (NFW) profile (but with the two axis, a and b taking identical values). We simulate the DM spheroids by projecting the 3D triaxial NFW profile with the three axis rescaled by the corresponding a, b and c for a given e. If a = b and c = 1, given e, a (and b) is determined as, a = (1 − 2e)/(1 + 2e). The values of the NFW concentration parameter and virial radius are fixed to C = 3 and R200 = 15 kpc, respectively. A low value for C was chosen to maximize the sensitivity to the DM profile around the distance of the lensed galaxy. The value R200 = 15 kpc is chosen based on the extent of the luminous matter (a bit less than 15 kpc). Other alternative values will be discussed later together with their implication.
Our lens model is then described by four parameters, MEOSL, MDM, e and α. MEOSL refers to the total baryonic mass that has a distribution that follows the observed flux of the EOSL. MDM accounts for the total mass of the triaxial halo around the EOSL, e is the ellipticity of the triaxial halo which can take values from e = 0.0 to 0.3 and α accounts for the orientation of the halo with values of −90° < α < 90°. Again, the case α ∼ ±90° corresponds to the particular case where the DM halo and the EOSL are aligned (this case mimics the scenario where the DM halo is oblate but with the longest axis aligned with the EOSL disc) and α ∼ 0° is the case when they are perpendicular (like in Fig. 5). Values of e ≈ 0 correspond to DM haloes that are nearly spherical.
In addition to modelling the lens, a model is needed for the background source. In this case we take advantage of the dominant magnifying power of the cluster. The dominant lensing effect of the cluster near the position of the arc is twofold. First, the cluster introduces an orientation in background lensed sources. This can be appreciated for instance in arc B in Fig. 1. Secondly, the magnifying power of the cluster stretches the background source as can be appreciated also in arc B in Fig. 1. The combined effect produces an ideal source to be relensed by a secondary lens by offering a large cross-section for the lensing effect but also a nearly constant inclination of the background source. Using the lens model derived in Diego et al. (2015, in particular, we used case II in that paper where the EOSL galaxy was included as part of our model), we can estimate the expected average orientation of the background source at the position of the observed arc (after removing the effect of the EOSL from our lens model). The model predicts that a background source that is lensed into this position should have an inclination of 37 deg with respect to the horizontal line in Fig. 1. As any other model, the one used in this work is not free of error so this estimate should be taken only as an approximate value. However, by looking at nearby arcs we find that this estimate is close to what is observed in neighbouring arcs. For instance, the nearby arc B in Fig. 1 has an inclination of 34 deg with respect to the horizontal line. Also, small departures from the predicted inclination are expected due to the intrinsic inclination of the background source. However, this should be only a minor correction when compared with the inclination induced by the dominant lensing effect of the cluster. To include the uncertainty in the orientation of the background source (after accounting for the cluster-induced orientation) and uncertainties in our cluster lens model we explore a range of orientations, θ. This variability is also recommended to account for possible errors in the lens model that could be produced by incomplete sky coverage of the lensing constraints (more concentrated around the centre of the cluster) or missing substructure in our lens model. This second possibility will be considered in more detail in Section 2.1.
The position of the background source with respect to the centre of the EOSL is also varied, since there is a degeneracy between the lens mass and the source position that needs to be accounted for. The source model is then described by two parameters, the inclination, θ, and the separation (or impact parameter), Δp, with respect to the centre of the EOSL. For convenience we choose Δp not with respect to the centre of the EOSL but with respect to the zero-point that lies in between the centre of the EOSL and the background lensed galaxy. The zero position of the lensed arc is defined as the position at which we would see the straight arc if the EOSL was not in between the observer and the arc. Δp can take positive or negative values depending on whether it is closer to the lensed arc or to the EOSL, respectively. The global effect of the cluster is taken into account by modelling the background source as an elongated arc with a given length and a given inclination (θ parameter above). For clarity, we show in Fig. 3 a source model (cyan straight line) before being lensed by the EOSL. The cyan line is how the galaxy should have been observed if only the cluster and substructure not included in our lens model were acting as the gravitational lens. Using our mass model for the cluster derived in our earlier work, we derive the deflection field from the cluster at the position of the EOSL. This predicted deflection field is expected to deviate from the real underlying filed by some amount. However, as long as the deflection field from the cluster changes in a smooth way around the EOSL galaxy, the uncertainties in the cluster deflection field around the EOSL translate only into uncertainties in the parameters Δp and θ, as will be shown more explicitly below in Section 2.1.
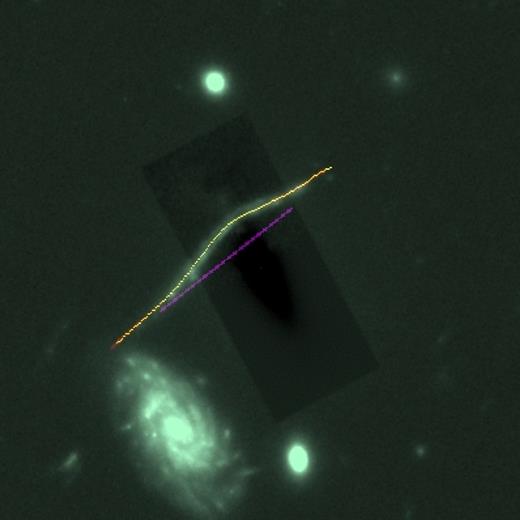
Lensed galaxy compared with a typical good fit model showing the background source in purple.
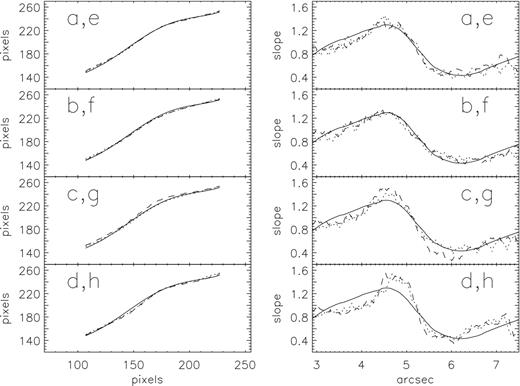
Best-fitting models listed in Table 1 compared with data. The left-hand panels represent the fit in the image plane while the right-hand panels show the slope of the lensed arc versus the x-coordinate in pixels. The dotted lines correspond to the set of best-fitting models a, b, c and d (obtained after fixing the mass of the spiral galaxy to Mspiral = 5 × 10¹⁰ M⊙). The dashed lines are for the set of best-fitting models e, f, g and h (obtained after fixing the mass of the spiral galaxy to Mspiral = 22 × 1010 M⊙). The solid line shows the data used in the fit. The pixels in the x- and y-axis refer to pixels in the ACS original image (0.05 arcsec pixel−1).
In Fig. 4, we show both the slope and position of the arc used to build the χ2 compared with the predicted position and curvature of a set of models that will be discussed in more detail later. The curvature is more sensitive to the details of the mass distribution near the galaxy disc. This measurement is important to discriminate between models that contain the mass concentrated in the disc or spread over a wider region.
2.1 The effect of missing substructure
From Fig. 1 it is evident that the spiral galaxy to the south-east of the EOSL may have a non-negligible effect. An estimation of the stellar mass of this spiral galaxy (and the EOSL) can be obtained based on the photometry. The stellar mass is derived after assuming an initial mass function (IMF). We adopt a standard Chabrier IMF to estimate the stellar masses of the spiral galaxy and find Mspiral = (1.3 ± 0.3) × 1010 M⊙. We estimate also the stellar mass of the EOSL. We obtain MEOSL = (5.0 ± 1.1) × 1010 M⊙ (for the Chabrier IMF). For a Salpeter IMF the mass is slightly larger, MEOSL = 8 ± 21010 M⊙. These values will be discussed later in Section 3. The mass of the spiral is then expected to be smaller than the mass of the EOSL but in principle not negligible. In addition, in a recent paper (Jauzac et al. 2015), the authors present a lens model based on combined weak and strong lensing data with the weak lensing data covering a larger field of view that reaches beyond the EOSL. They find evidence for a substructure, denoted by S1 in their paper, and located ≈140 kpc south of the EOSL.
If these substructures have significant masses, they may introduce an additional gradient in our lens model. Since both, the spiral galaxy and S1, are located to the south of the EOSL, the effect of the gradient would be to reduce the inclination angle for the source. This can be appreciated easily if we consider the extreme, albeit unrealistic, case where the dominant effect is due to the spiral and/or S1 substructure instead of the cluster. In this case, the inclination angle would be θ ≈ 0° since the substructure is immediately below (south) the EOSL and its effect on the background galaxy would be to stretch it horizontally (i.e. θ ≈ 0°). If the spiral and S1 have a non-negligible effect at the position of the EOSL, we should expect the inclination angle to be smaller than the predicted θ = 37° (that is, somewhere between 37 and 0 deg). In fact, if we perform our fit ignoring the effect of substructure like the spiral galaxy and the structure S1 in the south, the best-fitting models show a strong preference for values of θ that are almost 10 deg lower than the predicted value of θ = 37°. A degeneracy between θ and the mass of the spiral galaxy and/or S1 is expected. The exclusion of the spiral galaxy in our model results in a smaller than expected θ, that accounts for the missing structure, in good agreement with the hypothesis that the spiral and/or S1 play a non-negligible role in the determination of the tilt angle.
Since the spiral galaxy and the structure S1 are both lying in the same direction (south) from the lensed galaxy, their lensing effect have the same direction and can be combined into a single effective one. We then consider the mass of the spiral galaxy as an effective mass that takes into account the masses of the spiral and S1 together with their respective distances to the lensed arc. The role of the spiral galaxy (and S1) is tested in our model by including a spherical DM halo at the position of the spiral. We consider two scenarios. In the first one, we adopt a relatively small mass for the spiral of 5 × 10¹⁰ M⊙. This mass is approximately four times the mass of the stellar component estimated with a Chabrier IMF and should be considered as a reasonable lower limit for the total mass of the spiral galaxy plus S1 structure. In the second scenario, we assign a mass to the spiral of 2.2 × 10¹¹ M⊙. This mass is particularly high but not unreasonable if we keep in mind that the spiral galaxy accounts also for the effect of the S1 structure. In both cases, we assume an NFW spherical halo with concentration C = 7 and R200 = 30 kpc. The particular choice of shape, concentration and virial radius has a very small impact on the results, with the total mass being the most important parameter. Given their location in relation to the EOSL, both masses, from the spiral and S1 structures, are expected to be degenerate so a high derived mass in the spiral may be due to the non-negligible effect of S1.
We should emphasize that the goal of this test is not to constrain the mass of the spiral galaxy but to test the robustness of our results and to identify changes in the best-fitting model when some mass is allowed in the south sector of the EOSL so the particular choice of parameters for the spiral galaxy is not relevant for our purposes. Since our best-fitting models are significantly determined by the slope of the lensed arc, structures that are farther than a few tens of kpc from the lensed arc have a very small impact on this data set and are mostly degenerate with respect to the properties of the background source, like the inclination angle θ and position Δp, as will be discussed later. For clarity, we include in Fig. 5 the geometry of the lens plane including the three ingredients, the baryons in the EOSL, the EOSL DM for the case of e = 0.15 and the spiral DM halo. As discussed below, this particular geometry is representative of the best models found in our analysis.
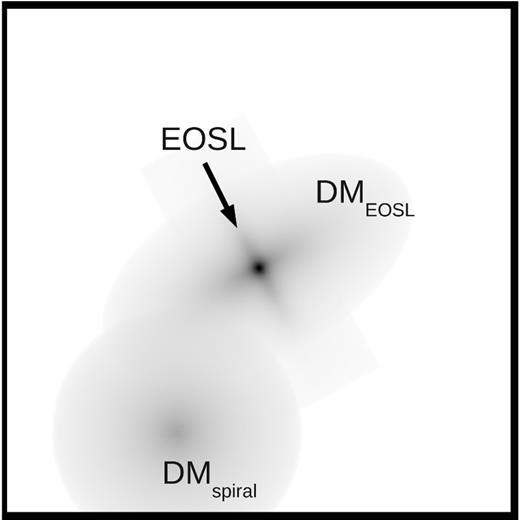
Geometry of the lens plane. The three elements of the lens plane are marked. The EOSL DM corresponds to the best model, a, in Table 1 with e = 0.15, and α = 0°.
3 RESULTS
After computing the likelihoods for a grid of models (we compute two million models), there is a range of models that are consistent with the observed lensed arc. In Fig. 4, we show a selection of particular models that are interesting to discuss in more detail. All models shown in this figure are listed in Table 1. Model a (and e) is the best model that is found when the mass of the spiral is fixed to Mspiral = 5 × 10¹⁰ M⊙ (or Mspiral = 22 × 1010 M⊙). Both the position of the arc and its derivative agree well with the observed arc and slope. For this model, the mass of the EOSL agrees better with the estimate of the stellar mass for the Salpeter IMF. The mass of the associated DM halo is relatively low compared with the baryonic component but we have to keep in mind that our reconstructed DM mass accounts mostly for the mass contained in the region that is sensitive to the lensing data. Our ability to constrain the mass distribution beyond the lensed arc is hence limited. The orientation of the DM halo is around α = 0° that corresponds to the long axis of the DM halo being perpendicular to the EOSL disc. The ellipticity takes reasonable values which are consistent with expectations. Forcing the EOSL galaxy to have a much smaller mass, like in model b (and f) results in an increase of the mass of the DM halo that compensates the reduction in baryonic mass and without affecting much the other parameters. In particular, the best model still prefers an orthogonal orientation for the DM halo. A similar behaviour is observed when forcing the ellipticity to be very small (similar to the spherical halo) like in model c (and g). On the contrary, if we force the baryons to be the source of the lensing distortion like in case d (and h), the EOSL prefers a mass significantly higher than our stellar mass estimates but even in the best case, the fit is not satisfactory suggesting that this geometry is not able to reproduce the observations. Models d and h can be interpreted as a MOdiefied Newtonian Dyanamics (MOND)-like model where no DM halo is needed to describe the observations. In a truly MOND model, the masses derived for the EOSL would be smaller than the ones in models d and h and even probably consistent with the stellar mass, but like in models d and h, a MOND model may not, in principle, reproduce the observed arc as well as models that include a DM halo around the EOSL. This is an important result that directly challenges MOND-like models. Despite the problems of LCDM at explaining some observations at small scales and the success of MOND to explain some of these observations (see for instance a recent compilation by McGaugh 2014), our results support the hypothesis of an extended halo that is orthogonal to the baryonic component. A truly MOND-like analysis would be required to categorically claim that MOND models are in trouble. In these models, the role of distant substructure, for instance, may be more relevant than what is assumed in our work. However, it seems unlikely that external substructure, whether gravity follows MOND or not, may be able to explain the stretch of the lensed galaxy in the direction orthogonal to the EOSL disc. It is important to note also, that additional degrees of freedom in our model may be able to reconcile models like d and h with the observations. For instance, we have not considered the case where the background source has an intrinsic curvature. The curvature of the background source could be fine-tuned ad hoc around the central region to account for the discrepancy between models d, h and data. This is however a remote possibility that also lacks a real motivation. Also, it is important to emphasize that models d and h are insensitive to the parameters of the DM halo since for models d and h the DM mass halo is set to zero.
Best-fitting models represented in Fig. 4. Models a, b, c and d correspond to the case where the mass of the spiral galaxy is fixed to 5 × 10¹⁰ M⊙. Model a corresponds to the global best fit. Model b is the best model when the EOSL mass is forced to take the lowest value of our grid of parameters. Model c is the best model when the DM ellipticity is forced to be very small (e = 0.01). Model d is the best model when the mass of the DM halo is forced to be zero. Models e, f, g and h are the equivalents to a, b, c and d but when the mass in the spiral galaxy is fixed to 22.0 × 10¹⁰ M⊙. The last column shows the value of the χ2 relative to the χ2 of the best model (a). The quoted errors correspond to half the bin width in our multidimensional grid.
| Model | θ(°) | Δp(pixel) | e | α(°) | EOSL(1010 M⊙) | DM(1010 M⊙) | χ2 |
|---|---|---|---|---|---|---|---|
| ±1 | ±1 | ±0.025 | ±7.5 | ±0.4 | ±1.0 | ||
| a | 32 | −2 | 0.15 | 0 | 11.02 | 18.57 | 1.00 |
| b | 32 | −2 | 0.1 | 0 | 2.86 | 28.77 | 1.38 |
| c | 32 | −2 | 0.01 | 0 | 4.49 | 32.85 | 1.15 |
| d | 36 | 4 | – | – | 18.97 | 0.0 | 2.97 |
| e | 38 | −2 | 0.15 | 0 | 12.65 | 14.49 | 1.18 |
| f | 38 | −6 | 0.1 | −15 | 2.86 | 32.85 | 1.46 |
| g | 38 | −2 | 0.01 | −60 | 14.28 | 24.69 | 2.01 |
| h | 40 | 0 | – | – | 21.42 | 0.0 | 3.27 |
Regarding the degeneracies between the different parameters, we study them by marginalizing the likelihood. The results are shown in Fig. 6 for the two cases described above. The dotted line curves correspond to the case Mspiral = 5 × 10¹⁰ M⊙ and the dashed lines for the case Mspiral = 22 × 1010 M⊙. A few interesting conclusions can be made from these results. First, there is a degeneracy between MEOSL and MDM that can be approximated by the line MEOSL + MDM ≈ 3.0 × 10¹¹ M⊙. This is not surprising. From this degeneracy, and to first order, the total mass of the galaxy can be well constrained. To second order, we see from the one-dimensional probabilities that among the models with the same total mass, those that are more favoured are the ones with a baryon to DM ratio ≈0.5 in agreement with recent findings based on microlensing (Jiménez-Vicente et al. 2014). It is important to note that this ratio accounts for the mass contained within a given radius and that it should not be regarded as the total mass of the galaxy. If the DM halo extends beyond the arc and with a symmetric distribution, the lensing distortion over the arc would be insensitive to the outer layers of mass. When comparing the derived lensing mass for the EOSL galaxy with the mass obtained photometrically (see beginning of Section 2.1), the best mass of the EOSL (from lensing) is in good agreement with the mass estimated photometrically, in particular with the case of the Salpeter mass function.
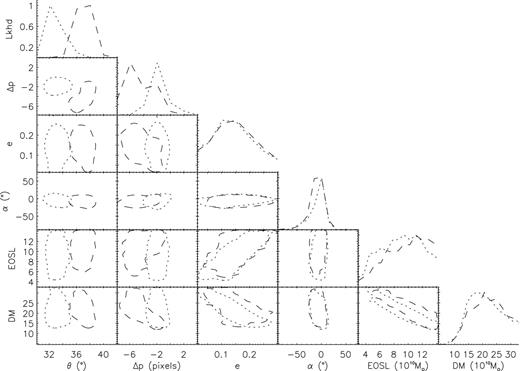
Posterior probabilities for the parameters in our model. The one-dimensional plots correspond to the normalized (to 1) probability. The contours correspond to 68 per cent of the total of the marginalized probability. The dotted line probabilities are for the case when the mass of the spiral galaxy is fixed to Mspiral = 5 × 10¹⁰ M⊙ and the dashed lines are for the case when Mspiral = 22 × 1010 M⊙. Note how changes in the mass of the spiral basically only affect the parameters of the background lensed source, θ and Δp.
Another very interesting conclusion is the fact that the data clearly favours models where the DM halo is aligned perpendicular to the disc of the galaxy (α = 0°) as opposed to aligned with it (α = ±90°). We consistently find a prominent peak in the likelihood around values of α = 0. Such a clear preference for a perpendicular alignment between the baryonic disc and the DM challenges again models of modified gravity since a simple variation in 1/r2 could not account for this evident preference. Considering alternative laws to gravity would result only in changes of the gradient of the mass (with respect to the radius), but not on its relative distribution or geometry. The ellipticity is not constrained as well as the other halo parameters but there seems to be a preference for typical ellipticities e ≈ 0.15 in good agreement with simulations.
In general, the best parameters describing the EOSL (and its DM halo) show a weak dependency with the mass of the spiral. This is expected as any source of gravitational potential farther than the EOSL should contribute mostly as a gradient in the deflection angle at the position of the lensed arc. Such gradients are degenerate with the parameters describing the source parameters θ and Δp. This degeneracy is explicitly shown in the likelihoods of the orientation angle of the source θ and the relative position Δp. The likelihoods of these parameters show the largest shifts when the mass of the spiral is changed. An increase in the spiral mass (or in the mass of S1) can be compensated by an increase in the tilt angle of the background source and/or a change in the relative position. Increasing the mass in the spiral brings the preferred value towards the centre of the EOSL (the centre of the EOSL corresponds to Δp = −21 pixels) in order to counter effect the increase in deflection angle from the spiral galaxy.
The derived constraints show also some dependency with the assumptions made about the parameters of the NFW profile used to simulate the DM halo. In Fig. 7, we show the constrains in the MEOSL–MDM plane obtained when the concentration and virial radius are modified within reasonable limits. The remaining parameters are fixed to the values of model a listed in Table 1. Changing the concentration parameter by a factor 3 results in a small shift along the degeneracy region. Increasing the virial radius by a factor 2 results in a higher total mass for the DM halo. However, this is mostly due to the fact that the DM halo is now larger. The mass enclosed in the region defined by the lensed arc remains more or less unchanged. In particular, comparing the best models obtained with the R200 = 15 and 30 kpc radius and taking the mass of the larger halo that is enclosed in the footprint of the smaller halo, we find that both masses agree to within 3.5 per cent.
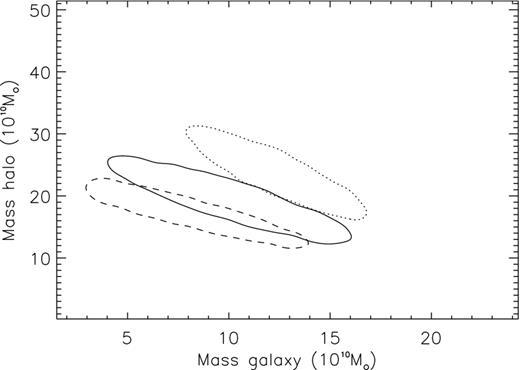
Likelihood as a function of the masses of the galaxy and the halo for three different assumptions about the DM halo profile. The three contours correspond to the 68 per cent confidence region. The solid line corresponds to our standard DM halo with a small concentration (C = 3) and small virial radius (R200 = 15 kpc). This is the case that was assumed for the main results in our paper. The dashed line is for the case of a concentration three times larger (C = 9) and the same virial radius (R200 = 15 kpc). The dotted line is for the case of small concentration (C = 3) and larger virial radius (R200 = 30 kpc).
In the results presented above, we have assumed that the DM halo is prolate. We have checked that our results remain unchanged when we consider oblate models instead so we can conclude that our test is insensitive to the differences between prolate and oblate models. Finally, in our results we have fixed the redshift of the lensed galaxy at zs = 1 (photo-z estimated with Bayesian Photo-Z (BPZ) estimates the redshift for the background source between 0.7 and 1.2). This redshift is rather arbitrary, however we should note that a different redshift would have an impact only on the masses which are degenerate with the redshift of the source. For example, for our particular cosmological model, assuming the background source is at zs = 0.7 would result in derived masses that are 39 per cent higher to compensate for the reduction in deflection angle. On the other hand, adopting zs = 1.2 would result in a decrease of the masses by 11 per cent.
4 DISCUSSION
Perhaps the most important result is the strong preference for models that include an extended halo of DM. Also, the DM halo prefers to be aligned perpendicular to the plane of the galaxy (α = 0). N-body simulations predict that, although this scenario is possible, is not the most likely. Bailin et al. (2005) conclude that the inner halo is aligned such that the halo minor axis aligns with the disc axis in clear opposition with the findings in our work that suggest that it is the longest axis, the one that is aligned with the disc axis. Also, in DeBuhr, Ma & White (2012), the authors use N-body simulations to study the relative orientation between the stellar discs and the DM haloes. They find that regardless of the initial orientation of the disc, the inner parts of the haloes contract and change from prolate to oblate. The authors explain also how this behaviour is found also when the initial condition is similar to the best model found in this work. According to the authors, when the major axis is aligned with the disc's normal, the length of the major axis quickly contracts and becomes the minor axis. More recently, using Sloan Digital Sky Survey (SDSS) data, Loebman et al. (2014) found that oblate models are also favoured for the halo around our Galaxy.
On the other hand, and although not necessarily connected with our results, a similar puzzling situation is observed with the distribution of satellites around some galaxies. Recent studies based on the distribution of satellites around galaxies find that they concentrate in a thin disc in contradiction with expectations. In Ibata et al. (2013), the authors find a thin structure (with an inclination of 59° from the galactic disc) around M31 which is at least 400 kpc in diameter, and extremely thin (perpendicular scatter of less than 14.1 kpc). A similar conclusion is reached independently in Hayashi & Chiba (2014). Our own galaxy, exhibits a similar feature (Kroupa, Theis & Boily 2005; Pawlowski & Kroupa 2014) with the satellites concentrating in the polar directions of the Milky Way (inclination of 88° with respect to the Galactic plane; Metz, Kroupa & Jerjen 2007, see also Law, Majewski & Johnston 2009). The existence of these co-orbiting planes of subhaloes remains as a puzzle for standard models of structure formation (Pawlowski & McGaugh 2014).
Using N-body simulations, Bowden, Evans & Belokurov (2013) study the likelihood of having such narrow discs of satellites and find that such configuration is only possible when the disc lies in the planes perpendicular to the long- or short axis of a triaxial halo (α = 0° or 90°). In Zentner et al. (2005) and using N-body simulations, the authors find that subhaloes are distributed anisotropically and are preferentially located along the major axis of the triaxial mass distributions of their hosts. These numerical simulations, together with the observational evidence about the inclination of the satellite plane may support an scenario where the DM halo adopts a prolate (or oblate) distribution with its long axis perpendicular to the galactic disc, in a similar fashion to what our results seem to suggest. Similarly, there is observational evidence from polar ring galaxies that some galaxies may have a similar geometry with a DM halo that is aligned perpendicularly with the host galaxy (Iodice et al. 2003; Moiseev et al. 2011; Snaith et al. 2012; Khoperskov et al. 2014). Polar ring galaxies have been proposed also as good places to test alternative gravitational models. Interestingly, some of these alternative models have been successful at reproducing their rotation velocities (Lüghausen et al. 2013).
More sophisticated N-body simulations that focus, for instance, on the effects of tidal forces in the orientation of subhaloes in clusters may be needed to answer this question. In Diego et al. (2015), the authors discuss how this cluster is undergoing a collision in a direction close to the line of sight and how the two cores are not merging face-on but instead with a significant impact parameter. Simulations, and the fact that one of the X-ray peaks, and perhaps the peak of one the DM haloes, are displaced with respect to the dominant cD galaxies suggest the presence of strong tidal forces. Whether these tidal forces may have an impact in the orientation of the DM halo around the EOSL or even directly affect the stretch of the deflection field around the lensed arc is an open question.
An added advantage of the test presented in this work (based on EOSL) is that the results that can be derived are independent on whether gravity follows a 1/r2 law or not. Adopting a different law for gravity would result in different values for the masses of the haloes MEOSL and MDM but it should not, in principle, affect the geometry of the solution. Our findings clearly suggest the need of an additional halo of DM that does not trace the baryonic component.
5 CONCLUSIONS
EOSL offer a unique opportunity to study the DM distribution around galaxies. When an EOSL is embedded in a massive galaxy cluster, the monopole lensing component from the cluster helps in magnifying the background galaxy, effectively stretching the background source behind the secondary lens galaxy. The stretch provided by the galaxy cluster helps constraining the DM by reducing some of the degeneracies inherent to lensing reconstruction but also by producing a straight magnified background source that can be used to sample the lensing potential of the secondary lens in a wider range of distances. We apply the EOSL test to a galaxy found in the MACSJ0416.1−2403 galaxy cluster. We take advantage of our previous work where the galaxy cluster lens model is determined with accuracy to constrain the properties of the arc that is being lensed by the EOSL. We explore the space of solutions with a model containing six parameters (and an additional halo for the nearby spiral galaxy). After marginalizing over the space parameter, we are able to constrain the total mass of the galaxy although some degeneracies still persist between the baryonic and DM masses. However, regarding the spatial distribution of the DM, the marginalized probability shows a strong preference for prolate (or oblate) models that contain the bulk of the mass in a DM halo that aligns perpendicularly with the plane of the visible galaxy. This conclusion is independent of variations in the external shear due to the cluster itself or substructure near the EOSL. This scenario, although consistent with some simulations, would contradict also other simulations, that predict that most of the times the inner part of the DM halo aligns in a direction that is in line with the visible galaxy. On the other hand, our conclusions are in agreement with some of the interpretations given to polar ring galaxies or the co-orbiting planes of subhaloes around M31 and our own Galaxy. The existence and geometry of the elongated DM halo, perpendicular to the galaxy, goes against the hypothesis of modified gravity theories. In these models, haloes aligned with the visible galaxy would be favoured if the baryonic component is responsible for the gravitational potential. Meanwhile, our results show the opposite. A simple change in the Newtonian potential may not be sufficient to eliminate the need for a dark component and would result only in different mass estimates but still with a preference for a dark component that aligns perpendicularly with the emitting light. A proper analysis that explicitly considers alternative theories of gravity could settle this situation.
This work is based on observations made with the NASA/ESA Hubble Space Telescope and operated by the Association of Universities for Research in Astronomy, Inc. under NASA contract NAS 5-2655. TB thanks the University of Hong Kong for generous hospitality. JMD acknowledges support of the consolider project CAD2010-00064 and AYA2012-39475-C02-01 funded by the Ministerio de Economia y Competitividad. JMD also acknowledges the hospitality of the Department of Physics and Astronomy at University of Penn during part of this research. The authors thank Stacy McGaugh and Alexei Moiseev for very useful suggestions, comments and a very interesting discussion. We would also like to thank the anonymous referee for suggestions that helped improve the quality of this paper.
We named the background lensed galaxy the Dragon Kick galaxy.
