


Abstract
Variations in the X-ray emission from the narrow-line Seyfert 1 galaxy, Markarian 335, are studied on both long and short time-scales through observations made between 2006 and 2013 with XMM–Newton, Suzaku and NuSTAR. Changes in the geometry and energetics of the corona that give rise to this variability are inferred through measurements of the relativistically blurred reflection seen from the accretion disc. On long time-scales, we find that during the high-flux epochs the corona has expanded, covering the inner regions of the accretion disc out to a radius of |$26_{-7}^{+10}$|rg. The corona contracts to within 12rg and 5rg in the intermediate- and low-flux epochs, respectively. While the earlier high-flux observation made in 2006 is consistent with a corona extending over the inner part of the accretion disc, a later high-flux observation that year revealed that the X-ray source had become collimated into a vertically extended jet-like corona and suggested relativistic motion of material upwards. On short time-scales, we find that an X-ray flare during a low-flux epoch in 2013 corresponded to a reconfiguration from a slightly extended corona to one much more compact, within just 2 ∼ 3rg of the black hole. There is evidence that during the flare itself, the spectrum softened and the corona became collimated and slightly extended vertically as if a jet-launching event was aborted. Understanding the evolution of the X-ray emitting corona may reveal the underlying mechanism by which the luminous X-ray sources in AGN are powered.
1 INTRODUCTION
Markarian 335 (Mrk 335) is a particularly interesting example of a narrow-line Seyfert 1 (NLS1) galaxy, harbouring a supermassive black hole of mass 2.6 × 10⁷|$\rm \thinspace M_{{\odot }}$| (Grier et al. 2012), whose X-ray emission has been studied on numerous occasions by missions as far back as UHURU and, more recently, XMM–Newton, Suzaku and NuSTAR. Each observation of Mrk 335 found new phenomena, from relativistically blurred reflection (Gallo et al. 2013) to changing intrinsic absorption from outflowing winds (Longinotti et al. 2013).
Over the last 15 years, the flux from Mrk 335 has varied by more than an order of magnitude, with early observations from 2000 to 2006 seeing a bright X-ray source in a high-flux state. The flux was then found to have dropped by a factor of 10 when Mrk 335 was observed by XMM–Newton in 2007 before recovering into an intermediate-flux state by 2009 during which the source was found to be transitioning from lower to higher luminosity. Most recently, monitoring of Mrk 335 by the Swift satellite found the flux to have once again dropped to a similar level to that seen in 2009; hence, target of opportunity (ToO) observations were triggered using NuSTAR (Parker et al. 2014) and, simultaneously with part of this, Suzaku (Gallo et al. 2015).
The X-ray spectra of Mrk 335, ranging from the early high-flux observations with XMM–Newton (Crummy et al. 2006), Suzaku (Larsson et al. 2008) and even ASCA (Ballantyne, Iwasawa & Fabian 2001) to the low- (Grupe et al. 2008) and intermediate-flux observations (Gallo et al. 2013) from later years, can be explained by X-ray continuum emission from a corona of energetic particles surrounding the central black hole that illuminates the accretion disc of material spiralling inwards (George & Fabian 1991). This leads to X-ray reflection by the processes of Compton scattering, photoelectric absorption and the emission of fluorescence lines and bremsstrahlung (Ross & Fabian 2005). The reflection spectrum, including the prominent 6.4 keV Kα emission line of iron, is blurred by Doppler shifts and relativistic beaming due to the orbital motion of material in the accretion disc as well as by gravitational redshifts in the strong gravitational field around the black hole (Fabian et al. 1989; Laor 1991).
In addition to the blurred reflection from the accretion disc, absorption features are seen in the X-ray spectrum that are attributed to material outflowing from the central regions of the AGN. Longinotti et al. (2013) find significant spectral features due to absorption by ionized outflowing material, attributed to a wind launched from the surface of the accretion disc during the 2009 intermediate-flux epoch and that some of this absorption remains during the 2006 and 2007 high- and low-flux epochs observed by XMM–Newton. On the other hand, Larsson et al. (2008) find that no intrinsic absorption is required to model the high-flux spectrum recorded by Suzaku later in 2006.
The soft (0.5–10 keV) X-ray spectrum of Mrk 335 can be equally well explained by the partial covering of a primary X-ray source by absorbing material along the line of sight, with no detection of relativistically blurred reflection from the accretion disc (Longinotti et al. 2007; O'Neill et al. 2007; Grupe et al. 2008). Gallo et al. (2015), however, find that in order to self-consistently describe both high- and low-flux observations of Mrk 335 made with Suzaku by changes in a partially covering absorber is challenging. Extreme parameters are required, with almost complete covering by Compton-thick material being required in the low-flux state with little to no absorption in the high-flux state. Variation in the primary X-ray continuum that gives rise to relativistically blurred reflection from the accretion disc provides a much more natural description of the data.
Compelling evidence for relativistically blurred reflection from the accretion disc in Mrk 335 comes from the detection of X-ray reverberation time lags between the variability in the X-ray continuum and the corresponding variations in the reflected X-rays (Kara et al. 2013). The measured time lag corresponds to the light crossing time between the X-ray emitting corona and the inner regions of the accretion disc, while the variation in time lag as a function of X-ray energy is consistent with that seen in many NLS1 galaxies (de Marco et al. 2013; Uttley et al. 2014) and is indicative of the most redshifted emission in the wing of the 6.4 keV iron Kα line emanating from the inner regions of the accretion disc where gravitational redshift is most extreme, closer to the primary X-ray source, while a longer lag is seen from the core of the line, consisting of X-rays reflected from the outer disc. At the same time, Parker et al. (2014) clearly detect the Compton hump characteristic of X-ray reflection in broad-band spectra obtained by NuSTAR finding the spectrum to be well described by the relativistically blurred reflection of X-rays originating from a compact corona within just a few gravitational radii of the black hole.
Recent detailed analysis of the X-rays reflected from the accretion disc has enabled the measurement of the geometry of the corona that is illuminating the disc, particularly through the emissivity profile of the accretion disc (Wilkins & Fabian 2011, 2012) and the spectrum of reverberation time lags as a function of both the frequency of variability and X-ray energy (Wilkins & Fabian 2013; Cackett et al. 2014). Much remains unknown, however, about the physical processes occurring within the coronæ in AGN. Measuring the evolution in the corona as the X-ray luminosity varies on both long and short time-scales will give important insight to the structure and physical processes within the X-ray emitting region. Understanding the variations in the corona may also reveal the mechanism by which energy is liberated from the accretion flow and injected into the corona to accelerate the particles in order to power some of the most luminous objects we see in the Universe. Given its great variability over orders of magnitude in luminosity, the variable nature of outflows and other phenomena found in this source, and it being one of the closer NLS1 galaxies meaning that even in during the low-flux epochs, a respectable count rate is measured, Mrk 335 is the ideal source in which to study the variability of the X-ray emitting corona to learn about the environment and processes therein.
In this paper, we analyse the corona of Mrk 335 over high- and low-flux epochs through X-ray spectra observed between 2006 and 2013. We begin by outlining the means by which measurements can be made of the corona from X-ray observations before studying variations in the corona through the reflection of X-rays from the accretion disc over both long time-scales and short time-scales through the 2013 low-flux observation made with Suzaku.
2 OBSERVATIONS AND DATA REDUCTION
In order to probe the evolution of the corona that may lead to the extreme variability exhibited by Mrk 335, data from five sets of observations with the X-ray observatories XMM–Newton (Jansen et al. 2001) and Suzaku (Mitsuda et al. 2007) during which both the observed spectrum and flux vary greatly, shown in Table 1, were analysed.
X-ray observations of Mrk 335 used in this work to understand the evolution of the X-ray emitting corona. Fluxes are shown to compare the epochs and are calculated from the best-fitting model to the EPIC pn spectrum in the case of XMM–Newton and to the combined front-illuminated XIS0 and XIS3 spectra in the case of Suzaku.
| Telescope | Flux state | Obs. ID | Start date | Exposure | Flux (0.5–10 keV) | Reference |
|---|---|---|---|---|---|---|
| XMM–Newton | High | 0306870101 | 2006-01-03 | 133 ks | 4.08 × 10⁻¹¹|$\rm \thinspace erg\rm \thinspace cm^{-2}\rm \thinspace s^{-1}\,$| | Grupe, Komossa & Gallo (2007) |
| Low | 0510010701 | 2007-07-10 | 22.6 ks | 4.53 × 10⁻¹²|$\rm \thinspace erg\rm \thinspace cm^{-2}\rm \thinspace s^{-1}\,$| | Longinotti et al. (2008) | |
| Intermediate | 0600540501 | 2009-06-13 | 82.6 ks | 8.82 × 10⁻¹²|$\rm \thinspace erg\rm \thinspace cm^{-2}\rm \thinspace s^{-1}\,$| | Grupe et al. (2012) | |
| 0600540601 | 2009-06-11 | 132 ks | 6.91 × 10⁻¹²|$\rm \thinspace erg\rm \thinspace cm^{-2}\rm \thinspace s^{-1}\,$| | Grupe et al. (2012) | ||
| Suzaku | High | 701031010 | 2006-06-21 | 151 ks | 3.15 × 10⁻¹¹|$\rm \thinspace erg\rm \thinspace cm^{-2}\rm \thinspace s^{-1}\,$| | Larsson et al. (2008) |
| Low | 708016010 | 2013-06-11 | 119 ks | 4.24 × 10⁻¹²|$\rm \thinspace erg\rm \thinspace cm^{-2}\rm \thinspace s^{-1}\,$| | Gallo et al. (2015) | |
| 708016020 | 2013-06-14 | 130 ks | 3.43 × 10⁻¹²|$\rm \thinspace erg\rm \thinspace cm^{-2}\rm \thinspace s^{-1}\,$| | Gallo et al. (2015) | ||
| NuSTARa | Low | 701031010 | 2013-06-13 | 21 ks | 1.02 × 10⁻¹¹|$\rm \thinspace erg\rm \thinspace cm^{-2}\rm \thinspace s^{-1}\,$| | Parker et al. (2014) |
| 708016010 | 2013-06-13 | 22 ks | 1.22 × 10⁻¹¹|$\rm \thinspace erg\rm \thinspace cm^{-2}\rm \thinspace s^{-1}\,$| | Parker et al. (2014) |
Note. aNuSTAR fluxes are measured over the energy range 3–50 keV rather than 0.5–10 keV as used for XMM–Newton and Suzaku.
XMM–Newton observed Mrk 335 during high-, low- and intermediate-flux epochs in 2006, 2007 and 2009, respectively. We do not use the high-flux observation of Mrk 335 obtained by XMM–Newton in 2000 as analysis suggests that this shorter exposure, during which the EPIC pn camera was operated in full frame mode, suffers from a significant degree of pile-up. Suzaku has observed Mrk 335 on two occasions: a high-flux epoch during 2007 and a ToO observation during 2013, triggered from Swift monitoring to observe Mrk 335 at a low flux level, simultaneously with NuSTAR (Harrison et al. 2013). The 2013 Suzaku observation shows similar characteristics to the 2007 low-flux epoch observed by XMM–Newton, but provides a considerable improvement in the quality of the data, offering around eight times as many photon counts from the source. The spectra during each of these observations, with the instrument response unfolded, are shown in Fig. 1 and allow a comparison to be made between the different epochs.
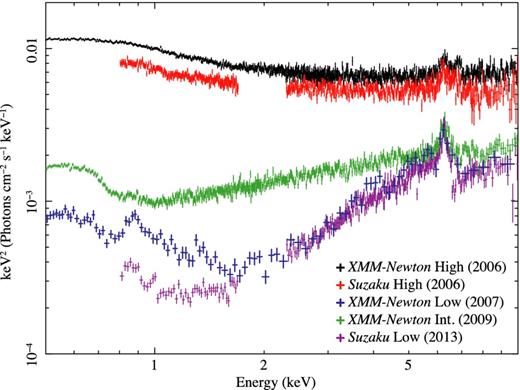
Unfolded spectra of Mrk 335 during the five epochs, observed with XMM–Newton and Suzaku between 2006 and 2013. The instrument response is unfolded from the recorded spectra using xspec, assuming a featureless, constant model spectrum across all energies (i.e. a power law with index zero), to enable the spectra and flux levels to be quickly compared across the epochs, even though they were recorded with different instruments.
2.1 XMM–Newton
We use the spectra recorded by the just the EPIC pn camera on board XMM–Newton (Strüder et al. 2001), due to its enhanced effective area over the EPIC MOS cameras to allow for finer energy binning in the recorded spectra. Since Mrk 335 is a bright source, the EPIC pn camera provides sufficient counts for detailed analysis of the X-rays reflected from the accretion disc, while meaning we need not be concerned by the cross-calibration of the instruments, particularly when decomposing the relativistically blurred reflection from the accretion disc to measure the emissivity profile.
Data were reduced using the XMM–Newton Science Analysis System (sas) v13.5.0 using the most recent calibration data for the observations in question available at the time of writing. After initial reduction of the event lists and removal of background flares, the source spectra were extracted from a circular region of the detector, centred on the point source, 35 arcsec in diameter. Corresponding background spectra were extracted from a region of the same size, on the same chip as the source. The spectra were binned using the grppha tool such that there were at least 25 counts in each spectral bin and that the errors are approximately Gaussian. The photon redistribution matrices (RMF) and ancillary response matrices (ARF), encoding the effective area as a function of energy, were computed using the sas tasks rmfgen and arfgen, following the standard procedure.
The XMM–Newton observation of the 2009 intermediate-flux epoch was divided into two orbits between which differences were observed in the X-ray spectrum (Gallo et al. 2013). During the first orbit, the count rate rose from 2.3 ± 0.4 to 4.4 ± 0.6|$\rm \thinspace counts\rm \thinspace s^{-1}\,$| and remained high during the second orbit, averaging 4 ± 1|$\rm \thinspace counts\rm \thinspace s^{-1}\,$|. As well as considering the two orbits separately, the combined spectrum, summing the source and background counts from the two orbits (using averaged response matrices), was considered in order to maximize the number of photon counts for detailed analysis of the X-ray reflection spectrum and the accretion disc emissivity profile, measuring the average properties of the source over the two orbits.
2.2 Suzaku
Mrk 335 was observed by Suzaku in the Hard X-ray Detector (HXD) nominal position in 2006 and in the X-ray Imaging Spectrometer (XIS) nominal position in 2013. Spectra were extracted from observations by the XIS CCDs on board Suzaku. Unscreened event lists were reprocessed and filtered using the latest calibration data available with aepipeline, then spectra were extracted from a circular area, 250 arcsec in diameter, centred on the point source. Corresponding background spectra were extracted from regions of the same size on each detector. The RMF response matrices for the observations using xisrmfgen and ARF ancillary response files were calculated using the ray tracing tool xissimarfgen.
After checking for consistency, the spectra from the front-illuminated CCDs, XIS0 and XIS3 (and XIS2 during the 2006 observation, which was still functioning at this time) were combined into a single spectrum using the tool addascaspec. Due to uncertainties in the calibration, energy channels below 0.8 keV and between 1.7 and 2.3 keV were excluded from spectral fitting. During the 2013 low-flux observation, strong background emission from Ni Kα is detected relative to the low source flux; therefore, energy channels between 7.4 and 7.8 keV were also excluded from the 2013 observation. XIS spectra were fitted over the energy band 0.8–12.0 keV.
The spectra were binned using grppha such that there were at least 25 X-ray counts in each spectral bin. We do not use the data from the back-illuminated XIS1 detector in order to avoid systematic errors arising from the cross-calibration of the front- and back-illuminated CCDs when conducting detailed analysis of the X-ray reflection spectra and the accretion disc emissivity profiles, choosing to use the combined spectra from the front-illuminated CCDs to maximize the number of available counts.
In order to extend coverage to higher energy, spectra were also extracted from the PIN component of the HXD. PIN spectra were extracted from the HXD data following reprocessing and filtering of the unscreened event lists, using the latest calibration data available. The non-X-ray background (NXB) computed from the simulated event list obtained from the calibration data base (CALDB) was compared to the background spectrum measured during periods of Earth occultation (ideally, these should be consistent). The Earth-occulted background count rate in the range 15–40 keV (0.194 ± 0.002) was found to be lower than the simulated NXB (0.271 ± 0.004); hence, the Earth-occulted background was adopted for the non-X-ray component. This was combined with a cosmic X-ray background spectrum that was modelled using a flat response for the PIN. The good detection was made of Mrk 335 in the energy range 15–40 keV using the PIN detector with an effective exposure of 131 ks in 2006 and 254 ks in 2013. The PIN spectra were fitted simultaneously with those from the XIS, with the PIN model enhanced by a factor of 1.18 when the source was in the HXD nominal position and 1.16 for the XIS nominal position to account for the cross-calibration of the instruments.
Sufficient photon counts were detected by the PIN to constrain the shape of the broad-band X-ray spectrum, in particular the slope of the power-law continuum and the reflection fraction, although the PIN data are insufficient to fully constrain spectral features above 10 keV such as the Compton hump.
2.3 NuSTAR
NuSTAR observed Mrk 335 simultaneously with part of the 2013 Suzaku observation, offering spectral coverage from 3 to 50 keV. Event lists from NuSTAR were reprocessed using the latest calibration following the standard procedure with nustardas v1.4.1. The source spectra were extracted from regions 60 arcsec in diameter from both focal plane module detectors, FPMA and FPMB, centred on the point source and corresponding background spectra were extracted from a region of the same size from another region of the same detector. Response matrices were produced with the nuproducts pipeline used to extract the spectra. The spectra from the two observation IDs were summed under average response matrices and the separate (summed) spectra from the FPMA and FPMB detectors were fitted simultaneously. Mrk 335 was well detected in the energy range 3–50 keV.
Preliminary analysis of this spectrum found that it could not be fitted simultaneously with the full Suzaku observation, with there being a discrepancy between the 15–40 keV part of the spectrum measured by the NuSTAR FPMA and FPMB detectors and the Suzaku PIN. The NuSTAR spectra suggest a steeper continuum. The slope of the X-ray continuum is found to be highly variable throughout the duration of the 2013 observation; hence, the combined spectrum over the full period represents the average properties of the source. Since the NuSTAR observation was simultaneous with only part of the Suzaku observation, it reasonably shows different average properties; hence, we do not use the NuSTAR data to further constrain parameters derived from the Suzaku observation.
We therefore fit the NuSTAR FPMA and FPMB spectra simultaneously with the concurrent part of the Suzaku observation (Obs. ID 708016010), with total exposure 59 ks and beginning 168 ks from the start of the Suzaku observation. A thorough analysis of the complete set of 2013 NuSTAR observations, including the 200 ks section following the Suzaku observation, is conducted by Parker et al. (2014).
3 MEASURING THE X-RAY EMITTING CORONA
3.1 The accretion disc emissivity profile
Recent detailed analysis of the profile of relativistically broadened emission lines seen in the reflection spectra of bare Seyfert galaxies has revealed the illumination pattern of the accretion disc by the coronal X-ray source, that is the emissivity profile. By decomposing the relativistically blurred reflection spectrum, most notably the prominent iron Kα line at 6.4 keV, into the contributions from successive radii in the accretion disc, Wilkins & Fabian (2011) find that the emissivity profile of the disc in the NLS1 galaxy 1H 0707−495 approximately takes the form of a twice-broken power law, falling off steeply with index >7 over the inner regions of the disc, then flattening to almost a constant between 5 ∼ 35rg before falling off slightly steeper than r−3 over the outer part of the disc, the form that is expected theoretically for illumination of an accretion disc in the curved space–time around a black hole by a coronal X-ray source (Miniutti et al. 2003; Suebsuwong et al. 2006). A similar emissivity profile, flattened between 5 ∼ 10rg, was found by Fabian et al. (2013) for the accretion disc in the NLS1 galaxy IRAS 13224−3809.
Wilkins & Fabian (2012) present a systematic analysis of the expected emissivity profiles for accretion discs illuminated by a range of point-like and extended coronæ, derived from general relativistic ray tracing simulations. Fig. 2 shows predicted emissivity profiles for accretion discs illuminated by a number of different coronal geometries. In the case of an isotropic point source illuminating the disc, the emissivity profile takes the form of a twice-broken power law with the outer break radius approximately coinciding with the height of the source above the disc plane, however with only a slight steepening of the inner disc emissivity profile (with power-law indices typically less than 5) until the source is located closer than 3rg to the black hole, at which point, the emissivity profile becomes simply a once-broken power law, falling off progressively more steeply over the inner disc as the source gets closer to the black hole, and tending to r−3 at large radius.
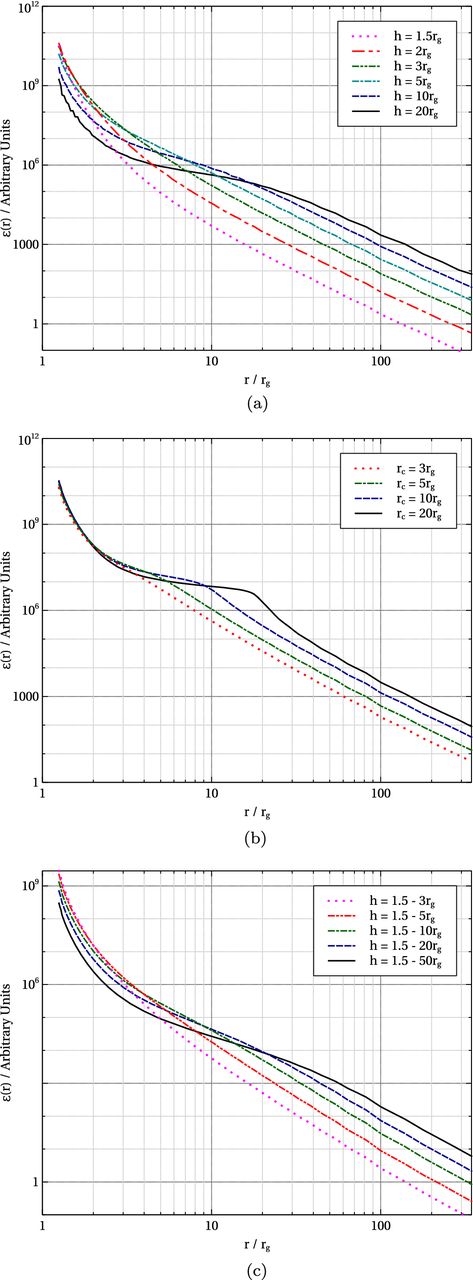
Theoretical emissivity profiles calculated from general relativistic ray tracing simulations (Wilkins & Fabian 2012) for (a) isotropic point sources at varying height above the accretion disc and coronæ extending (b) radially over the plane of the accretion disc and (c) vertically, in a jet-like configuration for a maximally rotating Kerr black hole.
In order to explain both the steeply falling inner disc emissivity profile and the location of the outer break radius in the measured emissivity profile ≳10rg, Wilkins & Fabian (2012) show that a spatially extended corona that at least partially covers the inner part of the accretion disc is required to illuminate the disc. The outer break radius of the emissivity profile corresponds to the outermost radial extent of the corona over the plane of the disc, while, in order to reproduce the steep inner part of the profile, the lower bound of the corona must be located less than a few gravitational radii above the plane of the disc. Thus, in the case of a steep inner emissivity profile, the outer break radius reveals the radial extent of the corona over the accretion disc while being relatively insensitive to its vertical extent above the plane of the disc.
Finally, for a corona extended vertically in a jet-like configuration perpendicular to the plane of the accretion disc (i.e. whose vertical extent is greater than its radial extent), the emissivity again falls off steeply over the inner part of the accretion disc but then, rather than flattening, is proportional to r−2 (as successively higher parts of the jet each contribute an outer break radius according to their height, as in the case of a point source, but contribute less reflected flux getting further from the disc). There is then a slight curvature in the emissivity profile, steepening to r−3 at a radius coinciding with the maximum extent of the jet.
3.1.1 Direct measurement of the emissivity profile
The emissivity profile of the accretion disc can be measured directly, making no prior assumption of its form, using the method of Wilkins & Fabian (2011), dividing the blurred reflection spectrum into the contributions from successive radii in the disc, described by the reflionx model, convolved with the kdblur blurring kernel in which the inner and outer radius parameters are set accordingly for each annulus and each has a flat emissivity profile. The inclination of the accretion disc (for all annuli) is set to the best-fitting value found in the previous fit to the full spectrum, so too are the iron abundance and ionization parameter of the accretion disc. Also included in the spectral model is any unblurred reflection from distant material as well intrinsic absorption, again with parameters set to the best-fitting values determined prior to measuring the emissivity profile. The normalization (i.e. the contribution) of each annulus to the reflection spectrum is found by minimizing χ2, fitting this model to spectrum over the 3–10 keV energy range, dominated by the prominent iron Kα emission line. In order to constrain the emissivity profile of the inner part of the disc, particularly over the range 5–20rg, it is necessary to also fit over the range 3–5 keV, thereby excluding the core of the line dominated by the outer parts of the disc, >20rg (see Wilkins & Fabian 2011 for a full discussion).
3.1.2 Fitting the emissivity profile
The best method to determine the emissivity profile of the accretion disc and, hence, the extent of the X-ray emitting corona would be to measure the profile directly, decomposing the reflection spectrum into the contributions from successive radii in the disc, following the method of Wilkins & Fabian (2011). Such a decomposition, however, requires a good signal-to-noise detection of the iron Kα line, which depends upon the exposure time of the observation as well as the inherent strength of the line; the overall reflected flux from the accretion disc, the iron abundance and ionization state of the disc all contribute. When we wish to study the evolution of geometry of the corona as the source varies between higher and lower levels of flux during the course of an observation, these required long-exposure observations are not available from which the emissivity profile can be measured directly with no prior assumption of its form. In these instances, we are guided by measurements we have from long observations and theoretical predictions and these take the form of either a once- or twice-broken power law and we fit a model of the relativistically blurred reflection spectrum in which the slopes and break points of the power-law forms of the emissivity profile are free parameters.
First, in order to determine whether the once-broken power law for a compact source close to the black hole or a twice-broken power law for a more extended source yields the better description of the data, it is important to understand how a once-broken power law can be fitted to the latter case of a twice-broken power-law emissivity profile. To this end, observations of the relativistically blurred reflection of a power-law continuum with various twice-broken power-law emissivity profiles were simulated using the fakeit command in xspec (Arnaud 1996). Data were simulated to a quality comparable to the long observations currently available of NLS1 galaxies; the spectral model and count rate were based upon those found for 1H 0707−495 (Zoghbi et al. 2010). A model consisting of the power-law continuum and blurred reflection with a once-broken power-law emissivity profile was fitted to the simulated spectra. In all cases, the real emissivity profile is guided by the measured profile of 1H 0707−495 and falls off as r−7 over the region r < 5rg and then flattens to a power-law index of zero. The outer break radius is variable and the profile falls off as r−3.3 over the outer disc. Results are shown in Table 2.
The best-fitting once-broken power-law emissivity profiles to simulated reflection spectra with twice-broken power-law emissivity profiles with qin = 7, rbr, in = 5rg, qmid = 0 and qout = 3.3. The outer break radius, rbr, out, of the real emissivity profile is variable.
| Real profile | Best-fitting once-broken profile | ||
|---|---|---|---|
| rbr,out | qin | rbr | qout |
| 7rg | 7.82 | 4.98rg | 3.26 |
| 10rg | 7.81 | 4.35rg | 3.04 |
| 15rg | 7.82 | 4.01rg | 2.69 |
| 20rg | 7.76 | 3.85rg | 2.49 |
| 30rg | 7.66 | 3.67rg | 2.23 |
| 50rg | 5.09 | 5.09rg | 1.73 |
| Real profile | Best-fitting once-broken profile | ||
|---|---|---|---|
| rbr,out | qin | rbr | qout |
| 7rg | 7.82 | 4.98rg | 3.26 |
| 10rg | 7.81 | 4.35rg | 3.04 |
| 15rg | 7.82 | 4.01rg | 2.69 |
| 20rg | 7.76 | 3.85rg | 2.49 |
| 30rg | 7.66 | 3.67rg | 2.23 |
| 50rg | 5.09 | 5.09rg | 1.73 |
We find that in all cases, the once-broken power law still provides a good fit to the data (χ2/ν < 1.1 in all cases). The inner part of the once-broken power-law emissivity profile is used to reproduce, almost exactly, the steep inner part of the real emissivity profile, with the inner power-law index and break point matching closely to the inner index and first break point of the real emissivity profile. This behaviour can be explained in terms of the majority of the reflected flux (as much as 60 per cent of what is measured by an observer at infinity) arising from these inner regions of the accretion disc (Wilkins & Fabian 2011). The outer power-law index of the once-broken emissivity profile is then used to reproduce the reflected emission from the middle and outer parts of the disc. The measured outer emissivity index is essentially a weighted average of the indices of the real (flattened) middle and outer parts of the profile, with the measured outer emissivity index decreasing as the outer break point moves to larger radius.
In reality, we expect the power-law index of the emissivity profile to be ≳3 on the outermost parts of the disc, with steeper profiles being measured for the most compact coronæ. We therefore conclude that measuring a once-broken power-law emissivity profile with a steep inner emissivity index and outer emissivity index less than 3 implies an extended corona a few gravitational radii above the plane of the disc (to give the steep inner index) and extending radially ≳10rg over the inner part of the disc. Given such a result, a model reflection spectrum with a twice-broken power-law emissivity profile may then be fitted to the data to determine the location of the outer break radius, though since such a model has more free parameters than the once-broken power-law model, constraining these parameters may require higher quality data.
3.2 The reflection fraction
In a scenario in which the geometry or spatial extent of the corona is varying, it should be expected that the relative fraction of photons that are detected in the power-law continuum and in the reflection changes. As the X-ray source becomes confined to a more compact region around the black hole, gravitational light bending causes more of the photons emitted from the corona to be focused towards the black hole and hence on to the inner regions of the accretion disc, rather than being able to escape in order to be detected as part of the X-ray continuum. As such, the fraction of reflected photons relative to continuum photons is enhanced.
The reflection fraction is not, naïevly expected to drop below unity. If an isotropic X-ray source is located above an infinite accretion disc subtending solid angle 2π to an observer at the source location, half of the emitted continuum photons will hit the disc while half will be able to escape to form the continuum.
Such a picture was invoked by Miniutti & Fabian (2004) to explain the relative constancy of the reflected flux in the NLS1 galaxy MCG–6-30-15 while the continuum flux is seen to vary greatly. They calculate the variation in reflected and continuum flux for a constant-luminosity, isotropic point source of X-rays that moves up and down the rotation axis of the black hole and show that this scenario is consistent with the observed variation in fluxes. Likewise, Fabian et al. (2012) show that the low-flux state that 1H 0707−495 was seen to drop in to in 2011 January, in which solely the relativistically blurred reflection spectrum from the accretion disc was seen with little or no contribution to the spectrum from the directly observed power-law continuum, can be understood in terms of the previously extended corona collapsing down to a confined region spanning just a few gravitational radii around the central black hole, meaning almost all of the continuum photons are focused on to the disc or lost beyond the event horizon.
Ray tracing simulations that count the number of rays emitted from a corona that are able to escape to infinity (to be detected as the X-ray continuum) and that are incident upon the disc, following Fabian et al. (2012) and Wilkins & Fabian (2012), allow the reflection fraction to be predicted. When photons are reflected from an accretion disc upon which the majority of photons fall on the innermost few gravitational radii (as suggested by the measured emissivity profiles), ray racing simulations show that less than half of the reflected photons are able to escape (Wilkins & Fabian 2012). Many will either return to the disc under the strong gravitational field around the black hole to give rise to second (and higher) order reflections or will be lost beyond the black hole event horizon which will reduce the measured reflection fraction. Thus, in order to accurately predict the reflection fraction from a given corona, it is necessary to compute the fraction of the reflected photons that will be observed which will, in turn, depend upon the measured emissivity profile. However, given this information, the reflection fraction can be used to place additional constraints on the corona, including its vertical extent that is not well constrained by the emissivity profile alone. Alternatively, measuring the variation in the reflection fraction over time for a given source shows how the extent of the corona is changing.
4 LONG TIME-SCALE VARIABILITY
In order to understand the long time-scale variability of Mrk 335 in terms of changes to the X-ray emitting corona, the spectrum from each of the six observations with XMM–Newton and Suzaku was analysed independently using xspec (Arnaud 1996).
4.1 The spectral model
The spectra were fitted with models in xspec based upon power-law continuum emission observed directly from the corona and the relativistically blurred reflection thereof from the accretion disc. The rest-frame reflection spectrum from the accretion disc is modelled by the reflionx code of Ross & Fabian (2005) and is convolved with the profile of a relativistically blurred emission line with either a once- or twice-broken power-law accretion disc emissivity profile using the kdblur2 model.
Reflection of the X-ray continuum by distant material, producing, among other features, a narrow iron Kα emission line on top of the broad line at 6.4 keV is accounted for by including a second, unblurred reflionx component with low-ionization parameter. Principal component analysis (PCA) conducted by Gallo et al. (2015) between the 2006 high-flux and 2013 low-flux observations with Suzaku shows a narrow component at 6.4 keV in the first principal component, indicating variation in the distant reflector on time-scales of years. To account for this, the flux of the distant reflection component is allowed to vary as a free parameter in the fits to the spectra obtained during each epoch.
Mrk 335 shows variable intrinsic absorption in its X-ray spectrum with Longinotti et al. (2013) reporting the discovery of an ionized wind outflowing at around 5000|$\rm \thinspace km\rm \thinspace s^{-1}\,$|. High-resolution X-ray spectra obtained with the XMM–Newton reflection grating spectrometer revealed that this wind is composed of three distinct components in different ionization states (ξ ∼ 10, 100 and 1000|$\rm \thinspace erg\rm \thinspace cm{\rm \thinspace s^{-1}\,}\,$|where the ionization parameter for the illumination of material with atomic hydrogen number density n illuminated by ionizing flux F, ξ = 4πF/n). All three absorbers are clearly detected in the 2009 intermediate-state XMM–Newton observations (Gallo et al. 2013; Longinotti et al. 2013), while to explain the XMM–Newton high-flux state spectrum of 2006, only the lesser ionized absorber is required, likewise in the XMM–Newton low-flux observation. On the other hand, the low-flux state of Mrk 335 recorded by Suzaku in 2013 shows evidence of only the hottest, most ionized of these absorbers (Gallo et al. 2015) while the high-flux spectrum observed by Suzaku in 2006 requires no intrinsic absorption (Larsson et al. 2008). The three ionized, warm absorbers are modelled by pre-calculated tables computed by Longinotti et al. (2013) using xstar, and the appropriate combination of tables is included in the model for each of the observations along with the absorption by material in our own Galaxy along the line of sight, described by the tbabs model. The column density of hydrogen atoms through our Galaxy to Mrk 335 is 3.6 × 10²⁰|$\rm \thinspace cm^{-2}\,$|.
In addition to the intrinsic absorption, the low-flux epochs also show evidence for ionized emitting material and we find additional line emission at 0.88 keV. This is modelled by a narrow Gaussian profile (σ = 1 eV) with centroid energy and normalization fit to the observed spectrum as free parameters.
The spectra obtained during each of the observed epochs with the respective best-fitting models are shown in Fig. 3 along with the basic model fit to the data.
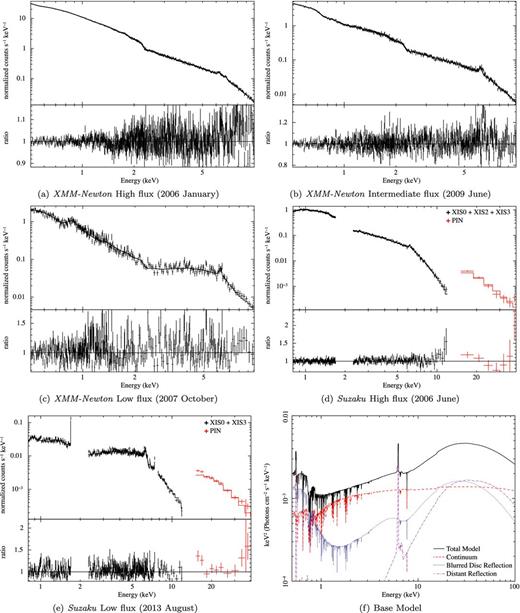
The spectra of Mrk 335 during the observed epochs of varying flux with the best-fitting models consisting of power-law continuum emission from the corona, the relativistically blurred reflection of this from the accretion disc, unblurred reflection from distant material and intrinsic absorption by outflowing material, appropriate for each epoch. The parameters derived from these preliminary fits are used in the base model to measure the emissivity profile of the accretion disc. The residuals apparent around the blueshifted edge of the 6.4 keV iron Kα line in (b) and (d) arise due to inadequacies in the modelling of the accretion disc emissivity profile and are removed once the emissivity profile is fitted explicitly (Fig. 5), as illustrated in Wilkins & Fabian (2011). Also shown in (f) is the spectral model used to determine the basic parameters of the X-ray continuum and reflection spectrum. The model is shown with the best-fitting parameters to the 2009 intermediate-flux epoch during which the most significant absorption was detected.
4.2 Measuring changes in the corona
The parameters of interest in understanding the changes in the geometry and energetics of the corona are the reflected and continuum fluxes (and the ratio thereof), the photon index of the power-law continuum and the emissivity profile of the accretion disc. The above model was initially fitted to the observed spectra during each of the epochs, incorporating the appropriate intrinsic absorption for the flux state in question, in order to find the best-fitting values of the photon index of the continuum, and the inner radius, inclination, iron abundance and ionization parameter of the accretion disc, as well as the column density and exact ionization parameters of the intrinsic absorbers. The results of these fits to the spectra of Mrk 335 during each of the observed epochs are shown in Table 3.
The best-fitting values of the model parameters used to measure the emissivity profile of the accretion disc during each epoch: the photon index of the X-ray continuum, Γ, the inclination, i, of the normal to the accretion disc to the line of sight and the inner radius of the accretion disc, rin, as well as the iron abundance, AFe, and ionization parameter, ξ, of the material in the accretion disc, and the reflection fraction, defined as the ratio of photon counts between the reflected and power-law continuum model components, R = Nref/Npl, first extrapolated over the energy range 0.1–100 keV and also over the range 20–40 keV for comparison with other reflection models. The flux of the unblurred reflection from material distant from the black hole is measured over the 0.1–100 keV energy band.
| Component | Parameter | All | XMM high | Suzaku high | XMM int. | XMM low | Suzaku low |
|---|---|---|---|---|---|---|---|
| powerlaw | Γ | |$2.523_{-0.010}^{+0.011}$| | |$2.16_{-0.01}^{+0.02}$| | |$1.90_{-0.02}^{+0.02}$| | |$2.36_{-0.08}^{+0.09}$| | |$1.91_{-0.07}^{+0.04}$| | |
| kdblur2 | i (deg) | |$57.1_{-1.2}^{+0.8}$| | |$58.8_{-3.0}^{+1.9}$| | |$59_{-3}^{+7}$| | |$52_{-14}^{+7}$| | |$66_{-1}^{+2}$| | |$58_{-6}^{+4}$| |
| rin (rg) | 1.235+0.003 | |$2.5_{-1.5}^{+2.7}$| | |$1.24_{-0.05}^{+0.14}$| | |$1.28_{-0.05}^{+0.02}$| | |$1.25_{-0.02}^{+0.03}$| | ||
| reflionx | AFe (solar) | |$2.6_{-0.2}^{+0.3}$| | |$1.75_{-0.17}^{+0.13}$| | |$1.9_{-0.1}^{+4.2}$| | |$3.6_{-0.7}^{+1.2}$| | |$4.2_{-0.6}^{+0.9}$| | |$6.7_{-1.4}^{+0.8}$| |
| ξ (|$\rm \thinspace erg\rm \thinspace cm{\rm \thinspace s^{-1}\,}\,$|) | |$58_{-4}^{+12}$| | |$105_{-50}^{+14}$| | |$250_{-20}^{+30}$| | |$21.0_{-0.8}^{+0.9}$| | |$13_{-5}^{+7}$| | ||
| R 0.1–100 keV | |$1.3_{-0.2}^{+0.5}$| | |$0.26_{-0.02}^{+0.04}$| | |$1.8_{-0.3}^{+0.4}$| | >40 | |$6_{-3}^{+4}$| | ||
| R 20–40 keV | |$3.2_{-0.5}^{+1.0}$| | |$0.59_{-0.05}^{+0.05}$| | |$1.1_{-0.2}^{+0.2}$| | >26 | |$35_{-12}^{+12}$| | ||
| Unblurred refl. | F (10−3 ph cm−2 s−1) | |$1.6_{-0.2}^{+0.2}$| | |$1.3_{-0.3}^{+0.3}$| | |$0.89_{-0.05}^{+0.10}$| | |$0.8_{-0.4}^{+0.4}$| | |$1.2_{-0.2}^{+0.2}$| | |
| Goodness of fit | χ2/ν | 1.10 | 1.06 | 1.04 | 1.00 | 1.12 | 1.04 |
The reflection fraction, R, is measured as the ratio of the photon fluxes from the blurred reflection and power-law continuum model components, extrapolated over the energy range 0.1–100 keV. These fluxes are measured by applying the cpflux pseudo-model in xspec to the appropriate model components, allowing their fluxes and the errors thereof to be determined as model parameters. For comparison with theoretical predictions of the fraction of rays emitted from the corona that are incident upon the accretion disc and able to escape to be observed as part of the continuum, it is important to consider as wide an energy range as possible in the reflection fraction. Ray tracing calculations are independent of the model reflection spectrum and do not account for the energy at which photons incident on the disc will be re-emitted in the reflection spectrum; thus, a comparison requires an estimate of the total number of reflected photons. It is also possible to compute reflection fractions over a more restricted energy range, such as 20–40 keV, encompassing the Compton hump. While insensitive to variations in the emission lines below 1 keV that are dependent on the ionization state, we find that the reflection fraction in this energy band is highly sensitive to the photon index of the primary continuum and is, hence, not a reliable estimate of the total fraction of the X-ray continuum that is reflected. We, however, include the reflection fraction over the 20–40 keV energy band for comparison with more recent modelling of accretion disc reflection spectra, for instance that conducted by Parker et al. (2014). It should be noted that the 0.1–100 keV energy band is not without degeneracies, since the reflected flux in emission lines below 1 keV increases as the disc becomes more ionized. When there is spectral coverage to low energies, this can be well constrained. In the case of Suzaku XIS spectra, however, the lack of data below 0.8 keV leads to some uncertainty in the flux arising from the extrapolated section of the reflection spectrum. It is therefore necessary to allow the ionization parameter to vary freely when computing the error in the reflection fraction. The quoted uncertainties reflect the range of ionization parameters admitted by the available data.
The errors in each of the model parameters were determined using the conventional approach in xspec; the standard deviation, σ, of any model parameter given the data is found by stepping through values of that parameter until the fit statistic, χ2, increases by 1 from its minimum, after finding the best-fitting value of the other free model parameters for the current value of the parameter of interest. Errors are quoted at the 90 per cent confidence level (Δχ2 = 2.706).
The values determined for these free model parameters were then used to construct a spectral model in order to measure the emissivity profile of the accretion disc, following the method of Wilkins & Fabian (2011), detailed in Section 3.1.1. The emissivity profiles of the accretion disc during each of the epochs are shown in Fig. 5.
Errors in the emissivity profiles are calculated from Markov chain Monte Carlo (MCMC) computation of the probability distribution of the normalization of the reflection contributed by each annulus, given the observed spectrum (see also Reynolds et al. 2012; Steiner & McClintock 2012, on the application of MCMC methods to X-ray spectral fitting). A so-called ‘walker’ is started at a given point in the parameter space, here taken to be the best-fitting normalization found during the calculation of the emissivity profile. From this point, a random step is taken in the parameter space with distributions in each parameter drawn from the diagonal of the covariance matrix found during the fit (this is the variance of each parameter). The likelihood of the data given the model with these new parameters is then computed. If this is greater than the likelihood at the previous position (i.e. the fit to the data is improved), the walker definitely moves to the new location. If not, the walker moves to the new location, but only with a probability defined by the ratio of the likelihoods at the new and old locations. Therefore, the walker may move or the step may be rejected, causing the walker to stay at the same location, on any iteration. The process is then repeated, with the walker either moving or staying put over a defined number of steps, and the sample of locations visited by the walkers in the parameter space follows the probability distributions of the free parameters.
We employ the MCMC sampler of Goodman & Weare (2010) to generate each random step,1 which, through an affine transformation of the parameter space, is better able to cope with the degeneracy between the normalizations of neighbouring annuli in their contributions to the reflection spectrum (essentially, performing a coordinate transformation such that the random steps are taken along the axes of any degeneracy in the space). We trace multiple walkers through the parameter space simultaneously (for good sampling, the number of walkers should be more than twice the number of model parameters) and the final chain is formed by combining the steps of all the walkers. The first 1000 steps of each walker's chain are discarded (or ‘burned’) to remove bias introduced by the choice of starting location, then the probability distributions from which the errors are found are computed by constructing histograms of each of the parameter values across all steps in the chain.
Using MCMC calculations to compute the errors on the emissivity profiles is advantageous in terms of computational efficiency, allowing the confidence limits on the normalizations of the reflection from all 35 annuli to be computed simultaneously, while MCMC methods are less vulnerable to local minima in the goodness of fit, with their ergodicity meaning that they explore the full parameter space and also less vulnerable to steep gradients in the goodness of fit causing the error calculation to simply peg at the hard limits set for the parameter.
4.3 Results
4.3.1 Properties of the X-ray spectrum
Initially, looking at the best-fitting parameters in Table 3 of a spectral model consisting of power-law continuum emission from the corona around the black hole and the relativistically blurred reflection of this emission from the accretion disc, we find that as the flux decreases, the reflection fraction increases significantly from a little over unity during the XMM–Newton observation in the 2006 high-flux epoch to R ∼ 5 in the 2013 low-flux epoch observed by Suzaku. During the 2006 high-flux epoch observed with Suzaku, the reflection fraction decreased dramatically to R ∼ 0.26, notably less than unity as would be expected classically in the case of a corona illuminating an accretion disc extending to infinity in the absence of gravitational light bending and other relativistic effects. We see that the flux of the unblurred reflection varies slightly between the epochs as suggested by the PCA of Gallo et al. (2015), though it does not simply follow the high- and low-flux epochs. If the unblurred reflection arises from material far from the central engine, for instance from the obscuring torus hypothesized in Seyfert galaxies, the reflected flux will vary as the average source luminosity over a time-scale corresponding to the range of light travel times to different parts of the reflector.
The photon index was found to vary by as much as 30 per cent between the observed epochs, with the continuum spectrum softening from the low- to the high-flux epochs, with the photon index increasing from around 1.9 during the Suzaku low- and XMM–Newton intermediate-flux epochs to 2.5 during the XMM–Newton high-flux epoch. This is in accordance with the general trend seen in AGN (Markowitz, Edelson & Vaughan 2003). We note, however, that the low-flux epoch observed by XMM–Newton does not fit this trend, with a photon index of 2.4 measured during this observation. We caution that the directly detected continuum flux is so low during this observation that the continuum photon index is constrained only by the slope of the emission reflected from the accretion disc.
During the 2009 intermediate-flux epoch, the X-ray count rate was seen to increase from 2 to 5|$\rm \thinspace counts\rm \thinspace s^{-1}\,$| during the first orbit of the observation, remaining at this higher level (averaging 4|$\rm \thinspace counts\rm \thinspace s^{-1}\,$|) during the second orbit. The changes in the X-ray spectrum as the count rate increased are considered in detail by Gallo et al. (2013). As the X-ray count rate increased, the continuum spectrum was found to soften with the photon index increasing from |$1.85_{-0.05}^{+0.05}$| to |$1.99_{-0.03}^{+0.04}$|, consistent with the behaviour seen between epochs; however, variation in the reflection fraction between 0.1 and 100 keV as well as the ionization parameter was found to be within the statistical errors. We find that the total photon count detected during each of the orbits was insufficient to detect changes in the emissivity profile of the accretion disc; hence, it is necessary to consider the summed spectrum to make a measurement of the average emissivity profile over the course of these observations.
During all epochs, we find that the maximum measured redshift in the wing of the relativistically broadened iron Kα emission line is statistically consistent with the accretion disc extending as far in as the innermost stable circular orbit (ISCO) of a maximally rotating black hole at r = 1.235rg supporting findings that the black hole spin a > 0.9 (Gallo et al. 2015). There is no evidence for truncation of the accretion disc between the high- and low-flux epochs.
It should be noted that although the spectra taken during the different epochs were fitted separately, the inclination of the accretion disc with respect to the line of sight (which should not change between the observations) is found to be consistent within statistical errors between the spectra. While it is possible that the inner radius of the accretion disc varies between the different epochs, identifying the inner edge of the accretion disc with the ISCO, the spin of the black hole (which is not expected to change on the time-scales between the observations) is consistent with maximal in each case.
We note, however, that there is a systematic offset between the iron abundances measured from the reflection spectra during each epoch. The elemental abundances within the accretion flow are not expected to vary on the time-scale of ∼10 years between these observations. The iron abundances measured from the two Suzaku observations are consistent within their respective errors; however, there is notable deviation between the XMM–Newton high- and Suzaku low-flux epochs. We therefore also fit the model to all of the spectra simultaneously, linking the values of the iron abundance and accretion disc inclination between the spectra. We find the iron abundance to be |$2.6_{-0.2}^{+0.3}$| times the solar value (which is still inconsistent with the Suzaku low-flux epoch within statistical errors alone).
Ross, Fabian & Ballantyne (2002) report that reflected X-rays returning to the accretion disc due to gravitational light bending to be reflected multiple times cause atomic features in the reflection spectrum to be enhanced, mimicking an enhanced iron abundance. During the lower flux epochs, the emissivity profile of the accretion disc is more centrally concentrated. More X-rays being reflected closer to the black hole will increase the returning radiation to the disc and could, hence, explain the apparent enhancement in the iron abundance during the lower flux epochs.
We caution, however, that, particularly in the Suzaku spectra, the iron abundance is not particularly tightly constrained and since the Suzaku spectra are only fit upwards of 0.8 keV, cutting out much of the iron L line as well as the soft excess, composed of a number of emission lines in the reflection model, the iron abundance is, to some extent, degenerate with the normalizations of the continua and reflection spectra. When the soft excess is not measured, increasing the iron abundance has the same effect as increasing the normalization of the reflection spectrum with respect to that of the continuum, merely increasing the flux in the iron Kα line above the continuum. Uncertainties in the iron abundance do not, however, affect the accuracy of the measured accretion disc emissivity profiles. It can readily be shown that an increased iron abundance improves the statistical constraint on the emissivity measured from the iron Kα line, with a greater number of photon counts to constrain the contribution from each part of the disc, but an under- or overestimate of the iron abundance affects only the overall (arbitrary) normalization of the emissivity profile, not the measured shape of the profile, in which we are interested.
Fitting the NuSTAR spectra simultaneously with the concurrent part of the Suzaku low-flux observation to extend energy coverage up to 50 keV (Fig. 4) resolves this discrepancy. The iron abundance is constrained to |$2.4_{-0.5}^{+0.6}$| times the solar value, in line with the simultaneous fit to all epochs. During this simultaneous section of the 2013 observations, including the NuSTAR data also constrains the ionization parameter of the accretion disc to ξ < 1.2, while the X-ray continuum was found during this section to have softened to |$\Gamma = 2.50_{-0.08}^{+0.09}$| (the NuSTAR observation includes the beginning of the flare seen with Suzaku during which the continuum softened). The reflection fraction over the energy band 0.1–100 keV is found to be |$1.0_{-0.3}^{+0.4}$| (consistent with the low value measured from the Suzaku spectrum as the flare begins) though there is no reason to believe that the photon index, reflection fraction or even the ionization parameter remains constant through the entire 2013 observation given the variability that is observed. The fit to this simultaneous section of the Suzaku and NuSTAR observations is good with χ2/ν = 1.05.
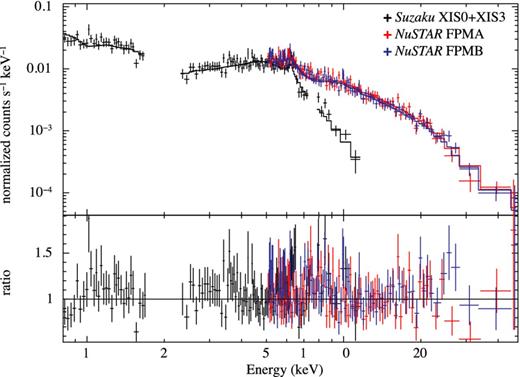
Simultaneous fit to the concurrent sections of the 2013 Suzaku (summed XIS0 and 3) and NuSTAR (separate FPMA and FPMB) spectra with the base model (χ2/ν = 1.05).
Gallo et al. (2015) find that when fitting a blurred reflection model to the Suzaku low-flux spectrum there is a degeneracy between the iron abundance and, in the model used therein, the spin parameter of the black hole (which is calculated directly from the best-fitting inner radius of the accretion disc). They find that the spectrum can either be fitted with near maximal spin (a = 0.998) and high iron abundance (around seven times the solar abundance), or slightly lower spin (|$a=0.94_{-0.02}^{+0.03}$| for which |$r_\mathrm{in}=2.0_{-0.3}^{+0.2}$|rg) with an iron abundance only around two times the solar. Including either the NuSTAR data or simultaneously fitting all of the observed epochs, the iron abundance is constrained to the lower value, breaking this degeneracy. We find no evidence that this degeneracy exists during the other epochs, presumably because the lower energy coverage of XMM–Newton better constrains the iron abundance as the ionization parameter and normalization vary. While the error bars on the accretion disc inner radius and iron abundance are larger during the Suzaku high-flux epoch, there is a single permissible range of values for each parameter. Stepping through the values of various other pairs of parameters during the fitting procedure presents no degeneracies further to those already discussed.
4.3.2 The emissivity profile and the extent of the corona
Turning to the measured emissivity profiles of the accretion disc during the different epochs (Fig. 5), we see great variation in the illumination of the accretion disc by the X-ray emitting corona between the high- and low-flux epochs. Comparing the measured profiles to the results of Wilkins & Fabian (2012) and the examples shown in Section 3.1, we see that during the 2006 high- and 2009 intermediate-flux epochs observed by XMM–Newton, the emissivity profile resembles the form expected in the case of an illuminating corona extending radially over the surface of the accretion disc at a low height; the profile approximates a twice-broken power law, falling off in this case as r−9 over the inner part of the accretion disc, flattening at a radius of around 3rg to a power-law index of zero before falling off as approximately r−3 over the outer disc. Fitting a relativistically blurred reflection component with a continuous twice-broken power-law emissivity profile, using the kdblur3 model (Wilkins & Fabian 2011), to the high-flux epoch spectrum over the energy range 1.1–10 keV (to include just the continuum and iron Kα emission line) yields an outer break radius |$r_\mathrm{b,out}=26_{-7}^{+10}$|rg, while for the intermediate-flux epoch yields an upper limit on the outer break radius rb, out < 12rg at the 90 per cent confidence level.
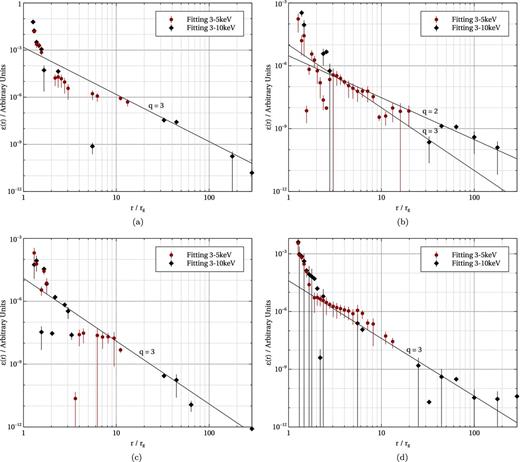
The emissivity profile of the accretion disc in Mrk 335 from the 2006 (a) XMM–Newton and (b) Suzaku high-flux, (c) 2009 XMM–Newton intermediate-flux and (d) 2013 Suzaku low-flux epochs. Emissivity profiles are measured by decomposing the relativistically blurred reflection from the accretion disc into the contributions from successive radii and finding the best-fitting normalization of each component to the spectrum over both the 3–10 and 3–5 keV energy bands.
There is a marked difference, however, between the 2006 high-flux observations made with XMM–Newton and Suzaku. While the XMM–Newton observation reveals an emissivity profile associated with a radially extended corona, flattening over the middle part of the disc before falling off as r−3, the emissivity profile measured from the Suzaku spectrum shows no such flattening and falls off as r−2 (allowing up to a twice-broken power-law emissivity profile, fall-off like r−3 over the outer disc is excluded in the 6σ confidence limit). Comparing this emissivity profile to those shown in Fig. 2 suggests that during this epoch, rather than being radially extended over the accretion disc, the X-ray emitting corona is extended vertically, up the rotation axis of the black hole. Theoretically, the uppermost vertical extent of the jet is marked by a subtle curvature in the outer part of the emissivity profile, from r−2 to r−3. The emissivity profile shows no evidence of this break within a radius of 50rg suggesting significant vertical extension of the corona; however, it should be noted that as the reflected flux is falling at larger radii in the disc, this break will become harder to detect the further out it moves.
The emissivity profile measured from the 2013 observation by Suzaku suggests that during this low-flux epoch, the X-ray emitting corona is much more compact, certainly lying within 6rg of the black hole, with a slight flattening of the emissivity profile observed out to this radius (although, given the error bars, this flattening is largely inferred from the two annuli at around 5.5 and 6rg, with the other annuli within this radius consistent, within the error bars, with the r−3 fall-off seen over the outer disc). This emissivity profile will be revisited in the next section.
We note that the emissivity profile over the outer disc is less well constrained during the lower flux epochs. The steeply falling emissivity profile over the inner part of the disc in these cases means that very little flux is reflected from the outer part of the disc; thus, we find that the emissivity profile of the outer disc in the case of the low-flux epoch observed by Suzaku is consistent with power-law index ≥3.
It was not possible to obtain an emissivity profile directly for the low-flux epoch observed by XMM–Newton in 2007. The low count rate combined with the short exposure time meant that there was insufficient signal-to-noise to decompose the iron Kα emission line into the contributions from successive radii in the disc. Fitting a relativistically blurred reflection component with a twice-broken power-law emissivity profile to this spectrum, we find that, when the inner break radius (between the steep inner and flat parts) is frozen to 3rg, in line with the emissivity profiles measured across the other epochs, the outer break radius is constrained to be <4.2rg (within the 90 per cent confidence interval) and the observed spectrum is consistent with a once-broken power-law emissivity profile with a break radius at 3rg and power-law index >2.4 over the outer part of the disc. We therefore conclude that this low-flux epoch, while not well constrained by the lower quality data, is consistent with a compact corona confined to within around 4rg of the black hole.
For comparison with the findings of Parker et al. (2014), the reflection spectrum was also fitted using the relxilllp model that combines the rest-frame reflection spectrum modelled by the xillver code (García & Kallman 2010; García, Kallman & Mushotzky 2011; García et al. 2013) with relativistic blurring by the relconvlp model that computes the relativistic blurring from an accretion disc with an emissivity profile appropriate for illumination by an isotropic point source (a ‘lamppost’) at a variable height above the disc plane (Dauser et al. 2013). In each case, except the 2006 Suzaku high-flux observation, this model was found to produce poor fits to the observed spectrum when energies below 3 keV are included (χ2/ν > 1.15) with significant residuals on the redshifted wing of the iron Kα line in the energy range 3–5 keV [it should be noted that Parker et al. (2014), who find a good fit to the 2013 NuSTAR observation using this model, consider only energies above 3 keV, thus exclude the soft excess and the point at which the continuum meets the red wing of the iron line). The Suzaku high-flux observation is, however, well fitted by this model, yielding a source height of |$20_{-5}^{+7}$|rg above the accretion disc (χ2/ν = 1.05).
Using the relxill variant, which allows a twice-broken power law to be freely fitted to the emissivity profile, rather than relxilllp, was found to provide a good fit to the observed spectra, comparable to those using the kdblur2 blurring kernel applied to the reflionx reflection spectrum. The parameters of the reflection spectrum, the iron abundance, ionization parameter, accretion disc inclination and inner radius as well as the reflection fraction measured over the 0.1–100 keV band, are found to be consistent, within the errors, between the two models.
These findings suggest that illumination of the accretion disc by a point source provides an inadequate description of the emissivity profile, highlighting the importance of measuring the emissivity profile rather than assuming a simplified model for the illuminating corona. We find that the red wing of the emission line, originating from the inner parts of the disc, is underestimated by the model assuming a point source. This suggests that the height of the point source is selected to reproduce the outer break radius of the emissivity profile, finding a high source that does not sufficiently illuminate the inner region of the disc.
5 SHORT TIME-SCALES: AN X-RAY FLARE DURING THE LOW-FLUX EPOCH
The light curve of the 2013 Suzaku low-state observation of Mrk 335 is shown in Fig. 6. Clearly apparent is a flare in the X-ray emission about 300 ks into the observation. The X-ray flux doubles for approximately 90 ks before returning to its previous level.
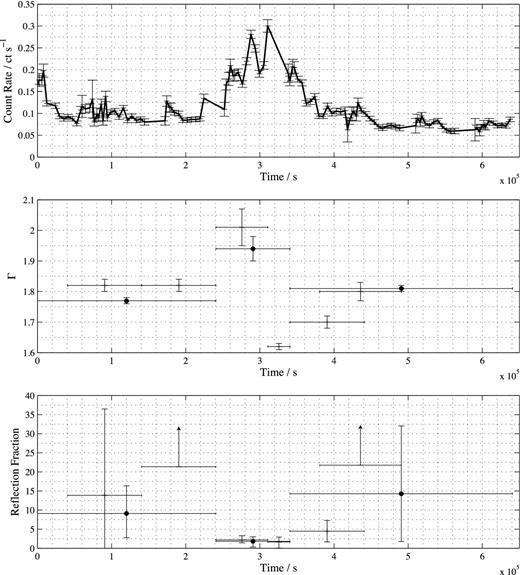
Background-subtracted light curve of Mrk 335 recorded with XIS0 on board Suzaku during the 2013 low-flux epoch, showing the 90 ks flare approximately 250 ks into the observation. The light curve is averaged over each 90 min orbit and the error bars represent the standard error in the mean. Also shown are the photon index, Γ, of the continuum spectrum and the reflection fraction, R (the ratio of the photon counts in the reflection and the continuum spectral components over the 0.1–100 keV range). Points show the long time periods before, during and after the flare while crosses show the shorter subdivisions of these periods.
5.1 Probing the short time-scale variability
In order to understand the changes in the corona that caused this rapid change in X-ray flux, the observations were divided into a number of time periods: both long periods before, during and after the flare that maximize the number of photon counts in the resulting spectra, and shorter time periods that may reveal more rapid changes.
The combined spectra measured by the front-illuminated XIS CCDs during each of the time periods were fitted with the same model as the entire 2013 Suzaku observation, with the intrinsic absorption, inclination, iron abundance and ionization parameter frozen at the best-fitting values to the spectrum from the entire 2013 low-flux epoch, shown in Table 3. This reduces the number of free parameters for these shorter exposures, allowing the photon index, inner radius of the accretion disc and emissivity profile, initially assumed to be a once-broken power law, using the kdblur2 blurring kernel, to be measured for each of the time periods from the spectra constructed with fewer photon counts.
While in reality the ionization of the disc may vary during the flare, it can readily be shown in this model that assuming a constant ionization parameter does not influence the measured emissivity profiles. Gallo et al. (2015) measure the ionization parameter to be less than 100|$\rm \thinspace erg\rm \thinspace cm{\rm \thinspace s^{-1}\,}\,$|at all times during the Suzaku low-flux observation. In this ‘low-ionization’ regime, the spectrum is dominated by the lesser ionized species which produce the prominent iron Kα line at 6.4 keV. Once convolved with the relativistic blurring kernel, it is this emission line that provides the strongest measure of the emissivity profile. It is only once the ionization parameter exceeds 150|$\rm \thinspace erg\rm \thinspace cm{\rm \thinspace s^{-1}\,}\,$| that the measurement of the emissivity profile is affected. Initially, the greater abundance of more ionized species with a vacancy in the L shell causes the iron Kα photons to be reabsorbed, weakening the emission line and hence the statistical constraint on the emissivity profile. Finally, once helium-like and hydrogenic iron become prevalent when ξ > 500|$\rm \thinspace erg\rm \thinspace cm{\rm \thinspace s^{-1}\,}\,$|, the Kα line is shifted from 6.4 to 6.67 and 6.97 keV, respectively, and the correct emissivity profile will not be measured when assuming too low an ionization parameter. As such, accurate determination of the ionization state of the accretion disc only starts to become important when ξ > 150|$\rm \thinspace erg\rm \thinspace cm{\rm \thinspace s^{-1}\,}\,$| and becomes critical when ξ > 500|$\rm \thinspace erg\rm \thinspace cm{\rm \thinspace s^{-1}\,}\,$|(see also Wilkins et al. 2014). Moreover, since the ionized absorbing material found to be outflowing from the system imprints only narrow absorption features on the iron Kα emission line, any short time-scale variations in this outflow will not affect the measured profile of the broad emission line; thus, the assumed constancy of the absorption parameters between the time periods will not affect the measured emissivity profiles. While, of course, any variation in the ionized outflows may be of interest in understanding the changing conditions around the inner accretion flow and corona during this flare, it is difficult to constrain any variability therein during these short exposures with Suzaku; hence, we aim to reduce the number of free parameters in this work to focus on the variability in the X-ray emitting corona itself.
In order to sensitively probe the variations in the corona through changes in the photon index of the X-ray continuum, the reflection fraction and the emissivity profile of the accretion disc, after initially finding the best-fitting values of the model parameters by minimizing the χ2 fit statistic in xspec, the probability distributions of the free model parameters during each of the time periods, given the observed data, were computed by MCMC calculations as described in Section 4.2. MCMC calculations are able to much more efficiently sample the parameter space than the conventional approach to spectral fitting, minimizing χ2 and stepping through parameter values to find errors, and are much less prone to falling into local minima in the goodness-of-fit statistic; thus, they are well suited to finding the best-fitting values of the model parameters to these shorter exposures from the low-flux epoch and determining the range of parameter values that are admitted by the data.
A total of 24 MCMC walkers were started at the best-fitting point in the model parameter space found by minimizing χ2 and run for 10 000 steps each, discarding the first 1000 steps. In order to check that the Markov chains adequately sample the parameter space, it was confirmed that the fraction of steps that were rejected due to a worsening fit was less than 75 per cent (the rule of thumb for MCMC model fitting) and also that each of the walkers converged on the same set of parameter values by the end of their respective chains. The probability distributions for each of the free parameters were then constructed from histograms of the parameter values across the steps of all chains.
5.2 Results
The best-fitting model parameters to the X-ray spectrum from the time periods before, during and after the flare are shown in Table 4, while the probability distributions of qout, the outer power-law slope in the once-broken power-law emissivity profile, are shown in Fig. 7.
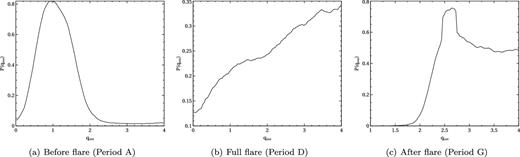
The probability distribution of qout, the outer slope of the once-broken power-law emissivity profile of the reflection from the accretion disc given the spectra observed before, during and after the X-ray flare seen during the 2013 Suzaku observation of Mrk 335.
Best-fitting values of the free parameters of the continuum and relativistically blurred reflection model components from each time period during the 2013 observation of Mrk 335 in a low-flux state by Suzaku. Parameters allowed to vary between the time periods were the reflection fraction, R (defined to be the ratio of photon counts in the reflection to continuum component extrapolated over the energy range 0.1–100 keV), the photon index, Γ, of the power-law continuum, the inner radius of the accretion disc and the inner power-law index, qout, and break radius rbr of a once-broken power-law accretion disc emissivity profile. Also allowed to vary was the outer power-law index of the emissivity profile, for which probability distributions are shown in Fig. 7.
| Time period | R | Γ | rin | qin | rbr | χ2/ν |
|---|---|---|---|---|---|---|
| (A) Before flare | |$9_{-6}^{+7}$| | 1.77 ± 0.01 | 1.26 ± 0.02 | 7.7 ± 0.3 | 7.6 ± 1.5 | 1.06 |
| (B) Early | |$14_{-13}^{+23}$| | 1.82 ± 0.02 | 1.27 ± 0.02 | 7.2 ± 0.4 | 7.0 ± 1.9 | 0.92 |
| (C) Late | >21 | 1.82 ± 0.02 | 1.30 ± 0.03 | 7.8 ± 0.4 | 7.1 ± 1.7 | 1.06 |
| (D) Full flare | |$1.8_{-1.5}^{+1.2}$| | 1.94 ± 0.04 | 1.25 ± 0.01 | 9.9 ± 0.1 | 7.3 ± 1.7 | 1.01 |
| (E) Flare rise | |$2.2_{-0.7}^{+1.1}$| | 2.01 ± 0.06 | 1.25 ± 0.01 | 9.8 ± 0.1 | 7.3 ± 1.7 | 0.97 |
| (F) Flare fall | |$1.7_{-1.6}^{+1.3}$| | 1.62 ± 0.01 | 1.29 ± 0.03 | 9.5 ± 0.4 | 6.8 ± 2.0 | 1.43 |
| (G) After flare | |$14_{-12}^{+18}$| | 1.81 ± 0.01 | 1.25 ± 0.01 | 8.5 ± 0.3 | 3.4 ± 0.3 | 1.03 |
| (H) Immediately after 1 | |$4_{-3}^{+3}$| | 1.70 ± 0.02 | 1.27 ± 0.02 | 9.3 ± 0.4 | 4.3 ± 1.7 | 1.12 |
| (I) Immediately after 2 | >22 | 1.80 ± 0.03 | 1.27 ± 0.02 | 9.1 ± 0.4 | 3.7 ± 1.0 | 0.95 |
There is a clear change in the geometry and energetics of the corona during the X-ray flare, indicated by a significant decrease in the reflection fraction and increase in the photon index of the continuum during the flare before they return to their previous values. This behaviour is consistent with the long time-scale variability, a softening continuum spectrum and decreased reflection fraction, suggesting a cooling and expanding corona as the X-ray flux increases. The measured inner radii of the accretion disc from all time periods before, during and after the flare show no evidence for movement of the inner edge of the disc or truncation thereof.
Looking at the best-fitting once-broken power-law emissivity profile to each of the spectra, there is a clear change in the corona between the time periods before and after the flare. In all cases, the emissivity profile is found to fall steeply over the inner part of the accretion disc, with the power-law index tightly constrained to being greater than 7 in each case. The break radius is found to be around 7rg during each time period before and during the flare, but then decreases to around 4rg after the flare. The most notable difference, however, is in the observed slope in the emissivity profile of the outer part of the accretion disc, which, from Section 3.1.2, is the most sensitive to the spatial extent of the corona.
The probability distributions of this parameter in Fig. 7 show that before the flare, the outer section of the emissivity profile is significantly flatter than qout = 3, which we see from Section 3.1 would be expected not only in the classical case, but in the case of a compact X-ray source confined close to the black hole. The measurement of a power-law index <2 over the outer part of the disc is suggestive of flattening of the middle section of the emissivity profile, and combining this with the observation that the inner part of the profile is steep suggests that the corona during this time period is spatially extended.
After the flare, we clearly see that the power-law index of the emissivity profile over the outer disc becomes significantly steeper, shifting from qout ≲ 2 before the flare to qout ≳ 2.5 afterwards. In order to better understand this change in the best-fitting power-law indices, the emissivity profiles of the accretion disc were measured directly from the profile of the iron Kα emission line using the method of Wilkins & Fabian (2011), detailed in Section 3.1.1, from the total combined spectra before and after the flare. The measured emissivity profiles are shown in Fig. 8. We see that the apparent flattening seen in the average emissivity profile from the whole Suzaku low-flux epoch observation in Fig. 5 results entirely from the period before the flare. The flattening seen in the emissivity profile before the flare is consistent with a corona extending over the inner regions of the accretion disc to a radius no further than 5rg, while the high reflection fraction implies that it extends only a few gravitational radii vertically, above the disc. On the other hand, the emissivity profile after the flare consists of only a steep inner part, transitioning to a fall-off slightly steeper than r−3 with no flattening, indicating a compact corona within just 2rg of the central black hole. This conclusion is further supported by the extremely high reflection fraction (R > 22) measured after the flare. Thus, we see that the X-ray flare marks a reconfiguration of the corona from an extended entity, covering the inner part of the accretion disc, to a much more compact source of X-ray emission.
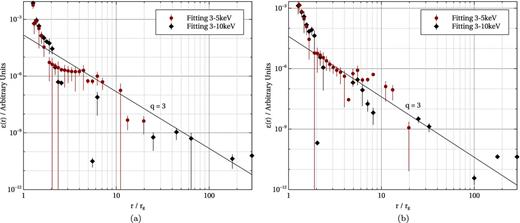
The emissivity profile of the accretion disc from the periods (a) before and (b) after the flare in the 2013 low-flux epoch observed by Suzaku measured by decomposing the relativistically blurred reflection from the accretion disc into the contributions from successive radii over both the 3–10 and 3–5 keV energy bands.
During the flare itself, the reflection fraction drops significantly with the extra X-ray flux during the flare largely seen directly in the continuum, rather than in the reflection from the accretion disc. The reflected photon count exceeds that seen in the continuum by a factor of more than 10 before and after the flare, while during the flare itself, the enhancement in the continuum reduces the reflection fraction to approximately 2.
It is difficult to constrain the outer power-law index of the emissivity profile during the flare since the flare is short and the reflection fraction is diminished. A steeper index is preferred by the data during the whole period of the flare (pegging at the upper limit of 4); however, this distribution is broad and the outer power-law index is steepened only within 1σ from that during the pre-flare period.
The significant drop in the reflection fraction, combined with the apparent steepening emissivity profile, is consistent with the corona becoming collimated, during the flare, into a jet-like configuration, while mildly relativistic outward motion of material in the corona in this jet-like configuration can help to explain such a dramatic drop in the reflection fraction from such a compact corona (e.g. Beloborodov 1999). Since the corona is now covering less of the inner accretion disc, we expect the emissivity profile to steepen to a power-law index between around 2 and 3 over the outer part of the disc (where the break from 2 to 3, or, in this case, the average value measured, depends upon the maximum vertical extent of this collimated, jet-like corona).
We note a poorer fit to the spectrum during time period F, the decline of the flare. This is due to excess emission (at approximately the 1.5σ level) in four spectral bins between 3.0 and 3.1 keV that appears only during this period. This time period is too short, however, for there to be sufficient photon counts to determine the cause of this excess.
During the flare, the continuum spectrum softens, with the photon index increasing from Γ = 1.77 ± 0.01 before the flare to 2.01 ± 0.06 during the flare, while dividing the observation into shorter time periods during and immediately after the flare shows that during the decline of the flare, the continuum spectrum actually hardens to Γ = 1.62 ± 0.01, harder than the average photon index measured over the period following the flare. Combining this observation with the increases in the reflection fraction immediately before (period C) and after the flare (period I) suggests that the corona is compressing before it outbursts into the flare when it cools, softening the continuum spectrum. Then, as the flare declines, the corona becomes extremely compact and hot, increasing the reflection fraction and decreasing the photon index. Finally, it expands and cools again slightly as the spectrum softens slightly to the pre-flare photon index. The evolution of the corona during the flare is illustrated in Fig. 9.
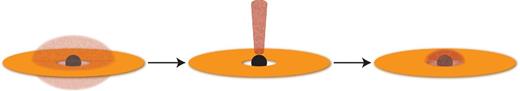
The inferred evolution of the geometry of the X-ray emitting corona in Mrk 335 during the flare during the 2013 low-flux epoch observation with Suzaku. The emissivity profiles of the accretion disc before and after the flare show that the event corresponds to a reconfiguration of the corona from a slightly extended to compact system, confined within around 2rg of the black hole, while the sharp drop in the reflection fraction and the probability distribution of the best-fitting power-law indices to the emissivity profile suggest that the flare itself is linked to a vertical collimation of the corona into a jet-like configuration before dissipating.
6 DISCUSSION
Looking at the variability of Mrk 335 on long time-scales, we observe two major patterns in the evolution of the X-ray emitting corona as the source transitions from lower to higher flux epochs. In general, as the X-ray luminosity increases, the corona expands and the X-ray continuum it emits softens. The corona was found to expand from a compact configuration, confined to within just 2 ∼ 3rg of the black hole, during the lowest flux epochs, becoming more extended (to less than 12rg around the black hole) in the intermediate-flux epoch seen in 2009, then expanding to a much more extended configuration during high-flux epochs, reaching 26rg over the accretion disc during the 2006 XMM–Newton observation.
During this observation, Kara et al. (2013) measure a time lag of ∼150 s between correlated variations in energy bands dominated by the primary X-ray continuum and by its reflection from the accretion disc. Interpreting this as the light travel time between the primary X-ray source and the reflecting accretion disc and taking the mass of the black hole to be 2.6 × 10⁷|$\rm \thinspace M_{{\odot }}$| (Grier et al. 2012) allow the average height of the corona vertically above the accretion disc to be calculated as ∼1.5rg (Wilkins & Fabian 2013).
Ray tracing simulations show that for such a radially extended corona, the reflection fraction is insensitive to the vertical extent of the corona (so long as it lies below 10rg) so the corona was taken to extend from 1rg to 2rg above the disc to be consistent with the lag. For a corona extending to 19rg, the lower bound of the measured extent at the 90 per cent confidence level, the ratio of the number photons from the corona that are incident upon the disc to that which is able to escape is 1.45. When photons are emitted from an accretion disc with the measured emissivity profile, only 72 per cent of those photons were found to be able to escape to be detected in the reflection spectrum (including those that are returned to the disc to give higher order reflections), thus predicting a reflection fraction of 1.04, slightly underestimating the measured value of |$1.3_{-0.2}^{+0.4}$|. We find, however, that if the central regions of the corona are more luminous than the extremities, as might be expected if more energy is liberated from the inner regions of the accretion flow, even with just a slight luminosity gradient, proportional to r−0.5, the observed reflection fraction is consistent with the inferred extent of the corona and no such a steep gradient as to affect the measured emissivity profile, though a more complete study of the reflection fraction expected from extended coronæ will be conducted in future work.
During the intermediate-flux epoch, the emissivity profile constrained the radial extent of the corona to being less than 12rg over the surface of the disc; however, the measured reflection fraction of |$1.8_{-0.3}^{_0.3}$| further constrains the radial extent of the corona to being within 6rg if the luminosity is constant throughout the corona. The radial extent of the corona is still constrained only to within 12rg, however, if the corona is brighter in the central parts.
As the corona expands into the higher flux epochs, the continuum spectrum softens with an increasing photon index (except for the anomalous value measured during the 2007 low-flux epoch observed by XMM–Newton). The increasing X-ray flux from an expanding corona suggests that the optical depth experienced by seed photons from the accretion disc is not decreasing; therefore, the softening in the continuum spectrum, from Γ = 1.9 to 2.5, following Wilkins et al. (2014), is caused by an increase in the temperature of the corona from the high- to low-flux epochs of around 90 per cent, assuming that the optical depth remains constant.
While the spectra appear similar by eye, we find that the two high-flux epochs measured by XMM–Newton and Suzaku in 2006 correspond to very different configurations of the corona. During the XMM–Newton observation, the corona was found to be radially extended over the inner part of the accretion disc, spanning to a radius of around 26rg. On the other hand, during the Suzaku observation later that year, the observed spectrum suggests that the corona has become vertically collimated into a jet-like configuration up the rotation axis of the black hole, perpendicular to the disc plane. During this observation, the reflection fraction (the ratio of photons reflected from the accretion disc to those detected in the continuum) was found to be 0.27. This is significantly less than unity, as would be expected in the case of either a greatly extended source or point source located at a point a large distance from the black hole where an observer would see the accretion disc subtending a solid angle of 2π; thus, half of the emitted rays should be reflected and half observed directly. Seeing such a low reflection fraction from a vertically collimated, jet-like corona suggests that material in the corona may be moving at relativistic speeds up the jet-like structure. This would cause the continuum emission from the corona to be beamed into the direction of motion, away from the disc, explaining the low reflection fraction measured. This vertically collimated phase of the corona is not long-lived, with the source dropping back into a low-flux state within just a year, before it was observed by XMM–Newton in 2007 July.
Dauser et al. (2013, see also Wilkins & Fabian 2012) show, however, that relativistic motion of the jet causes a reduction in the emissivity of the inner part of the accretion disc as the beaming of emission upwards in the jet leads to less illumination of this region. This can cause emission lines from the disc to appear narrower and give the appearance of a truncated accretion disc. In this instance, we clearly detect reflected emission from the innermost regions of the accretion disc and, moreover, measure a steeply falling emissivity profile over the inner parts. To reconcile these results, we infer that the base of the jet-like structure is not moving relativistically such that it can illuminate the inner regions of the accretion disc, and that the material is accelerated as it travels up the lower part of the jet. Gallo et al. (2015), following Beloborodov (1999), show that the measured reflection fraction is consistent with a jet velocity β = v/c = 0.28. This is the escape velocity at 25rg from the black hole. Mrk 335 is generally considered to be radio-quiet (although there were no radio observations during this epoch), suggesting that the material does not escape from the corona and is not able to form extended jets and lobes characteristic of radio galaxies (Ghisellini, Haardt & Matt 2004). We therefore conclude that the base of the corona should be slow-moving and, if we are to assume that there was no radio emission during this epoch, the material has been accelerated to β = 0.28 within 25rg of the black hole. The material is able to continue moving up the jet, since the emissivity profile of the accretion disc suggests illumination by a corona extending at least 50rg from the black hole, though presumably in the upper parts of the jet, the material is decelerated and brought back down by the gravitational attraction of the black hole.
Intrinsic absorption by outflowing material, possibly a wind arising from the accretion disc, is detected at some level during all epochs (Longinotti et al. 2013), except the 2006 high-flux epoch observed by Suzaku (Larsson et al. 2008). We note that it is when the corona is found to have become collimated into a jet-like structure that the outflow is lost. King et al. (2013) report an apparent dichotomy between black holes across the mass scale between dominance of the jet power and the power in outflowing winds, with a transition occurring at LBol ∼ 10−2LEdd with the jet power dominating at lower luminosities and the wind power dominating at higher luminosities. They also report that jets and winds obey the same scaling relations to the luminosity, suggesting that they may be driven by the same underlying process. It is possible that we have observed Mrk 335 undergo this transition and a change in the mass accretion rate (leading to a change in the bolometric luminosity) that accompanied the collimation of the corona and the loss of the outflow.
Underlying this general behaviour on long time-scales is more complex variability, exemplified by an X-ray flare observed during the low-flux epoch observed by Suzaku in 2013. During this flare, the X-ray flux doubles for a period of 90 ks before returning to its previous level. Measurements of the emissivity profile of the accretion disc before and after this event show that it marks a reconfiguration of the X-ray source from an extended corona (albeit quite small, spanning to a radius of only 5rg) to a much more compact source within just 2 ∼ 3rg from the black hole.
While the emissivity profile of the accretion disc during the flare itself is not well constrained, the flare being quite short in duration, the probability distribution parameters of the broken power-law emissivity profile suggest an initial steepening of the emissivity profile as the flare begins, prior to the final steepening as the corona collapses down to the compact configuration following the flare. The steepening of the emissivity profile into the flare, combined with the dramatic reduction in the reflection fraction, suggests that the corona becomes collimated into a jet-like configuration for a short time before dissipating.
The average reflection fraction measured during the 2013 low-flux epoch suggests that, on average, the corona was confined to within 1.5rg of the black hole, while in order to explain the extremely high reflection fractions seen immediately before and after the flare, it would appear that the corona was confined within just 0.5rg radially from the rotation axis of the black hole, while being within just 0.3rg vertically of the event horizon. During the flare itself, the reflection fraction reducing to |$1.8_{-1.5}^{+1.2}$| suggests that the corona extended vertically more than 4rg from the black hole, though given the uncertainty in the measurement, it is not possible to constrain the upper bound of the extent of the corona.
While it is generally believed that jets are launched from the accretion flows on to black holes by magnetic fields anchored to the disc that become twisted into a jet-like structure, accelerating particles along their length (Blandford & Rees 1974), the exact mechanism by which energy is released and the jets are accelerated remains unknown. The model of Blandford & Znajek (1977) suggests that magnetic field lines threading the event horizon of the black hole are able to tap energy from the spin of the black hole to drive the jets while Blandford & Payne (1982) suggest that the jets are launched by the magnetocentrifugal acceleration of particles by the magnetic field lines anchored to the orbiting disc material. McKinney, Tchekhovskoy & Blandford (2012) studied a series of general relativistic magnetohydrodynamical (GRMHD) simulations. They find that toroidal magnetic fields are accreted inwards to form a strongly magnetized, transient dipolar jets, while poloidal magnetic fields are readily accreted and cause the inner part of the disc to become compressed, before a critical magnetic flux density is reached and the magnetic field undergoes an inversion and the field responsible for compressing the inner part of the disc is lost.
Gallo et al. (2015) demonstrate that an observed correlation between hardness ratio and count rate that appears only in the time period following the flare can be explained by an increase in the ionization of the accretion disc as the X-ray count rate subsides. This can be explained by the compression of the disc by the accreted poloidal magnetic field as the flare begins and the corona begins to launch into the jet-like structure and then the loss of the magnetic field following the inversion, allowing the compressed disc to expand again. The decreasing density of the inner accretion disc reduces the recombination of electrons and ions so, subject to illumination by similar levels of X-ray flux from the corona, the disc reionizes. During the time periods immediately following the flare, we notice that the reflection fraction becomes extremely high and the continuum spectrum hardens to a lower photon index than is observed either before the flare or the average of the whole period after the flare, suggesting that immediately following the fall of the flare, the X-ray has collapsed into a small but hot corona, before cooling (although remaining compact) towards the end of the observation.
7 CONCLUSIONS
The long and short time-scale variability in the X-ray emitting corona of Mrk 335 was studied through measurement of the emissivity profile of the accretion disc, the varying fraction of X-rays emitted from the corona that are reflected from the accretion disc and the photon index of the X-ray continuum.
On long time-scales, the X-ray luminosity is seen to vary by more than an order of magnitude, corresponding to an expansion of the corona to a fill a larger volume, covering the inner regions of the accretion disc out to around 26rg during the highest flux epoch observed in 2006, then contracting to within 12rg and 5rg respectively, during 2009 intermediate- and 2013 low-flux epochs. This expansion corresponds to a cooling of the corona, with a softening of the continuum spectrum from Γ = 1.9 during the 2013 low-flux epoch to Γ = 2.5 in the 2006 high-flux epoch.
While the earlier 2006 high-flux epoch, observed by XMM–Newton, is well described by a corona extending to a low height, over the surface of the accretion disc, the measured emissivity profile of the later 2006 high-flux epoch observed by Suzaku suggests a vertically collimated jet-like corona with the low measured reflection fraction suggesting relativistic motion of the X-ray emitting material away from the black hole.
Underlying this time-averaged behaviour on long time-scales are more complex behaviours on short time-scales. Measurement of the emissivity profile of the accretion disc before an X-ray flare during the 2013 low-flux observation shows that this flare corresponded to a reconfiguration of the X-ray source from a slightly extended corona reaching around 5rg over the surface of the disc before the flare to a much more compact configuration within approximately 2 ∼ 3rg after the flare. There is no evidence for truncation of the accretion disc during the flare, with the inner radius of the accretion disc consistent with the ISCO of a maximally spinning black hole at all times during the observation.
The variation in the reflection fraction as well as a steepening in the best-fitting index of a power-law fit to the emissivity profile during the flare may suggest that the flare itself corresponds to an ‘aborted jet launch’ during which the corona becomes collimated and vertically extended for a short time before collapsing into the compact post-flare configuration, with the continuum spectrum hardening beyond the pre-flare spectrum, before finally returning to the original photon index.
Low-flux epochs in AGN represent unique opportunities to study the environments in the strong gravitational fields close to black holes, allowing for clear observation of relativistically blurred reflection from the inner few gravitational radii on the accretion disc, with less dilution by the outer disc and X-ray continuum. Observing the changes in the physical properties of the X-ray emitting corona, its geometry and energetics, will enable comparisons to be made between observed AGN and theoretical predictions of coronæ arising close to supermassive black holes from GRMHD simulations and will shed further light on the physical processes that inject the gravitational energy from the accretion flow into X-ray emitting coronæ to power some of the brightest persistent sources of electromagnetic radiation in the Universe.
DRW is supported by a CITA National Fellowship. This work is based on observations obtained with XMM–Newton, an ESA science mission with instruments and contributions directly funded by ESA Member States and NASA and has also made use of data obtained from the Suzaku satellite, a collaborative mission between the space agencies of Japan (JAXA) and the USA (NASA). This work also uses observations made by the NuSTAR mission, a project led by the California Institute of Astronomy, managed by the Jet Propulsion Laboratory, and funded by NASA. We thank the anonymous referees for their constructive feedback on the original manuscript.
CITA National Fellow.
We use the xspec_emcee implementation of the python emcee package for X-ray spectral fitting in xspec by Jeremy Sanders (http://github.com/jeremysanders/xspec_emcee).
