


Abstract
From past experiments the average power density spectrum (PDS) of gamma-ray bursts (GRBs) with unknown redshift was found to be modelled from 0.01 to 1 Hz with a power law, f−α, with α broadly consistent with 5/3. Recent analysis of the Swift/Burst Alert Telescope (BAT) catalogue showed analogous results in the 15–150 keV band. We carried out the same analysis on the bright GRBs detected by BeppoSAX/Gamma-ray Burst Monitor (GRBM) and Fermi/Gamma-ray Burst Monitor (GBM). The BeppoSAX/GRBM data, in the energy range 40–700 keV and with 7.8 and 0.5 ms time resolutions, allowed us to explore for the first time the average PDS at very high frequencies (up to 1 kHz) and reveal a break around 1–2 Hz, previously found in Compton Gamma Ray Observatory/Burst and Transient Source Experiment data. The Fermi/GBM data, in the energy band 8–1000 keV, allowed us to explore for the first time the average PDS within a broad energy range. Our results confirm and extend the energy dependence of the PDS slope, according to which harder photons have shallower PDS.
1 INTRODUCTION
Together with the energy spectrum, the temporal behaviour of gamma-ray burst (GRB) light curves holds the key to both the physical mechanism responsible for the production of the prompt gamma rays and the distance from the stellar progenitor at which the energy dissipation into gamma-rays takes place. More than a decade after the first GRB afterglow discoveries, these key questions concerning the GRB prompt emission are yet to be answered. The typical observed durations of pulses span from hundreds milliseconds up to several seconds (e.g. Norris et al. 1996). A proper characterization of the temporal properties at different energy bands is crucial to provide clues to the energy dissipation process at the origin of the gamma-rays. In this context, the average power density spectrum (PDS) provides a way to characterize the phenomenon in terms of a stochastic process starting from the null hypothesis that each long GRB is a different realization of a general unique process. In other words, we assume that the same mechanism can explain the variability observed in different light curves, while the observed variety is due to different conditions, which may vary from different GRBs.
The question whether GRB light curves might entirely be explained in terms of different realizations of a unique stochastic process characterized by a pure red noise, is still open. Interestingly, recent analysis have found evidence for the presence of deterministic components (as opposed to pure stochastic noise) ruling the evolution of a GRB light curve and giving rise to a chaotic behaviour (Greco et al. 2011).
In the context of a pure stochastic process entirely characterized by red noise, in Beloborodov, Stern & Svensson (1998, 2000) (hereafter, BSS98 and BSS00), studied the average PDS of 527 GRBs detected by the Burst and Transient Source Experiment (BATSE; Paciesas et al. 1999) aboard the Compton Gamma Ray Observatory (CGRO) in 25–2000 keV energy band, revealing a typical power-law behaviour spanning almost two orders of magnitude in frequency, from a few 10−2 to ∼1 Hz. The power-law index they found is compatible with 5/3, which is what one expects for the Kolmogorov spectrum of velocity fluctuations within a medium characterized by fully developed turbulence. They also found a sharp break around 1–2 Hz. These results were also supported by the INTEGRAL data analysis of a sample of 10 bright GRBs (Ryde et al. 2003).
A recent analysis of the average PDS of the Swift Burst Alert Telescope (BAT; Barthelmy et al. 2005) data set in the 15–150 keV energy band was carried out for the first time in the GRB rest-frame average, thanks to the large number of GRBs detected by Swift with measured redshift. No significant differences were found between the observer and the rest-frame behaviour (Guidorzi et al. 2012; hereafter, G12). Notably, no evidence for the break around 1–2 Hz was found in the 15–150 keV band. In this work, we aim to study the average PDS in two different unexplored regimes with two different data sets. The goal of this analysis is two fold: (i) we address the same average PDS analysis through two additional data sets from independent satellites and detectors; (ii) these data sets allow us to study the average PDS at very high frequency (up to 1 kHz) with the BeppoSAX/Gamma–Ray Burst Monitor (GRBM) and across a broad energy band such that of Fermi/Gamma-ray Burst Monitor (GBM) from 8 keV to 1 MeV.
In Section 2, we report the sample selection criteria and the data analysis procedure. Results are presented in Section 3, followed by discussion and conclusions, respectively, in Sections 4 and 5. Uncertainties on best-fitting parameters are given at 90 per cent confidence for one interesting parameter unless stated otherwise.
2 DATA ANALYSIS
2.1 Fermi/GBM data selection
We initially started with 829 GRBs detected and covered by GBM from 2008 July to 2011 December. For each GRB, we took the two most illuminated NaI (sodium iodide) detectors, for which we extracted the corresponding light curves with 64 ms resolution, which we then added to have a single light curve. In this early stage, we considered the Time Tagged Event (TTE) files, which hold information about trigger time and energy channel of each detected photon. We excluded all GRBs with no TTE file. In some cases, the TTE data do not cover the whole event and thus were not considered for the present analysis. The GRBs durations were expressed in terms of T90, which we estimated from the background-subtracted light curves (Fig. 1). Background subtraction was performed through interpolation using a polynomial of either first or second order.
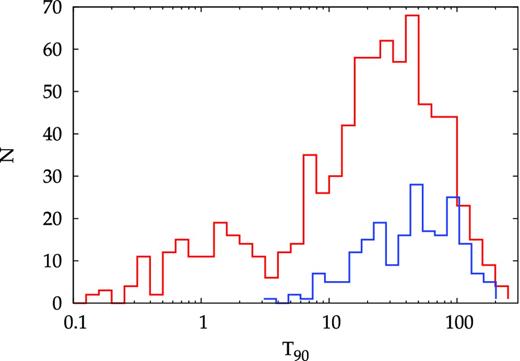
T90 distributions of a sample of 786 GRBs detected by Fermi/GBM in the 8–1000 keV energy band and of the sub-sample of 205 long GRBs selected for the analysis of this work. 126 GRBs have T90 < 3 s, corresponding to ∼ 16 per cent of the whole sample.
We excluded short duration bursts by requiring T90 > 3 s. At this stage, we were left with a sample of 650 GRBs. We then rejected all the GRBs with a poor signal-to-noise ratio (S/N) excluding those with peak rate less than 50 count s−1. Spikes caused by radiative decay of some particles dragged in the Earth magnetic field that interact with the spacecraft payload were observed in 22 light curves, whose GRBs were therefore rejected from our sample (Meegan et al. 2009).
The extraction of the light curves for each GRB in different energy ranges was made retrieving the data1 and processing them with the heasoft package (v6.12) following the Fermi team threads.2 We selected different energy ranges using the tool fselect. We considered the total energy range of the Na i detectors (8–1000 keV) and three main sub-bands (8–40, 40–200, 200–1000 keV). Light curves were extracted using the gtbin tool. Finally, we calculated the PDS for each GRB of the resulting sample in the time interval from the earliest to the latest bin whose counts exceed the 5σ signal threshold above background (hereafter, T5σ). Table 1 reports the time interval and peak count rate for each selected GRB in the 8–1000 keV band. Moreover, we also selected a sub-sample of events with S/N ≥ 60 to better explore the high-frequency behaviour. For this sample, we extracted the light curves with a time resolution of 0.5 ms (hereafter, very high resolution or VHR curves) both in the same energy band explored by the GRBM (40–700 keV) and in the total NaI energy band (8–1000 keV).
Time and Peak count rate. Fermi/GBM full sample including 205 GRBs. The PDS is calculated in the time interval reported. This table is available in its entirety in a machine-readable form in the online journal. A portion is shown here for guidance.
| Trigger | tstart (a) | tstop (a) | Peak rate | T90 |
|---|---|---|---|---|
| (s) | (s) | (count s−1) | (s) | |
| 080714745 | −1.76 | 31.77 | 69.3 ± 4.8 | 39 |
| 080723557 | −0.13 | 119.42 | 460 ± 17 | 77 |
| 080723985 | −0.29 | 52.89 | 127.6 ± 8.1 | 43 |
| 080724401 | −0.11 | 48.34 | 268 ± 20 | 42 |
| 080730786 | −0.91 | 18.54 | 233 ± 14 | 18 |
| 080806896 | −6.98 | 40.63 | 113.1 ± 7.9 | 44 |
| 080807993 | 0.01 | 49.86 | 267 ± 20 | 20 |
| 080810549 | −10.59 | 102.31 | 50.0 ± 4.5 | 58 |
| 080816503 | −0.47 | 69.35 | 122 ± 11 | 65 |
| 080816989 | 0.04 | 29.10 | 98 ± 11 | 6 |
(a)Referred to the Fermi/GBM trigger time.
We then subtracted the white noise and checked its Poissonian nature related to the statistical fluctuations observed in light curves. To check the Poissonian character of noise we estimated the mean power at f > 6 Hz (Table 2) and compared it against the value of 2, namely the expected value of a |$\chi ^2_2$| distribution for pure Poissonian variance in the Leahy normalization (Leahy et al. 1983). Furthermore, we grouped the background-subtracted PDS along frequency so as to fulfil a 3σ significance criterion for each grouped bin. Following the same procedure by G12 for the Swift/BAT data, the selection excluded in each sample (total, low, middle and high energy range) the GRBs whose grouped PDS collected less than four grouped frequency bins.
White noise level (Leahy normalization) for the full Fermi sample. The mean value of this sample is 1.99 ± 0.02. Uncertainties at 1σ. This table is available in its entirety in a machine-readable form in the online journal. A portion is shown here for guidance.
| Trigger | 〈P〉 |
|---|---|
| (f > 6 Hz) | |
| 080714745 | 1.63 ± 0.42 |
| 080723557 | 2.00 ± 0.24 |
| 080723985 | 2.50 ± 0.38 |
| 080724401 | 2.26 ± 0.39 |
| 080730786 | 2.44 ± 0.63 |
| 080806896 | 1.67 ± 0.35 |
| 080807993 | 2.05 ± 0.24 |
| 080810549 | 1.98 ± 0.24 |
| 080816503 | 2.09 ± 0.31 |
| 080816989 | 2.31 ± 0.51 |
We ended up with 205 GRBs that will be referred to as the Fermi sample with a 64 ms time resolution in the total energy range and, respectively, we ended up with 155, 201 and 74 in the three energy sub-bands: 8–40, 40–200 and 200–1000 keV (low, middle and high energies). The VHR sample includes 96 GRBs whose light curves were extracted in the 8–1000 keV and 40–700 keV energy bands. For each of these samples we calculated and modelled the average PDS.
2.2 BeppoSAX/GRBM data selection
For the BeppoSAX/GRBM GRB sample we started from the GRB catalogue (Frontera et al. 2009) by selecting the GRBs fully covered by the high time resolution mode, available only for those which triggered the GRBM onboard logic. We then excluded the GRBs whose light curves were hampered by gaps in the time profiles. Finally, we selected the GRBs with the highest S/N (>40) and ended up with a sample of 89 GRBs. This requirement was motivated by the need of having very good statistical quality even at high frequencies.
Two different kinds of time resolution are available in the GRBM data: (i) light curves with 7.8125 ms resolution from −8 to 98 s from the onboard trigger time (hereafter, these curves are referred to as high-resolution or HR curves); (ii) light curves with ∼0.5 ms for the first 10 s from the trigger time (VHR curves). Therefore, the corresponding Nyquist frequencies are, respectively, 64 Hz and 1 kHz. The VHR light curve can be obtained only for a sub-sample of 74 GRBs. For each GRB, we extracted the PDS in two different time intervals, depending on the type of light curve: the PDS of the HR curves was extracted on the T5σ, like in the case of Fermi/GBM data (Section 2.1), whereas that of the VHR curves was forcibly bound to the first 10 s from the trigger time. Table 3 reports the time interval and peak count rate for each selected GRB of the HR set. Also for BeppoSAX data, the final PDS obtained for each GRB of each sub-sample was grouped according to a 3σ significance criterion excluding the events of the HR sample with fewer than four grouped bins and those of the VHR sample with fewer than 10 bins. Consequently, the final samples include 42 GRBs with HR data and 25 GRBs with VHR data. Hereafter, the two samples are referred to as the BeppoSAX HR and the VHR sample, respectively.
Time and Peak count rate. BeppoSAX/GRBM HR sample including 42 GRBs.
| GRB | tstart a | tstop a | Peak rate | T90 |
|---|---|---|---|---|
| (s) | (s) | (count s−1) | (s) | |
| 970111 | −0.34 | 40.02 | 46.53 ± 1.26 | 31.00 |
| 970117B | −0.25 | 19.00 | 61.63 ± 1.38 | 13.00 |
| 970315A | −0.41 | 20.97 | 116.87 ± 8.15 | 15.00 |
| 970517B | −0.75 | 3.61 | 139.11 ± 5.09 | 5.00 |
| 970601 | 6.99 | 41.75 | 74.83 ± 3.13 | 30.00 |
| 970612B | −0.89 | 37.71 | 14.53 ± 2.49 | 38.00 |
| 970625B | −1.35 | 48.98 | 178.88 ± 9.79 | 15.00 |
| 970627B | −0.73 | 15.86 | 100.03 ± 7.58 | 15.00 |
| 970706 | −9.01 | 72.25 | 15.69 ± 0.61 | 59.00 |
| 970816 | −0.06 | 6.61 | 51.43 ± 2.74 | 6.00 |
| 971027A | −1.66 | 12.20 | 26.89 ± 1.46 | 11.00 |
| 971223C | −6.22 | 50.18 | 52.58 ± 4.13 | 47.00 |
| 980203B | 0.38 | 48.75 | 217.07 ± 8.81 | 23.00 |
| 980306C | 0.62 | 28.25 | 79.07 ± 1.95 | 21.00 |
| 980329A | −1.06 | 36.93 | 73.26 ± 4.15 | 19.00 |
| 980428 | −5.05 | 88.46 | 21.72 ± 1.34 | 100.00 |
| 980615B | 0.94 | 97.48 | 85.10 ± 5.01 | 64.00 |
| 980827C | 0.33 | 87.24 | 158.30 ± 5.36 | 51.00 |
| 981111 | −6.39 | 48.81 | 35.91 ± 2.67 | 34.00 |
| 990128 | 0.67 | 11.30 | 121.88 ± 3.11 | 8.00 |
| 990620 | 0.42 | 13.97 | 38.68 ± 1.72 | 16.00 |
| 990705 | −0.23 | 41.19 | 63.92 ± 3.93 | 32.00 |
| 990913A | 0.03 | 44.54 | 183.03 ± 8.08 | 40.00 |
| 991124B | −1.65 | 25.31 | 8.01 ± 0.62 | 28.00 |
| 991216B | 0.46 | 25.42 | 416.88 ± 11.96 | 15.00 |
| 000115 | 0.04 | 25.71 | 200.84 ± 8.42 | 15.00 |
| 000214A | 0.37 | 8.75 | 58.66 ± 3.60 | 8.00 |
| 000218B | 0.26 | 23.70 | 258.43 ± 11.67 | 20.00 |
| 000419 | 0.72 | 20.70 | 21.65 ± 0.82 | 20.00 |
| 000630 | 0.94 | 44.55 | 21.76 ± 2.02 | 26.00 |
| 000718B | −0.19 | 97.05 | 67.51 ± 2.98 | 34.00 |
| 001004 | 1.10 | 11.20 | 191.46 ± 8.26 | 9.00 |
| 001011C | 0.94 | 31.62 | 29.67 ± 1.42 | 24.00 |
| 001212B | 0.64 | 72.46 | 45.83 ± 3.10 | 67.00 |
| 010109 | 0.90 | 22.17 | 293.48 ± 6.62 | 7.00 |
| 010317 | 0.87 | 31.03 | 210.87 ± 8.65 | 30.00 |
| 010408B | 0.23 | 6.40 | 199.33 ± 8.39 | 3.81 |
| 010412 | −1.49 | 65.48 | 24.62 ± 2.47 | 60.00 |
| 010504 | −0.12 | 19.84 | 42.79 ± 4.07 | 15.00 |
| 010710B | 1.06 | 27.05 | 53.73 ± 4.50 | 20.00 |
| 010922 | 0.60 | 41.52 | 19.20 ± 1.30 | 40.00 |
| 011003 | −0.94 | 45.41 | 36.72 ± 1.81 | 34.00 |
Note. The PDS is calculated in the time interval reported.
aReferred to the BeppoSAX/GRBM trigger time.
2.3 PDS calculation
Each PDS was calculated through the mixed-radix Fast Fourier Transform algorithm implemented within the GNU Scientific Library (Galassi et al. 2009),3 which does not require the total number of bins to be of a power of 2 (Temperton 1983) similarly to what was done for the Swift/BAT sample (G12). We calculated the PDS for each GRB adopting the Leahy normalization. For each individual PDS the background level, corresponding to the white noise due to counting statistics, was initially estimated by fitting with a constant the high-frequency range, where the signal is negligible with respect to the statistical noise.
Within the Leahy normalization, a pure Poissonian noise corresponds to a power value of 2. Therefore, we checked the high-frequency constant value for the power averaged out among all the PDSs. For Fermi sample the mean value of white noise level is estimated at 1.99 ± 0.02 for f > 6 Hz, fully consistent with a Poissonian variance. For the BeppoSAX samples the PDS shows evidence for the presence of a small, significant extra-Poissonian variance of (3.7 ± 1.2) per cent and (0.94 ± 0.35) per cent for the HR and the VHR samples, respectively, in addition to the statistical white noise. These values were estimated in the frequency range above 50 Hz.
The statistical noise was removed in two different way for different cases. For the Fermi sample, noise was assumed to be perfectly Poissonian, compatibly with what we found above. Instead, for the BeppoSAX samples it was obtained from fitting the PDS with a constant value estimated at sufficiently high frequencies (f > 50 Hz) for each event of the HR sample. The estimated background levels are reported in Table 4. As can be seen in Table 5 for VHR data, the white noise becomes dominant already at f > 30 Hz (at higher frequency compared to the Fermi case). Indeed, we did not find significantly different values for the mean power between the two following frequency ranges: f > 30 Hz and f > 50 Hz.
White noise level (Leahy normalization). BeppoSAX HR sample.
| GRB | 〈P〉 (f > 30 Hz) | 〈P〉 (f > 50 Hz) |
|---|---|---|
| 970111 | 2.13 ± 0.09 | 2.11 ± 0.15 |
| 970117B | 2.11 ± 0.14 | 2.17 ± 0.22 |
| 970315A | 2.09 ± 0.13 | 2.09 ± 0.20 |
| 970517B | 2.50 ± 0.31 | 2.19 ± 0.46 |
| 970601 | 2.18 ± 0.10 | 2.24 ± 0.16 |
| 970612B | 2.15 ± 0.10 | 2.14 ± 0.15 |
| 970625B | 2.10 ± 0.08 | 2.04 ± 0.13 |
| 970627B | 2.02 ± 0.15 | 1.94 ± 0.26 |
| 970706 | 2.09 ± 0.07 | 2.13 ± 0.10 |
| 970816 | 1.75 ± 0.22 | 1.88 ± 0.35 |
| 971027A | 1.98 ± 0.16 | 1.95 ± 0.25 |
| 971223C | 2.13 ± 0.08 | 2.22 ± 0.13 |
| 980203B | 2.07 ± 0.09 | 2.04 ± 0.13 |
| 980306C | 1.96 ± 0.11 | 1.97 ± 0.17 |
| 980329A | 2.06 ± 0.10 | 1.98 ± 0.15 |
| 980428 | 2.08 ± 0.06 | 2.14 ± 0.10 |
| 980615B | 2.10 ± 0.06 | 2.08 ± 0.09 |
| 980827C | 2.08 ± 0.06 | 2.18 ± 0.10 |
| 981111 | 2.16 ± 0.08 | 2.19 ± 0.13 |
| 990128 | 2.11 ± 0.19 | 2.08 ± 0.29 |
| 990620 | 2.13 ± 0.16 | 2.12 ± 0.26 |
| 990705 | 2.07 ± 0.09 | 1.97 ± 0.14 |
| 990913A | 1.94 ± 0.09 | 1.95 ± 0.14 |
| 991124B | 2.11 ± 0.12 | 2.14 ± 0.18 |
| 991216B | 2.01 ± 0.12 | 2.01 ± 0.19 |
| 000115 | 2.06 ± 0.12 | 2.03 ± 0.18 |
| 000214A | 2.12 ± 0.21 | 1.91 ± 0.32 |
| 000218B | 2.44 ± 0.13 | 1.81 ± 0.18 |
| 000419 | 2.12 ± 0.13 | 2.05 ± 0.21 |
| 000630 | 2.03 ± 0.09 | 2.03 ± 0.14 |
| 000718B | 2.10 ± 0.06 | 2.05 ± 0.09 |
| 001004 | 2.05 ± 0.19 | 1.99 ± 0.29 |
| 001011C | 2.07 ± 0.11 | 2.00 ± 0.18 |
| 001212B | 2.04 ± 0.07 | 2.12 ± 0.11 |
| 010109 | 1.93 ± 0.13 | 1.87 ± 0.20 |
| 010317 | 2.29 ± 0.11 | 2.05 ± 0.17 |
| 010408B | 1.76 ± 0.23 | 1.4 ± 0.34 |
| 010412 | 2.01 ± 0.07 | 2.07 ± 0.11 |
| 010504 | 2.03 ± 0.14 | 1.98 ± 0.25 |
| 010710B | 2.07 ± 0.12 | 2.00 ± 0.18 |
| 010922 | 2.06 ± 0.09 | 2.09 ± 0.15 |
| 011003 | 2.10 ± 0.09 | 2.17 ± 0.14 |
Note. Table of white noise level at f > 30 Hz and at f > 50 Hz related to the sub-sample of 42 GRBs detected by BeppoSAX/GRBM with 7.8 ms time resolution. Uncertainties at 1σ.
White noise level (Leahy normalization). BeppoSAX VHR sample.
| GRB | 〈P〉 (f > 30 Hz) | 〈P〉 (f > 50 Hz) |
|---|---|---|
| 970315A | 2.00 ± 0.03 | 2.00 ± 0.03 |
| 970517B | 2.03 ± 0.03 | 2.03 ± 0.03 |
| 970601 | 2.12 ± 0.03 | 2.10 ± 0.04 |
| 970625B | 2.02 ± 0.03 | 2.01 ± 0.03 |
| 970627B | 2.02 ± 0.03 | 2.02 ± 0.03 |
| 970816 | 1.97 ± 0.04 | 1.98 ± 0.04 |
| 980203B | 2.01 ± 0.03 | 2.01 ± 0.03 |
| 990128 | 2.04 ± 0.03 | 2.04 ± 0.03 |
| 990620 | 2.06 ± 0.03 | 2.06 ± 0.03 |
| 990705 | 2.04 ± 0.03 | 2.04 ± 0.03 |
| 990913A | 1.97 ± 0.03 | 1.97 ± 0.03 |
| 991216B | 1.91 ± 0.03 | 1.91 ± 0.03 |
| 000115 | 2.01 ± 0.03 | 2.01 ± 0.03 |
| 000214A | 2.03 ± 0.03 | 2.03 ± 0.03 |
| 000630 | 2.05 ± 0.03 | 2.05 ± 0.03 |
| 001004 | 1.99 ± 0.03 | 1.98 ± 0.03 |
| 001212B | 2.06 ± 0.03 | 2.06 ± 0.03 |
| 010109 | 1.94 ± 0.03 | 1.94 ± 0.03 |
| 010317 | 2.04 ± 0.03 | 2.03 ± 0.03 |
| 010408B | 1.99 ± 0.03 | 1.99 ± 0.03 |
| 010504 | 2.01 ± 0.04 | 2.01 ± 0.04 |
Note. Table of white noise level at f > 30 Hz and at f > 50 Hz related to the sub-sample of 25 GRBs detected by BeppoSAX/GRBM with 0.5 ms time resolution. Uncertainties at 1σ.
After calculating the white noise level for each GRB, we subtracted it and renormalized the PDS by the corresponding net variance (G12). This choice ensures that all GRBs have equal weights in the average PDS.
The binning scheme used to average the PDS is different for each considered sample. In the Fermi case with 64 ms binning time the Nyquist frequency is 7.8125 Hz, so we defined a uniform frequency binning scheme with a step of 0.01 Hz. At f < 0.01 Hz, we considered two bins, 0.001 Hz ≤ f < 0.005 Hz and 0.005 Hz ≤ f < 0.01 Hz. The same step is used in the frequency grid defined for the average PDS of the HR BeppoSAX data. In the BeppoSAX case, the PDS have correspondingly more frequency bins, due to the higher Nyquist frequency. We took only one single bin from 0.001 Hz and 0.01 Hz. The frequency grid changes for the VHR data: we chose a broader frequency step of 1 Hz because the total PDS extraction time is limited to 10 s for each BeppoSAX light curve and this implies a coarser frequency resolution. For the VHR PDS, we considered four bins with step of 0.2 Hz at f < 1 Hz. For each individual GRB, we calculated the average power in each frequency bin of the corresponding grid described above. Finally, for each frequency bin of the grid we determined the average power over all GRBs of a given sample after they had been renormalized. Finally, the frequency bins of the average noise-subtracted PDS were grouped by requiring at least 3σ significance to reduce the uncertainties at high frequencies.
2.4 PDS fitting
3 RESULTS
3.1 Average PDS at different energy bands
Table 6 reports the best-fitting parameters estimated for the average PDSs for the different GRB samples considered.
Best-fitting parameters of the average PDS for different samples of GRBs.
| Sample | Size | Norm | α1 | fb | α2 | fb2 | α3 | χ2/dof | |
|---|---|---|---|---|---|---|---|---|---|
| (10−2 Hz) | (Hz) | ||||||||
| Fermi/GBM (8–1000 keV)a | 205 | |$5.0_{-0.9}^{+1.2}$| | |$1.06_{-0.07}^{+0.05}$| | |$5.5_{-0.7}^{+0.8}$| | |$1.75_{-0.03}^{+0.03}$| | – | – | 110/100 | |
| Fermi/GBM (8–40 keV)a | 155 | |$3.9_{-1.1}^{+1.5}$| | |$1.20_{-0.08}^{+0.07}$| | |$6.4_{-1.2}^{+1.4}$| | |$1.95_{-0.06}^{+0.07}$| | – | – | 78/54 | |
| Fermi/GBM (40–200 keV)a | 201 | |$5.1_{-1.1}^{+0.7}$| | |$1.03_{-0.04}^{+0.06}$| | |$5.5_{-0.5}^{+1.0}$| | |$1.67_{-0.03}^{+0.02}$| | – | – | 130/115 | |
| Fermi/GBM (200–1000 keV)a | 74 | |$7.3_{-4.2}^{+5.8}$| | |$1.05_{-0.09}^{+0.08}$| | |$3.8_{-1.5}^{+3.4}$| | |$1.47_{-0.04}^{+0.06}$| | – | – | 79/72 | |
| Fermi/GBM FRED (8–1000 keV)a | 10 | |$3.8_{-1.9}^{+3.0}$| | |$1.32_{-0.10}^{+0.10}$| | |$6.3_{-1.9}^{+3.1}$| | |$2.53_{-0.24}^{+0.39}$| | – | – | 16/14 | |
| BeppoSAX/GRBM HR (40–700 keV)b | 42 | |$0.021_{-0.006}^{+0.011}$| | – | – | |$1.49_{-0.04}^{+0.04}$| | |$1.9_{-0.4}^{+0.4}$| | |$2.46_{-0.31}^{+0.44}$| | 145/143 | |
| BeppoSAX/GRBM VHR (40–700 keV)b | 25 | |$0.040_{-0.022}^{+0.048}$| | – | – | |$1.52_{-0.17}^{+0.17}$| | |$2.6_{-0.9}^{+1.0}$| | |$2.91_{-0.41}^{+0.51}$| | 4/7 | |
| BeppoSAX/GRBM HR+VHR (40–700 keV)b, c | 42+25 | |$0.016_{-0.005}^{+0.006}$| ; |$0.053_{-0.014}^{+0.017}$| | – | – | |$1.50_{-0.04}^{+0.03}$| | |$2.1_{-0.3}^{+0.4}$| | |$2.69_{-0.20}^{+0.27}$| | 165/161 | |
| Fermi/GBM VHR (40–700 keV)b, d | 96 | |$0.029_{-0.011}^{+0.015}$| | – | – | |$1.65_{-0.03}^{+0.03}$| | |$1.1_{-0.2}^{+0.3}$| | |$2.41_{-0.19}^{+0.34}$| | 213/200 | |
| BeppoSAX/GRBM HR+VHR + Fermi/GBM VHR (40–700 keV))b, e | 42+25+96 | |$0.027_{-0.008}^{+0.014}$| ; |$0.088_{-0.025}^{+0.042}$| ; |$0.019_{-0.006}^{+0.010}$| | – | – | |$1.60_{-0.03}^{+0.02}$| | |$1.4_{-0.3}^{+0.3}$| | |$2.33_{-0.13}^{+0.15}$| | 502/365 | |
| Fermi/GBM (15–150 keV)a | 200 | |$5.1_{-1.0}^{+1.2}$| | |$1.06_{-0.07}^{+0.06}$| | |$5.5_{-0.7}^{+0.9}$| | |$1.78_{-0.03}^{+0.04}$| | – | – | 95/91 |
Note. Best-fitting parameters of the average PDS of each sample within different energy bands (Fermi) and time resolution (BeppoSAX).
aLow-frequency break.
bHigh-frequency break.
cJoint fitting of two samples with different time resolutions obtained through the minimization of the joint likelihood. The normalization parameters refer to 7.8 and 0.5 ms time resolution, respectively.
dIn this case, the best-fitting parameters were found by fitting the average spectra in the same frequency range considered for BeppoSAX from 0.02 to 1000 Hz.
eJoint fitting of three samples with different time resolutions obtained through the minimization of the joint likelihood. The normalization parameters refer to 7.8 and 0.5 ms time resolution for BeppoSAX and 0.5 ms for the Fermi, respectively.
For the average Fermi PDS extracted in the total energy range 8–1000 keV (Fig. 2) with 64 ms binning time the best-fitting parameters are |$\alpha _1=1.06_{-0.07}^{+0.05}$|, a break at 5.5 × 10⁻² Hz above which the PDS steepens to α2 = 1.75 ± 0.03. This slope of the spectra is very similar to the previous values found in the literature related to the GRBs detected with BATSE in similar energy bands (BSS98, BSS00), and in agreement with the value of 5/3 of a Kolmogorov spectrum. Indeed BSS00 have found an index ranging from 1.50 to 1.72 in the frequency range 0.025 < f < 1 Hz fitting the average PDS resulted from the BATSE sample (20–2000 keV) with a simple power law. Moreover, also for the average PDS of Swift/BAT data (15–150 keV) we see a typical slope described with a low-frequency index α1 = 1.03 ± 0.05 up to a break frequency around 3 × 10⁻² Hz, followed by and an index |$\alpha _2=1.73_{-0.03}^{+0.04}$| (G12). Since the break frequency fb is sensitive to the average characteristic time τ of typical individual shots roughly as fb ∼ 1/(2πτ) (Frontera & Fuligni 1979; Belli 1992; Lazzati 2002), the value we found in the Fermi data corresponds to a mean characteristic time of about 3 s.
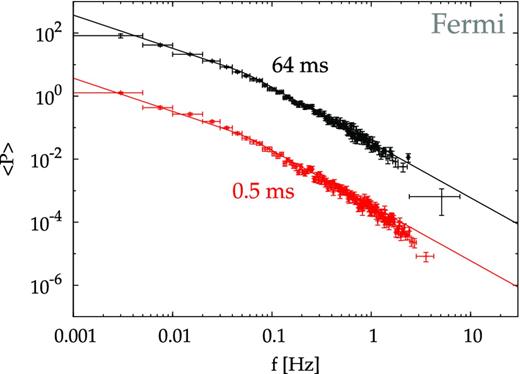
Top (bottom) data show the average PDS for a sample of 205 (96) Fermi/GBM GRBs in the 8–1000 keV energy range with 64 ms (0.5 ms) time resolution. Solid lines show the best-fitting model obtained on the 64 ms data set and the same model renormalized to the 0.5 ms data set, which was shifted for the sake of clarity. The bottom data set clearly deviates from the model at f ≳ 1 Hz.
Comparing the average PDS of the whole Fermi sample with that of the high-quality (S/N ≥ 60) sub-sample extracted with 0.5 ms resolution, the latter data set shows evidence for a further break around 1–2 Hz with respect to the best-fitting model obtained for the former data set (bottom data in Fig. 2). The behaviour of the average PDS at high frequency is thoroughly discussed in Section 3.3 together with BeppoSAX data.
The analysis of the average PDS at different energy channels reveals a clear trend of the spectral shape when we move from soft to hard energy ranges. Fig. 3 displays the average PDS corresponding to three different energy channels: 8–40, 40–200 and 200–1000 keV. The index α2 decreases from 1.95 to 1.47 moving from 8–40 to 200–1000 keV. This reflects the known narrowing of pulses with energy, according to which the same GRB pulse appears to be narrower and spikier at higher energies (Fenimore et al. 1995; Norris et al. 1996; Piro et al. 1998). The same trend was observed in the BATSE average PDS (BSS00), for which the power-law index decreases from 1.72 in the 25–55 keV to 1.50 above 320 keV. Furthermore, a similar behaviour is observed in the Swift data, with α2 varying from |$1.75_{-0.04}^{+0.05}$| to |$1.49_{-0.07}^{+0.08}$| passing from 15–50 to 50–150 keV.
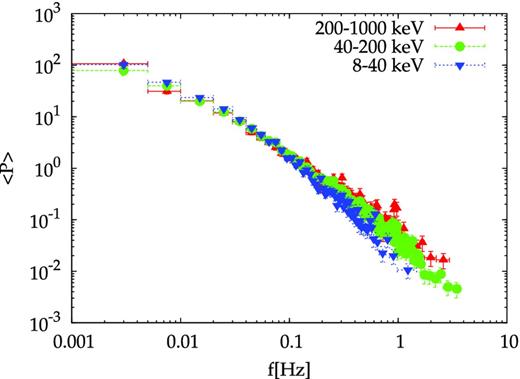
Different slopes observed in the average PDS extracted on the three main energy ranges using a time resolution of 64 ms. Upside–down triangles, circles and triangles show the 8–40, 40–200 and 200–1000 keV energy bands, respectively. The spectrum becomes shallower moving from low to high energies.
We also extracted the light curves in the common energy bands with other instruments so that we can compare results limiting the systematic differences connected with different energy passbands. The average Fermi/GBM PDS obtained in the typical Swift/BAT energy range (15–150 keV) are perfectly consistent with the analogous results on Swift/BAT data, as shown in Fig. 4. The slope indices of average Fermi/GBM PDS for the 15–150 keV are |$\alpha _1=1.06_{-0.07}^{+0.06}$| and |$\alpha _2=1.78_{-0.03}^{+0.04}$|, to be compared with their analogous values found with Swift/BAT, α1 = 1.03 ± 0.05, α2 = 1.73 ± 0.03. So the apparently different values at low frequencies between the two spectra in Fig. 4 is not statistically significant.
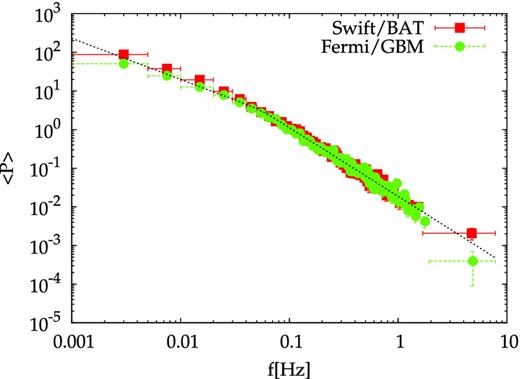
Average PDS of Fermi sample in the 15–150 keV energy range (circles) compared with the Swift/BAT result (squares) provided by G12. Both are calculated from 64 ms binned light curves. The two independent measures are compatible. The dashed line shows the best fitting model for Fermi data.
3.2 FRED sub-sample
We investigated whether the GRBs whose light curves can be described as a single fast rise exponential decay (FRED) show distinctive features in the average PDS. To this aim, we selected 10 GRBs (Fig. 5) of this kind out of the Fermi sample by visual inspection and calculated the corresponding average PDS (Fig. 6). The best-fitting parameters in this case are α1 = 1.32 ± 0.10 and |$\alpha _2=2.53_{-0.24}^{+0.39}$| with a break at about 6 × 10⁻² Hz (see Table 6). That the high-frequency tail of the PDS for the FRED sample is steeper than that of the whole sample of GRBs, agrees with the PDS expected for a single FRED (e.g. see Lazzati 2002). This in turns suggests that the average PDS of multiple-pulse GRBs is shallower because of the presence of various characteristic times. The sum of several PDS with different break frequencies would therefore result in a simple power law with no dominant break in the explored frequency range.
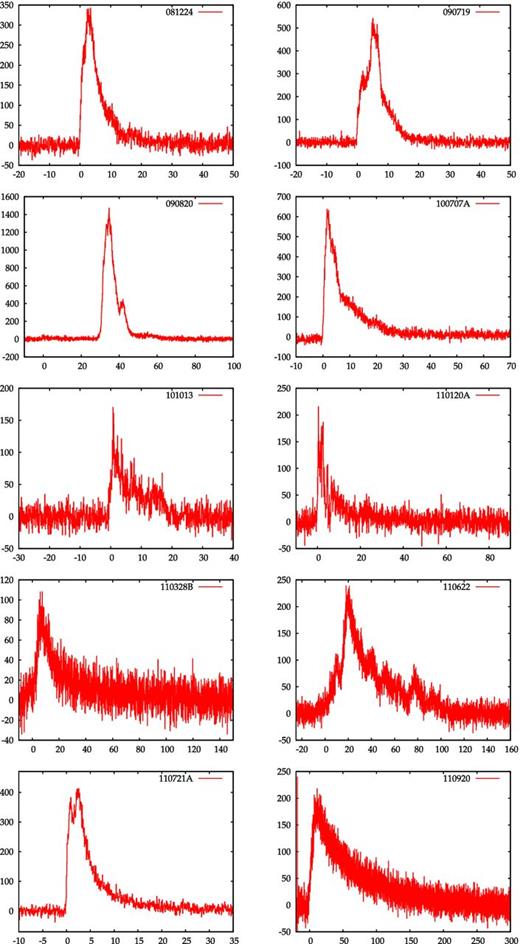
The 10 FRED used in our PDS analysis. Each curve has a 64 ms bin time and is expressed in units of counts s−1 as a function of time.
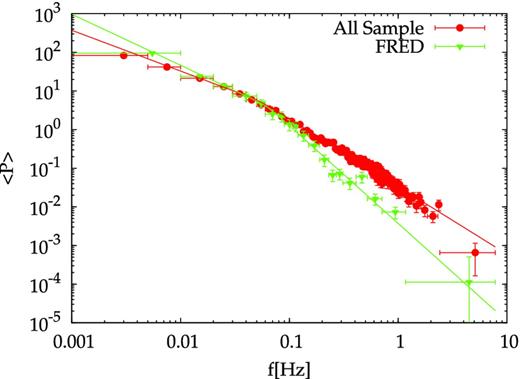
The average PDS of the FRED sample (detected with GBM) is shallower than the average PDS of the full Fermi sample. The energy band is 8–1000 keV for both sets with 64 ms time resolution.
3.3 Average PDS up to high frequency
The average PDS for the HR light curves provided by the BeppoSAX/GRBM shows a second break at high frequency (|$f_{\rm b2}=1.91_{-0.43}^{+0.45}$| Hz). The observed slope can be parametrized with two indices, α2 = 1.49 ± 0.04 and |$\alpha _3=2.46_{-0.31}^{+0.44}$| (we did not use α1, which has previously been used to denote the slope below a few 10−2 Hz). The break is likely to be real because the improvement is significant compared to the same model without it. The F-test yields a probability of 1.26 per cent that the break is not required. The value itself of this break frequency as well as the values of the corresponding power-law indices indicate that this feature has a different origin from the other one observed at lower frequency. This motivated us to adopt a different notation for the power-law index above this break, α3. Overall, the different slopes refer to the corresponding frequency ranges: α1 below a few 10−2 Hz, α2 holds in the range 10−2 < f < 1 Hz and α3 for f ≳ 1 Hz.
When we limit our PDS analysis to the first 10 s of the GRBM trigger time of each GRB light curve and use the VHR data, a very similar result is found for the average PDS, which now extends up to 1 kHz. The best-fitting parameters for these data are α2 = 1.52 ± 0.17, |$\alpha _3=2.91_{-0.41}^{+0.51}$| with a clear break at |$f_{\rm b2}=2.59_{-0.94}^{+1.04}$| Hz (Fig. 7). Also in this case a break in the model is required to fit the data, with a probability of 0.47 per cent that the improvement obtained with the break is due to chance according to the F-test. Furthermore, in Fig. 2 the average PDS obtained from the Fermi VHR sample looks like it also requires a break at f ≳ 1 Hz. To check the mutual compatibility of these data with a broken power-law model, we extracted the Fermi VHR average PDS over the same energy range covered also by GRBM, 40–700 keV. To fit these data above 0.02 Hz, we used a simple power law as well as a broken power law and used the F-test to evaluate the improvement one obtains moving from the former to the latter. We estimate a probability of 3.4 per cent that such improvement is just by chance. We found two different slopes, α2 = 1.65 ± 0.03 and |$\alpha _3=2.41_{-0.19}^{+0.34}$|, with a break at |$f_{\rm b2}=1.1_{-0.2}^{+0.3}$| Hz (χ2/dof = 1.07). We excluded from the fit the lowest frequency point in the BeppoSAX HR PDS and in the Fermi VHR PDS (40–700 keV), because it clearly lies below the extrapolation of a double broken power law, since it is clearly affected by the presence of the low-frequency break.
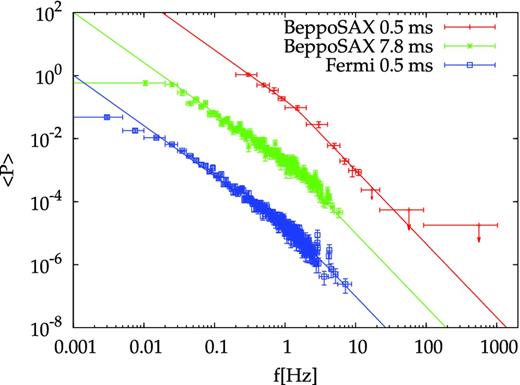
The top, mid and bottom average PDS refer to the BeppoSAX 0.5 ms, 7.8 ms resolution samples and to the Fermi sub-sample with S/N ≥ 60, respectively, for the 40–700 keV band. The break around 1–2 Hz is present in each set. The common best-fitting model is also shown, for both the BeppoSAX and Fermi data sets. The corresponding model parameters were bound to be equal for all the data sets, except for the normalization terms. Upper limits are given at 2σ confidence. Data were shifted vertically for the sake of clarity.
We also performed a combined analysis of the two and three samples, BeppoSAX (HR + VHR) (i.e. BeppoSAX data alone) and BeppoSAX (HR + VHR) plus Fermi VHR, fitting all the spectra simultaneously with the same model, apart from allowing each set a different normalization term. For the BeppoSAX data alone, the resulting break frequency is found to be |$f_{\rm b2}=2.11_{-0.33}^{+0.42}$| Hz, while the two slopes have indices, respectively, |$\alpha _2=1.50_{-0.04}^{+0.03}$| and |$\alpha _3=2.69_{-0.20}^{+0.27}$|. This treatment implicitly assumed the two data sets to be statistically independent. Although this is not completely true, since the 10 s data of the VHR curves are part of the full profile of about 100 s of HR data, on average the common data amount to 10–20 per cent or so. Consequently, the expected correlation between the two data set affects the results within a comparable fraction. By adding the VHR sample extracted with Fermi, we found |$\alpha _2=1.60_{-0.03}^{+0.02}$|, |$\alpha _3=2.33_{-0.13}^{+0.15}$| with a break at fb2 = 1.4 ± 0.3 Hz (χ2/dof = 1.37). We tried to see whether the quality of the fit could be improved by allowing the smoothness parameter to vary (equation 1), thus allowing a smooth transition from one power-law regime to the following one, with no appreciable result though.
Although the white noise subtraction was done through a careful estimation of the high-frequency power (Section 2.3), we examined whether the break could be an artefact of a small bias in the white noise subtraction. More specifically, overestimating the white noise could mimic the appearance of an artificial break. To test this possibility, we extracted the average PDS without noise subtraction, keeping the same relative normalization for each GRB as that of the noise-subtracted case. We fixed the best-fitting model of the noise-subtracted PDS obtained above and fitted the white noise with a constant. Fig. 8 clearly shows that the break in the average PDS occurs when the average signal still dominates the white noise level (by more than one order of magnitude in the VHR data). This rules out the possibility of the break around 1–2 Hz being the result of biased white noise subtraction and suggests it to be a genuine feature of the average PDS at energies above 40 keV.
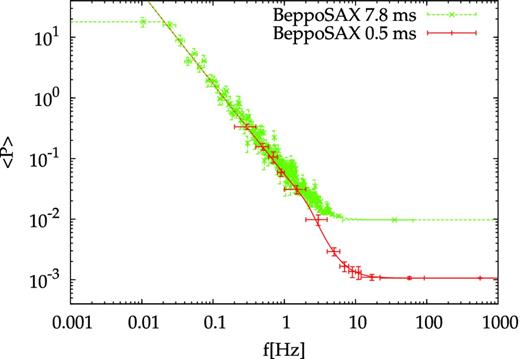
The average PDS obtained from BeppoSAX samples without the white noise subtraction. The break at 1–2 Hz is still evident thanks to the signal being more than one order of magnitude higher than the white noise level. This rules out any bias due to possibly wrong white noise subtraction.
4 DISCUSSION
In general, two distinct sources of time variability have been found to characterize the GRB variability: a fast component dominated by the presence of relatively short (<1 s) pulses and a slow component linked to pulses lasting several seconds (Scargle, Norris & Bonnell 1998; Vetere et al. 2006; Margutti 2009; Gao, Zhang & Zhang 2012). These two kinds of dominant time-scales should be produced by different mechanisms involved in the physical process, and different explanations in different scenarios are available in the literature (Morsony, Lazzati & Begelman 2010; Zhang & Yan 2011; Titarchuk et al. 2012). The simple power-law modelling the average PDS and encompassing nearly two orders of magnitude in frequency is suggestive of some kind of scale invariance within the same frequency range, thus confirming the coexistence of multiple characteristic time-scales.
The study of the average PDS in different energy ranges made possible by Fermi/GBM provides clues to better characterize the different aspects of GRB time variability. The observed energy dependence of the power-law index of the average PDS, α2, in the frequency range 10−2 < f < 1 Hz confirms and extends the results found with previous work and data sets. Indeed, in the 8–1000 keV band the average PDS of long GRBs detected with GBM show a broken power-law behaviour (|$\alpha _1=1.06_{-0.07}^{+0.05}$|, |$\alpha _2=1.73_{-0.03}^{+0.04}$| and fb = 5.5 × 10⁻² Hz) with α2 very close to the slope of average PDS observed in the BATSE analysis (α ≈ 1.67).
More specifically, the average PDS slope undergoes a steep-to-shallow evolution passing from soft to hard energy channels, as shown in Fig. 9. This behaviour is consistent with the narrowing of pulses with energy: Fenimore et al. (1995) found a dependence of the average pulse width w on energy E as w ∝ E−0.4, estimated by measuring the average auto-correlation function (ACF) width for a sample of BATSE bursts as a function of the energy channel. In addition to the energy dependence of the average pulse width, also the shape itself and, in particular, the peakedness of the average ACF depends on energy (BSS00). Indeed, the energy dependence of the shape of the pulse profile explains the energy dependence of the power-law index: if the shapes of a given pulse at different energies were the same, only the break frequency in the average PDS should change correspondingly, while the slope should remain unaffected. Since this is not what is observed, the evolution with energy of the average power-law index in the PDS confirms the change in the shape itself of the energy pulse as a function of energy.
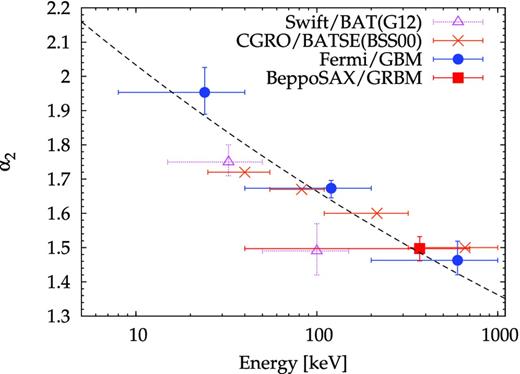
The power-law index of the average PDS in the frequency range 10−2 < f/Hz < 1 obtained from different data sets as a function of energy. The dashed line (α2 ∝ E−0.09) illustrates the α2 dependence on energy as estimated from Fermi data.
Another important result that emerged from the present analysis is the break revealed around 1–2 Hz in the BeppoSAX average PDS. Although the evidence for it in the Fermi data alone is less compelling because of the lower S/N in that frequency range, the Fermi average PDS is fully compatible with it. The joint BeppoSAX–Fermi analysis of such high-frequency break shows that this may significantly vary between 1 and 2 Hz, depending on the GRB sample and on its average S/N. Together with results obtained on Swift data by G12, this break becomes evident at harder energies.
This feature in the average PDS and its possible dependence on energy provides an important clue to constraining theoretical models proposed to explain the physical mechanism involved in GRBs and confirms and strengthens the analogous result obtained by BSS00 on BATSE data. The break could be related to an average intrinsic variability time-scale, Δt ≲ 0.1 s, below which the temporal power changes regime. This may link directly to the central engine. Alternatively, it could be related to the variation of the outflow Lorentz factor, or it could depend on the radius at which the expanding shell becomes optically thin R*. In this latter scenario, we could observe variability only on time-scales longer than a characteristic time t* = R*/cΓ2 (BSS00).
A number of theoretical interpretations of the power-law PDS with an index compatible with 5/3 have been put forward in the literature. This is what is expected for a Kolmogorov spectrum within a medium with fully developed turbulence. For instance, in the internal shock model, the parameters of the wind of relativistic shells can be constrained so as to reproduce the observed average PDS (Panaitescu, Spada & Mészáros 1999; Spada, Panaitescu & Mészáros 2000); or in the context of a relativistic jet making its way out through the stellar envelope of the progenitor star (Zhang, MacFadyen & Wang 2009; Morsony, Lazzati & Begelman 2010). Within other scenarios, in which the dissipation into gamma-rays is magnetically driven, the observed features of the average PDS in the frequency range from a few 0.01 to 1–2 Hz can also be explained (e.g. Zhang & Yan 2011). Again, alternatively the observed temporal properties could be driven by instabilities in the accretion disc of potentially different origins: erratic episodic accretion (e.g. Kumar, Narayan & Johnson 2008); hydrodynamical or magnetic origin (e.g. Perna, Armitage & Zhang 2006; Proga & Zhang 2006; Margutti et al. 2011); magneto-rotational origin, in which neutrino cooling is the dominant process (Carballido & Lee 2011). The reader is referred to G12 for a more detailed discussion of the predictions of the various theoretical models with reference to the average PDS properties.
5 CONCLUSIONS
We studied the properties of the average PDS of GRBs in two unexplored regimes: across a broad-band energy range from 8 keV to 1 MeV using Fermi/GBM data and up to very high frequencies (up to 1 kHz) using BeppoSAX/GRBM data.
In agreement with previous results obtained from an analogous analysis of CGRO/BATSE and of Swift/BAT data, we also found a clear relation between the average PDS slope from ∼0.01 to ∼1 Hz range and energy, with the index spanning the range from 1.5 to 1.9 from 8 keV through 1 MeV in three channels (8–40, 40–200 and 200–1000 keV). The slope of the average PDS carries information about the spikiness of light curve as well as the multiple presence of several characteristic time-scales (scale invariance within the two decades of the aforementioned frequency range).
For the first time we extended the study of PDS up to 1 kHz in frequency with the very high time resolution provided by BeppoSAX/GRBM. In this case, the average PDS pinned down a clear break at 1–2 Hz. This provides a strong clue to the dominant minimum variability time, potentially connected with either the intrinsic inner engine variability, or with the dispersion of the bulk Lorentz factor distribution for a wind of relativistic shells, or with the average distance at which internal collisions dissipate energy into gamma-rays. Combining our results with those obtained from the Swift data set, the presence of this break emerges only in the harder energy channels ( ≳ 100 keV).
The average slope is broadly consistent with the theoretically appealing value of 5/3 expected for a Kolmogorov spectrum of velocities within a fully turbulent medium, as suggested in previous works (BSS98, BSS00). Our results in the frequency range ∼10−2–∼1 Hz are in broad agreement with a number of theoretical interpretations within different alternative contexts, encompassing the classical internal shock scenario as well as the magnetically dominated outflows models. Instead, still missing is a detailed theoretical explanation for the other two properties: (i) the presence of the 1–2 Hz break and its energy dependence; (ii) the energy dependence of the average power-law index.
This work was supported by PRIN MIUR project on ‘Gamma Ray Bursts: from progenitors to physics of the prompt emission process’, P. I. F. Frontera (Prot. 2009 ERC3HT). We acknowledge useful comments by the anonymous referee which helped to improve the paper.
REFERENCES
SUPPORTING INFORMATION
Additional Supporting Information may be found in the online version of this article:
Table 1. Time and Peak count rate. Fermi/GBM full sample including 205 GRBs. The PDS is calculated in the time interval reported.
Table 2. White noise level (Leahy normalization) for the full Fermi sample. The mean value of this sample is 1.99 ± 0.02. Uncertainties at 1σ.
Please note: Oxford University Press are not responsible for the content or functionality of any supporting materials supplied by the authors. Any queries (other than missing material) should be directed to the corresponding author for the article.
