


Abstract
Taking advantage of the high temporal and spatial resolution observations of the Solar Dynamics Observatory, we present an extreme ultraviolet (EUV) wave associated with a micro-sigmoid eruption, which took place on 2012 October 4. The micro-sigmoid underwent a typical sigmoid-to-arcade evolution via tether-cutting reconnection, accompanied by a micro-flare, a filament eruption. The twin coronal dimmings at the footpoints of the sigmoid indicate the existence of the associated micro-coronal mass ejection that likely triggered a small-scale EUV wave. The wave onset was nearly simultaneous with the start of the eruption and the associated flare. The wave had a nearly circular front, and propagated at initial velocities of 300–360 km s−1. Because the sigmoid was located in the non-quiet region, the generated wave interacted with the ambient loops, and triggered transverse loop oscillations, resulting in many loop-shaped dimmings. Moreover, the interaction between the wave and one large loop led not only to the oscillation but also to the downward plasma flow along the loop, inducing loop footpoints to brighten. Another small loop was nearly intact after the wave passed. In some directions, the wave was refracted by the loops, and the refracted speeds increased, decreased, or vanished in different directions. All results provide evidence that the EUV wave was a fast-mode magnetohydrodynamic wave.
1 INTRODUCTION
One of the most important and intriguing discoveries of the EUV Imaging Telescope (EIT) on board the Solar and Heliospheric Observatory spacecraft is the EIT or extreme ultraviolet (EUV) wave (Moses et al. 1997; Thompson et al. 1998, 1999). This is an active research topic in solar physics. EUV waves generally appear as large-scale, diffuse, single-pulse coronal-enhanced transients. They normally emanate from flaring and eruptive active regions (ARs), and subsequently propagate over significant fractions of the solar disc, mostly over quiet-Sun areas. Their speeds can reach several hundred km s−1 (Thompson & Myers 2009). EUV waves tend to avoid ARs and the separatrix betweens ARs. They reflect or refract at the boundaries of coronal holes or near coronal loops (Thompson et al. 1998, 1999; Wills-Davey & Thompson 1999; Wu et al. 2001; Li et al. 2012). More and more evidence has accumulated, demonstrating that EUV waves are intimately associated with coronal mass ejections (CMEs; or other types of mass motions) rather than flares (Biesecker et al. 2002; Cliver et al. 2005; Chen 2006; Zheng et al. 2012).
Although EUV waves have been studied for about 15 years, there is still much debate surrounding their physical nature. Several competing models have been suggested to explain the nature: coronal fast-mode magnetohydrodynamic (MHD) waves (e.g. Thompson et al. 1999; Wang 2000; Wu et al. 2001; Ofman & Thompson 2002; Long et al. 2008; Gopalswamy et al. 2009; Veronig, Temmer & Vršnak 2008; Veronig et al. 2010); slow-mode MHD waves (Wang, Shen & Lin 2009) or slow-mode solitons (Wills-Davey, DeForest & Stenflo 2007); pseudo-waves related to a current shell or successive restructuring of the magnetic field associated with the CME expansion (Attrill et al. 2007; Delannée et al. 2008); hybrid models including both wave and pseudo-wave scenarios (Chen et al. 2002; Zhukov & Auchère 2004; Cohen et al. 2009; Downs et al. 2011; Cheng et al. 2012). For details of observations and models, please refer to recent reviews (Wills-Davey & Attrill 2009; Gallagher & Long 2011; Warmuth 2010; Zhukov 2011; Patsourakos & Vourlidas 2012).
Transverse coronal loop oscillations were first spatially resolved in 1998 (Aschwanden et al. 1999; Nakariakov et al. 1999). In this paper, the transverse coronal loop oscillation is referred to as an oscillation, for short. Coronal loop oscillations have been extensively studied using both observations and theories, and there have been several reviews (Aschwanden 2009; Ruderman & Erdélyi 2009; Terradas 2009; Petrosyan et al. 2010; De Moortel & Nakariakov 2012). The oscillations are often observed with a rapid decay within several periods (Nakariakov et al. 1999; Aschwanden et al. 2002; White & Verwichte 2012), but undamped oscillations are also sometimes observed (Aschwanden et al. 2002; Aschwanden & Schrijver 2011). In addition, the oscillations are observed not only in single loops but also in a bundle of loops (Verwichte et al. 2004, 2009; Aschwanden & Schrijver 2011). Such loop oscillations can be caused by the interactions of the coronal loops with various eruptions, including filament eruptions, flares, CMEs and EUV waves.
In this paper, with the high-cadence and sensitivity observations from the Atmospheric Imaging Assembly (AIA; Lemen et al. 2012) on the Solar Dynamics Observatory (SDO; Pesnell, Thompson & Chamberlin 2012), we concentrate on an EUV wave that interacted with the coronal loops on 2012 October 4.
2 OBSERVATIONS AND DATA ANALYSIS
On 2012 October 4, a micro-sigmoid erupted from a small AR close to the solar disc centre. Following the eruption, there occurred a small EUV wave and some ambient loops began to oscillate. There was no visible filament in the Hα filtergrams and no detectable CME in the coronagraphs. The eruption centre has been identified at the location of x = 260 arcsec, y = 0 arcsec, measured from the solar disc centre. Because of the viewpoint, there was no reaction to the eruption on the twin spacecrafts of the Solar-Terrestrial Relations Observatory (STEREO; Kaiser et al. 2008). We mainly use the observations from the AIA on the SDO. The AIA has 10 EUV and UV wavelengths, covering a wide range of temperatures. The cadence is up to 12 s, and the pixel resolution is 0.6 arcsec. The wave and loop oscillations are best seen in 193 and 171 Å, respectively. In order to analyse the dynamics of the waves, we employ a time-slice approach, in which the slices start from the identified eruption centre. In addition, magnetograms from the Helioseismic and Magnetic Imager (HMI) are chosen to check the magnetic field evolution of the eruption region. All the images are differentially rotated to a reference time (∼06:16:00 ut).
3 RESULTS
3.1 Micro-sigmoid eruption
The sigmoid eruption is shown in the AIA 335-Å images in Fig. 1. The sigmoid only had a length of 40 arcsec, which is approximately one-fifth of the size of the large-scale sigmoid studied by McKenzie & Canfield (2008). Thus, it can be regarded as a micro-sigmoid (Raouafi et al. 2010), and it was even shorter than the micro-sigmoid studied by Zheng et al. (2012). In Fig. 1(a), following the nomenclature of the sigmoid model of Moore et al. (2001), the two oppositely curved magnetic elbows are marked as A and C, and there is a small sigmoidal filament under the elbows (the thin black arrow). The curved elbows are sketched by black curved lines in Fig. 1(b). The sigmoid is located in a small AR, and the contours of the HMI magnetic field have been superposed on the figure. It is evident that the sigmoid elbows were highly sheared and nearly lay along the polarity inversion line (PIL). Their four footpoints were rooted at the two opposite polarities of the bipolar AR (Fig. 1b). About 1 min before the eruption, it was clear that the low-lying sheared compact loops (E) were under the middle of the sigmoid (Fig. 1c), according to the sigmoid model of Moore et al. (2001). The low-lying sheared compact loops were produced by continuous magnetic flux cancelation near the eruption centre, resulting in the reconnection between two elbows, similar to the tether-cutting reconnection in the Moore model (Moore et al. 2001; Liu et al. 2010). At about 06:16 ut, the sigmoid began to erupt, accompanied by a micro-flare (Fig. 1d) that peaked at about 06:17:46 ut. Because of the strong intensity, the evolution in the core field was covered by the brightness. After the eruption, there appeared a post-eruption arcade, straddling the middle of the PIL (the white arrow in Fig. 1e). This is compatible with the typical sigmoid-to-arcade evolution. The arcade was not like the cusp structure in the soft X-ray (Sterling et al. 2000; Moore et al. 2001). Of course, there were the distinct twin dimmings around the arcade (white arrows in Fig. 1f), another product of a typical sigmoid eruption, rooted at opposite magnetic polarities. Note that there was a small loop (L1) south of the sigmoid (thick black arrows in Figs 1a–c). This faded during the eruption and brightly reappeared after the eruption (black arrows in Figs 1d–f), which indicates that L1 was nearly intact during the eruption.
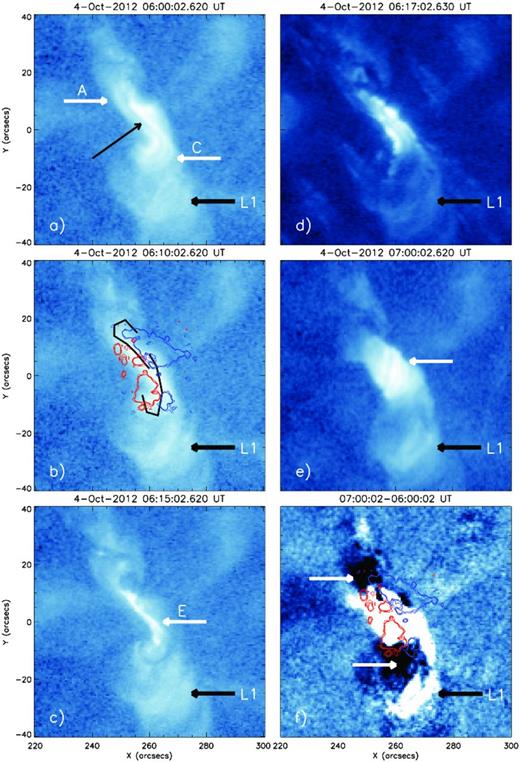
Sigmoid eruption in the AIA 335-Å images. Contours of HMI longitudinal magnetic fields at 06:10:17 ut are superposed on to panels (b) and (f) with positive (negative) fields in red (blue). The levels are 20, 30 and 40 G, respectively. The curved black lines in panel (b) sketch the profiles of the sigmoid elbows. Symbols and arrows are described in the text.
The eruption is shown in detail by the images of AIA 171, 304 and 193 Å in Fig. 2. Figs 2d–f are the base difference images, and the others are the original images. The first image at 06:00 ut is taken as the base image in each wavelength. Before the eruption, the small filament was also clearly seen lying in the PIL (white arrows in Figs 2a–c), although there was no visible filament in the Hα filtergrams. Note that L1 in 193 Å (the box in Fig. 2c) was as obvious as that in 335 Å, and only its footpoints were bright in 171 and 304 Å (Figs 2a and b). This suggests that L1 was the hot loop. L1 also survived in 193 Å during the eruption, and the small dimmings under L1 were the result of the disturbance from the eruption (the thin white arrow in Fig. 2d). After the eruption, the post-eruption arcade over the eruption centre, and the twin deep dimmings were more obvious around the arcade (thick white arrows in Fig. 2d). In addition, there were large dimmings on both sides of the eruption regions (black arrows in Fig. 2d), which should not be the product of a typical sigmoid eruption. To make the large dimmings clear, we examine the eruption in a large field of view (FOV) in 193 and 171 Å (bottom panels). The full view of the large dimmings is shown in Fig. 2(e). It is clear that the formation of the large dimmings was closely associated with the loops (L2) north of the sigmoid, more evident in 171 Å (Fig. 2f), and these were likely rooted in the footpoints of L2. Moreover, more loop-shaped dimmings were found in 171 Å (white arrows in Fig. 2f). Figs 2(g) and (h) exhibit the general environment before the eruption. The loop-shaped dimmings were closely associated with the large loop south of the sigmoid (L3) and with the loop far west of the sigmoid (L4). L3 and L4 did not disrupt but were disturbed during the eruption, which resulted in the loop-shaped dimmings. The micro-sigmoid was located in the non-quiet region (the solid box), and it was encompassed by many loops. Note that there was also one small loop (L5), which we discuss in Section 3.2.
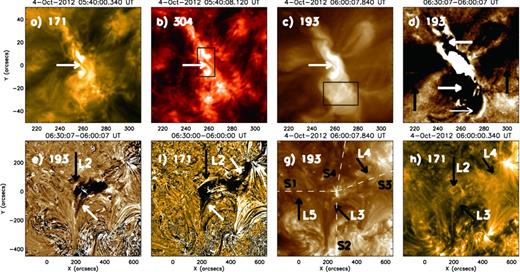
Associated features for the sigmoid eruption in the AIA 171-, 193- and 304-Å images. Panels (d)–(f) are base difference images, subtracted by the first images at 06:00 ut, and the others are original images. Symbols and arrows are described in the text.
3.2 Extreme ultraviolet wave
The sigmoid eruption was closely associated with an EUV wave, which is shown in AIA 193 Å in Fig. 3 (see the movie, dif_aia_193.mpg, which can be found in the online Supporting Information for this paper). To show the wave better, we have chosen the running difference images, subtracting the image 2 min previously in each wavelength, to enhance the wave front (upper panels). The wave was weak, and the propagation distance was less than 300 Mm. However, the wave had a nearly circular front (Figs 3a and b). As time went on, the propagating front became asymmetrical. The north-eastern front became brighter and brighter, but the southern front vanished (Figs 3c and d). The tracks of L3 (arrows in Figs 3c and d) can possibly be used to interpret the disappearance of the fronts in those directions. To best display the kinematics of the EUV wave, we have employed the time-slice approach, and we analyse the evolution of the wave front along the selected slices (S1–S4), which originated from the eruption centre (x = 260 arcsec, y = 0 arcsec). The angles of S1–S4 are 90°, 180°, 290° and 350°, respectively, counterclockwise from the north (black dashed lines in Fig. 2g).
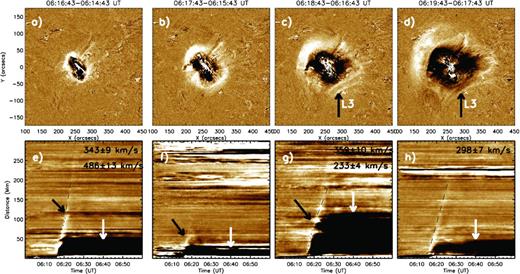
Running difference images (upper panels) in AIA 193 Å displaying the evolution of the wave, and base difference time-slice images (bottom panels) along the slices S1–S4 (dotted lines in Fig. 2g). Symbols and arrows are described in the text.
The bottom panels of Fig. 3 display the propagation of the wave in S1–S4. The wave set off at about 06:16 ut, almost simultaneous with the onsets of the sigmoid eruption and the associated flare. The wave front appeared as bright oblique stripes, denoted by the black lines. The following speeds and associated errors were derived by linear fits, assuming that the measurement uncertainty of the selected points is 4 pixels (∼1.74 Mm). Note that all the following measured speeds are the projected speeds. Intriguingly, parts of the wave propagating in different directions had different properties. In S1, the wave had an initial speed of about 343 ± 9 km s−1, but its speed suddenly increased to 486 ± 13 km s−1 at about 120 Mm away from the eruption centre (the black arrow), corresponding to a small loop (L5, indicated in Fig. 2g). In S2, the wave was short-lived and suddenly vanished at a distance of about 60 Mm (i.e. the location of L3; the black arrow). In S3, the wave had an initial speed of about 359 ± 10 km s−1, and also refracted at about 100 Mm away from the eruption centre (the black arrow), corresponding to L4. In contrast, the refracted speed decreased to 233 ± 4 km s−1. In S4, the wave nearly propagated at a constant velocity of 298 ± 7 km s−1 with little change in the velocity. There were large-area long-duration dimmings around the eruption centre (white arrows). Except for the dimmings close to the eruption centre, which resulted from the sigmoid eruption, the majority of the dimmings were a result of the disturbances of the ambient loops. The extent of the EUV wave was much larger than that of the long-duration dimmings. In addition, the wave fronts were brighter at the beginning, which might be related to their interactions with the ambient loops.
3.3 Loop oscillation
The ambient loops did not erupt but distinctly oscillated during the eruption, and all of them suffered oscillations when the wave passed. The interactions of the ambient loops with the wave (mainly including L2, L3 and L4) are shown by the running difference images of AIA 171 Å in Fig. 4. L2 was closest to the eruption centre, so it reacted nearly as soon as the wave onset. Only the eastern part of L2 was compressed to brighten (the black arrow in Fig. 4a). Then, 2 min later, the bright part of L2 westwards extended as an arcade, followed by large dimmings (the thick white arrow in Fig. 4b) as a result of the compressed displacement of L2. Moreover, there were also extending faint dimmings (the thin white arrow in Fig. 4b) ahead of the bright arcade, which likely represented the dark wave front in 171 Å (Liu et al. 2010). At about 06:23 ut, the loop-shaped dimmings (thin white arrows in Fig. 4c) sketched out the outline of L2, and there were deep dimmings around the roots of L2 (thick white arrows in Fig. 4c). Meanwhile, there appeared another loop-shaped dimming (the thin black arrow in Fig. 4c) because of the oscillation of L3. After more than 4 min, it became evident that there were also loop-shaped dimmings (the black arrow in Fig. 4d) north-west of the eruption region, as a result of the oscillation of L4. As time went on, the loop-shaped dimmings became weaker and weaker. However, as the largest loop around the eruption centre, L3 continued to oscillate, and there appeared a bright plasma flow along L3 towards its footpoints (the black arrow in Fig. 4e). The left end of L3 began to brighten first, and the right end brightened later (white arrows in Figs 4e and f). The brightened footpoints probably reflected the density increase of the plasma in the observational narrow band. The right end of L3 was brighter than the left end, which is likely to be the result of its additional interaction with the loops west of L3.
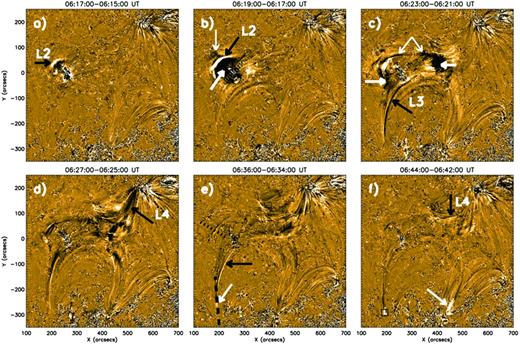
Running difference images in AIA 171 Å displaying the loop oscillations. Symbols and arrows are described in the text.
The oscillations of the loops are very obvious in the movies (see the movie, dif_aia_171.mpg, which can be found in the online Supporting Information for this paper), but are difficult to show in the images. Only the oscillation of L2 is shown by the time-slice image in the upper panel of Fig. 5. The image is made by the AIA 171-Å original images along the dotted cut in Fig. 4(e). At about 06:17 ut, it was clear that L2 was pushed to expand. Behind L2, there appeared extending dimmings, followed by the expansion of the loop. At a distance of about 45 Mm, L2 began to bounce, so the oscillation emerged. However, the oscillation quickly damped and only lasted for nearly one period (dotted black line). The period was about 6 min. Note that there was a dark oblique stripe ahead of L2, which was indicative of the EUV wave, similar to the situation in Fig. 4(b). The speed was about 322 ± 9 km s−1, in the range of speeds calculated in Fig. 3. In Fig. 5(b), the time-slice image shows the plasma flow in L3, along the dashed cut in Fig. 4(e). The flow can very clearly be seen, and its speed was about 107 ± 3 km s−1. Moreover, it is evident that the end of L3 was directly brightened by the flow (the black arrow in Fig. 5b).
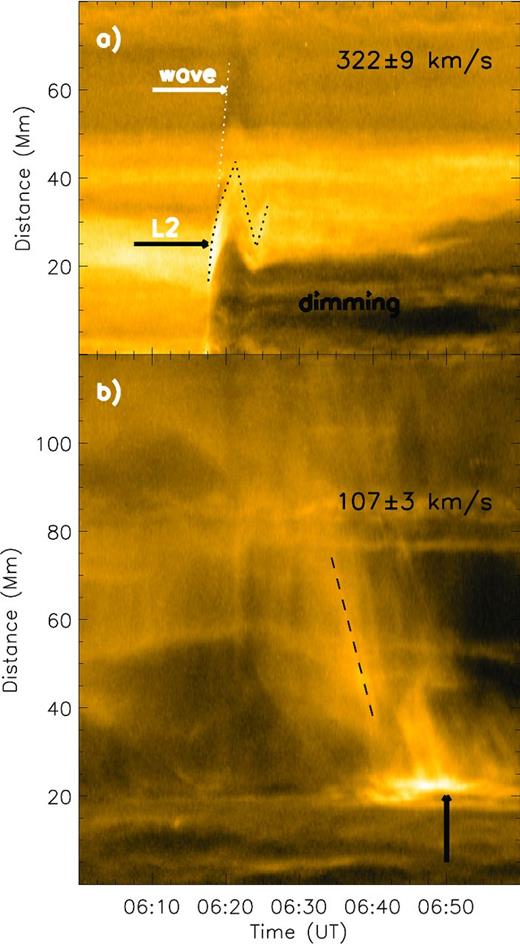
Time-slice original images in AIA 171 Å along the cuts in Fig. 4, showing the loop oscillation of L2 (a) and the plasma flow in L3 (b). Symbols and arrows are described in the text.
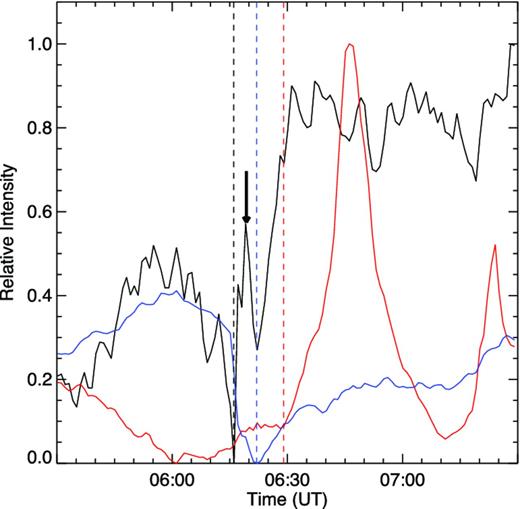
Fig. 6 presents the light curves in AIA 304 Å (black), 193 Å (blue) and 171 Å (red) for summed intensities in the regions marked by the boxes in Figs 2 and 4. These represent the intensity changes for the flare core, L1, and the left end of L3, respectively. In 304 Å, it is clear that the flare started at about 06:16 ut (black dashed line), almost simultaneous with the wave onset. The peak indicated by the black arrow was just the flare peak. In 193 Å, the intensity of L1 abruptly decreased at about the beginning of the wave. Then, it began to increase again after the intensity fell to the bottom, at about 06:22 ut (blue dashed line), and it recovered to the level before the eruption. The ephemeral intensity change again confirms that L1 was intact during the eruption. In 171 Å, it is evident that the left end of L3 began to brighten at about 06:29 ut (red dashed line), about fifteen minutes later than the wave occurrence, and it peaked at about 06:47 ut.
4 DISCUSSION AND CONCLUSIONS
Using observations from the AIA of the SDO, we present an EUV wave associated with a micro-sigmoid eruption on 2012 October 4. Our main findings are as follows.
The micro-sigmoid underwent a typical sigmoid-to-arcade evolution via a tether-cutting reconnection, accompanied by a micro-flare, a filament eruption and twin coronal dimmings.
The micro-sigmoid eruption was closely associated with a small-scale EUV wave. The wave onset was nearly simultaneous with the onsets of the sigmoid eruption and the flare.
The wave had a nearly circular front, and propagated at initial velocities of 300–360 km s−1, which is in the range of the average surface-projected expansion speeds for fast-mode waves (Wang 2000).
The micro-sigmoid was encompassed by many loops rather than located at the quiet region. The generated wave interacted with the ambient loops, and triggered the transverse loop oscillations, resulting in many loop-shaped dimmings. The extent of the EUV wave was much larger than that of the deep long-duration dimmings.
As a result of the interaction with the wave, there appeared plasma flows along one large loop, towards loop footpoints that brightened later. In addition, on the passage of the wave, another small loop again brightened after it was fading. It is a problem for pseudo-wave models that the small loop survived after the wave passed.
In some directions, the wave was refracted by the loops, and the refracted speeds increased, decreased, or vanished in different directions. All these results provide evidence that the EUV wave was a fast-mode MHD wave.
Micro-sigmoids are very unusual, especially the micro-sigmoid that triggers an EUV wave (Zheng et al. 2012), and they have only been studied in a few events (Mandrini et al. 2005; Ma et al. 2009; Raouafi et al. 2010). We have not found any CME associated with the sigmoid eruption in any coronagraph, but a sigmoid is, in general, an important precursor of a CME (Canfield, Hudson & Pevtsov 2000). However, the observable eruptive filament and the twin coronal dimmings produced by the sigmoid eruption are an important signature of CMEs. The eruption of the micro-sigmoid likely gave rise to a micro-CME (Raouafi et al. 2010) that is very difficult to see. As for the physical origin of the wave, it is widely accepted that EUV waves are intimately associated with CMEs rather than flares (Biesecker et al. 2002; Cliver et al. 2005; Chen 2006). We suggest that the wave was likely driven by the micro-CME.
Many loop oscillations have their origins in the interaction of coronal loops with various external sources and drivers (Erdélyi & Hargreaves 2008; Hindman & Jain 2008). One possible explanation for loop oscillations is that they are triggered by the interaction of these loops with global EUV waves. Wills-Davey & Thompson (1999) were the first to observe an EUV wave interacting with coronal loops. Ballai, Douglas & Marcu (2008) have investigated the temporal and spatial variations of transversal oscillations in a coronal loop under the effect of, and with external driver modelling of, the global EUV wave. In this present paper, we have seen that oscillations appeared in most of the coronal loops around the eruption region. The wave is most likely the driver of loop oscillations. Regarding the interpretation of the excitation of the transverse oscillation, it seems that the mechanism links the oscillations with the periodic shedding of Alfvénic vortices (Nakariakov, Aschwanden & Van Doorsselaere 2009). The period and the rapid damping of the loop oscillations are also consistent with previous observations and models. In addition, the dispersive evolution of the fast magnetoacoustic pulse is caused either by its interaction with random structuring of the corona (Murawski, Nakariakov & Pelinovsky 2001) or by its regular stratification (Uralov 2003).
Note that the plasma flow in L3 after the oscillation resulted in the brightenings in the footpoints of L3. In the narrow-band images, the increase in the brightness corresponds not to the increase in the temperature, but to the increase in the density of the plasma. Some authors (e.g. Terradas & Ofman 2004) have considered the density increase of the plasma associated with transverse oscillations. This suggests that the wave is capable of triggering a localized energy release when it crosses the pre-existing coronal structures. It is also consistent with the results of theoretical modelling of the interaction of fast waves with magnetic null-points (McLaughlin & Hood 2004; Nakariakov et al. 2006). Ofman & Thompson (2002) and Terradas & Ofman (2004) have simulated the brightenings at the footpoints of loops, because the energy release causes localized heating and a stationary emission enhancement. Moreover, the brightenings of the left end of L3 occurred with a delay of about 15 min with respect to the onset of the wave. If the wave could directly induce the brightenings in the footpoints of L3, only a few minutes were needed. Hence, it is likely that the wave triggered the oscillation of L3 and induced the downward plasma flow in L3, which finally led to the brightenings in the footpoints of L3. Perhaps this can offer some clues to how EUV waves heat the corona. As to whether the plasma in L3 is some kind of wave, it will be discussed in future.
However, it is still unknown what eruption condition for the micro-sigmoid can trigger an EUV wave, when there has been no EUV wave in some large sigmoid eruptions. In addition, we need to think about what special loop can refract the wave, but not other loops, and why different refractions result from different loops. These issues make the wave nature uncertain and leave other possibilities open. More studies of this type of wave will be helpful for our understanding of their nature and their interactions with ambient coronal structures. The nature and origin of EUV waves remain subtle; further observations and theoretical work are essential.
The authors are grateful to an anonymous referee for constructive suggestions and comments. The authors thank the SDO team for providing the excellent data. This work is supported by the Natural Science Foundation of China, under grants 10973038, 11173058 and 11273056, and by the Chinese Academy of Sciences (CAS) grant KJCX2-EW-T07.
REFERENCES
SUPPORTING INFORMATION
Additional Supporting Information may be found in the online version of this article:
Movie 1. dif_aia_193.mpg
Movie 2. dif_aia_171.mpg (Supplementary Data).
Please note: Oxford University Press are not responsible for the content or functionality of any supporting materials supplied by the authors. Any queries (other than missing material) should be directed to the corresponding author for the article.
