


Abstract
Here, we report an enhanced throughput method for the diagnosis of human exposure to sulfur mustard. A hydroxyethylthioethyl (HETE) ester-adducted tripeptide, produced by pronase digestion of human serum albumin, was selected as the quantitative exposure biomarker. Cibacron Blue enrichment was developed from an established cartridge method into a 96-well plate format, increasing throughput and ruggedness. This new method decreased sample volume 2.5-fold. Addition of a precipitation and solid-phase extraction concentration step increased the sensitivity of the method. With the conversion to a 96-well plate and optimization of chromatography, the method resulted in a 3-fold decrease in analysis time. Inclusion of a confirmation ion has increased specificity. The method was found to be linear between 0.050 and 50 µM sulfur mustard exposure with a precision for both quality control samples of ≤6.5% relative standard deviation and an accuracy of >96%. The limit of detection (3So) was calculated to be ∼0.0048 µM, an exposure value similar to that of the HETE–albumin adduct method first described by Noort and co-workers (Noort et al., 1999; Noort el al., 2004) which used protein precipitation to isolate albumin. A convenience set of 124 plasma samples from healthy unexposed individuals was analyzed using this method to assess background levels of exposure to sulfur mustard; no positive results were detected.
Introduction
Sulfur mustard (2,2′-dichloroethyl sulfide) is a potent and persistent vesicant that produces painful blisters, or vesicles, upon exposure. Sulfur mustard can penetrate clothing forming blisters on protected areas of the skin as well as on exposed areas (1). Eye and lung tissue are even more sensitive than skin to exposure; sulfur mustard can cause temporary blindness as well as injury to the respiratory tract. In addition, sulfur mustard is highly mutagenic and carcinogenic, readily alkylating and crosslinking guanine residues within DNA (2), which may result in possible long-term health effects. Sulfur mustard was first used as a military weapon during World War I (WWI) and is attributed to over 80% of the chemical casualties reported (3).
Since WWI, there have been several suspected and confirmed uses of sulfur mustard. The most well-documented use took place during the Iran–Iraq conflict in the 1980s (4–7) in which Iraq used sulfur mustard on Iranian soldiers. Iraq also used sulfur mustard against its own Kurdish population (8). In 1993, the Chemical Weapons Convention (CWC) was signed; the treaty prohibits the production and stockpiling of chemical weapons and provides a timeline for destruction of stockpiled chemical weapons. Sulfur mustard is listed as a vesicant on Schedule 1 of the CWC and is defined as having limited or no use outside of chemical warfare. Despite efforts by the Organization for the Prohibition of Chemical Weapons (OPCW), which oversees enforcement of the CWC, sulfur mustard stockpiles still exist around the world and pose a public health risk.
The use of the nerve agent sarin in Matsumoto in June 1994 and in the Tokyo subway in March 1995 by members of the doomsday cult Aum Shinrikyo highlighted the possibility of chemical weapons being used in an act of terrorism (9). In response to these possible public health risks, the Laboratory Response Network (LRN) was established in 1999 within the USA. This laboratory network includes representative state and local health department laboratories across the nation in addition to the Centers for Disease Control and Prevention and can assess exposure to a wide range of chemical (LRN-C) and biological (LRN-B) agents. The LRN-C has responded to several small-scale incidents involving sulfur mustard since its establishment including clam fisherman exposed after dredging up a discarded munition off the northeastern US coast (10) and American military personnel exposed during demilitarization of munitions (11).
Diagnosing human exposure to any chemical is typically assessed by measuring its concentration in blood, its metabolite(s) in urine or its covalent modification(s) to proteins or DNA (12). Sulfur mustard can be measured in blood by gas chromatography (GC), but is limited to measurement within a few hours of exposure (13, 14). Sulfur mustard is rapidly hydrolyzed in aqueous environments, losing a chlorine atom and forming a very reactive episulfonium ion intermediate which can be quickly metabolized. Black and colleagues (15) were able to detect β-lyase metabolites in human casualties up to 13 days following a vesicant exposure. The most sensitive measurement of sulfur mustard metabolites is based on tandem mass spectrometry (MS-MS), either coupled with GC (16–18) or liquid chromatography (LC) (19). Analysis of metabolites by GC–MS-MS has been used to verify sulfur mustard exposure (20, 21).
The episulfonium intermediate also reacts with a wide range of biological nucleophiles. Reactions of the episulfonium intermediate with carboxyl groups form hydroxyethylthioethyl (HETE) esters, while reactions with –SH groups form thio-ethers (Figure 1) (22, 23). The alkylating property of sulfur mustard extends the time possible for retrospective determination of exposure; the exact time frame for analysis is reflective of the natural turnover of the alkylated macromolecule in the body. Several methods have been developed based on DNA adducts including an immunochemical method that detects adducts to N7-guanine from blood cells (24). Methods for measuring sulfur mustard adducts to proteins have also been developed including the following: immunochemical detection of sulfur mustard adducts to keratin (25); GC–MS and LC–MS-MS determination of adducts to the N-terminal valine and histidine residues of hemoglobin (26, 27); LC–MS-MS determination of adduction to cysteine-34 (Cys-34) of serum albumin (28, 29); LC-multiple reaction monitoring validation of sulfur mustard and nitrogen mustard adducts to the Cys-34 residue of serum albumin (30) and GC–MS detection of adducts to blood proteins (31–33). These adduct methods have been successfully applied for retrospective determination of sulfur mustard exposure. The keratin adduct method and the GC–MS hemoglobin adduct method were both used to verify sulfur mustard exposure of two Iranian victims using samples taken over 3 weeks post-exposure; (34) the albumin adduct method was used to verify sulfur mustard exposure of several Iranian victims of the Iran–Iraq conflict from samples collected 8–9 days post-exposure (28) and the albumin adduct and blood adduct methods were used to verify sulfur mustard exposure after an accidental exposure using samples taken over 40 days post-exposure (11, 35).
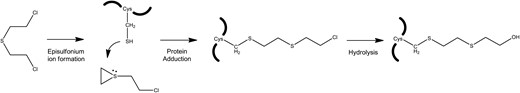
Adduction of sulfur mustard in mammals. Reactions of the episulfonium intermediate with carboxyl groups of biological molecules, including proteins, form HETE esters.
Today, sulfur mustard stockpiles still exist without a known antidote for exposure. Given the instability of regions around the world in possession of known chemical weapon stockpiles, and the likelihood of delayed sample collection, a method with the widest window for analysis post-exposure is critical. Clearly, the adduct methods provide a powerful tool for long-term assessment of sulfur mustard exposure. One of the limitations to some of the protein adduct methods previously published is the laborious protein purification process. The original albumin adduct method was based on serial protein precipitation (28). This method was further improved by addition of Cibacron Blue cartridge enrichment of albumin, (29) although the purification scale used still required serial processing of samples. Despite improving the sample processing procedure, converting the method to Cibacron Blue purification resulted in an overall decrease in sensitivity. Here, we report an enhanced throughput method for detecting sulfur mustard adducts to albumin, which utilizes Cibacron Blue enrichment in a 96-well plate format. The reported method has increased reproducibility, throughput and specificity with increased sensitivity to the previously reported albumin adduct method (29).
Materials and methods
Chemicals and materials
Monobasic sodium phosphate, dibasic sodium phosphate, potassium chloride, 6.1 M trichloroacetic acid (TCA) solution (from MP Biomedicals), Optima acetone, ammonium bicarbonate, high-performance liquid chromatography (HPLC)-grade water, HPLC-grade acetonitrile (ACN) and LC–MS-grade formic acid were purchased from Fisher Scientific (Hanover Park, IL, USA). Pronase Type XIV from Streptomyces griseus was purchased from Sigma-Aldrich Chemical Co. (Lot 45F-0545; St. Louis, MO, USA). Pall Acroprep® 96-well 0.45 µm filter plates, Pierce® Blue Albumin Removal kits, Nunc® fritted 96-well plates, Millipore MultiScreen® Ultracel-10 filter plates, Eppendorf 96-well PCR plates and 1- and 2-mL 96-well receiving plates were purchased from Fisher Scientific. Strata® C18-E 96-well plates (100 mg/well, 55 µm, 70 Å) and Kinetex® XB-C18 (100 × 2.1 mm, 2.6 µm, 100 Å) columns were purchased from Phenomenex (Torrance, CA, USA). Sulfur mustard-spiked plasma samples and HETE-adducted cysteine-proline-phenylalanine peptide (CPF) peptides were generated at The Netherlands Organization for Applied Scientific Research (TNO; Rijswijk, The Netherlands) (28). Plasma samples for dilution of calibrators and quality control (QC) samples were purchased from Tennessee Blood Services (Memphis, TN, USA). Additionally, a convenience set of 124 plasma specimens from healthy individuals with no known exposure to sulfur mustard was also purchased from Tennessee Blood Services for assessing method background.
Enrichment of albumin
After thawing, plasma samples were centrifuged in microcentrifuge tubes at 10,000 × g for 5 min at 20°C to remove particulates. Two hundred microliters of plasma were spiked with a 20 µL internal calibrator (10 µM D8 sulfur mustard-spiked plasma from TNO) and diluted with 800 µL of 50 mM sodium phosphate buffer (NaHPO4), pH 7.0. Seven hundred and fifty microliters of the diluted plasma were filtered through a Pall AcroPrep® 0.45 µm 96-well plate at 2,250 × g for 5 min at 20°C for further clarification.
For human serum albumin (HSA) enrichment, two Pierce Blue Albumin SwellGel® discs were used for each plasma sample. Discs were rehydrated in fritted 96-well plates with 760 µL of water and centrifuged at 2,250 × g for 2 min at 20°C. Five hundred microliters of the filtered sample was loaded onto the swell gel layer, vortexed briefly and centrifuged as above. The flow-through was reloaded, vortexed and centrifuged as above. Captured proteins were washed with 500 µL of 50 mM NaHPO4 (pH 7.0) with vortexing and centrifugation as above. Bound proteins were eluted with 600 µL of 50 mM NaHPO4/1.5 M KCl (pH 7.0) three times (1,800 µL total volume of enriched albumin) with vortexing and centrifugation as above.
Digestion of enriched HSA
For effective digestion, the enriched albumin protein was desalted by TCA/acetone precipitation. Sixteen hundred microliters of enriched albumin was precipitated in two separate wells of a 96-well plate (800 µL per well). Two hundred microliters of 6.1 N TCA was added to each 800 µL of eluted protein. The plate was stored at 4°C for 30 min and centrifuged at 3,000 × g for 5 min at 20°C. TCA was aspirated, and the pellet was washed twice with 400 µL of ice cold acetone with centrifugation as above. After aspirating the second wash, the pellet was allowed to air dry for 5 min at room temperature and solubilized in 300 µL of 50 mM ammonium bicarbonate at 37°C for 30 min with intermittent shaking for 10 s every minute. Digestion was initiated by adding 110 µL of 10 mg/mL pronase in 50 mM ammonium bicarbonate to each well, and protein was digested at 37°C for 90 min with intermittent shaking for 10 s every minute.
Concentration of digested peptides
To remove any remaining pronase, the digest was size fractionated using a 10-kDa molecular weight cut-off 96-well filter plate with centrifugation at 3,000 ×g for 90 min at 20°C. The eluent containing peptides was diluted with 500 µL of 50 mM ammonium bicarbonate and the split digest sample recombined. Peptides were then concentrated using a 96-well C18-E SPE plate (100 mg/well, 55 µm, 70 Å). The plate was conditioned with 2 mL of ACN followed by 2 mL of 0.2% formic acid by vacuum filtration. The entire sample was loaded onto the SPE plate and washed with 2 mL of 0.2% formic acid by vacuum filtration. Peptides were eluted with 1.8 mL of 40% ACN/0.2% formic acid two times into separate wells by vacuum filtration (3.6 mL total volume of extracted peptides in two wells). The eluent was blown to dryness using a TurboVap-96 (Biotage, Charlotte, NC, USA) at 50°C with nitrogen. The sample was reconstituted and recombined using 150 µL of 2% ACN/0.2% formic acid, transferred to an Eppendorf 96-well PCR plate and heat sealed.
Liquid chromatography–tandem mass spectrometry
Peptide samples were analyzed using an Agilent 1200 liquid chromatograph (Santa Clara, CA, USA) connected to an AB Sciex 4000 QTRAP® mass spectrometer (MS) (Framingham, MA, USA). Fifty microliters of the peptide extract were separated by reversed-phase chromatography using a Phenomenex Kinetex® XB-C18 (100 × 2.1 mm, 2.6 µm, 100 Å) column with a 100 µL sample loop. Mobile Phase A consisted of 0.2% formic acid in 2% ACN (aq). Mobile Phase B consisted of 0.2% formic acid in 80% ACN (aq). Separation was performed at 30°C at 200 µL/min. The elution program consisted of isocratic conditions at 80% mobile Phase A for 6 min, followed by a wash with 100% mobile Phase B for 1.5 min and re-equilibration back to 100% mobile Phase A for 8.5 min.
Eluted peptides were analyzed on the MS using a Turbo Ion Spray source in a positive ion mode. Data were acquired with Analyst 1.4.2 using Selected Reaction Monitoring (SRM), monitoring two transitions each for both the unlabeled and labeled peptides with a 200-ms dwell time. The fragment ions monitored represent the protonated adduct [HETE+H]+ for quantitation and the protonated adduct with the cysteine sulfur atom attached [HETE–S+H]+ for confirmation (Figures 2 and 3). Nitrogen was used as the collision gas, and transitions were optimized for collision energy (CE) and collision exit potential (CXP). Optimized parameters are listed in Table I. The source parameters were optimized by post-column infusion of 1 ppm H8–[HETE]–CPF peptide at 10 µL/min and mixing with 80% mobile Phase A running at 190 µL/min. The source capillary was optimized at 175°C, and ion spray voltage was optimized at 5,500 eV. Declustering potential and entrance potential were the same for both light and heavy adducted peptides and set to 65 and 12 eV, respectively.
Precursor-to-product ion optimization of H8- and D8-labeled [HETE]–CPF peptides by SRM
| Analyte | Ion | Precursor ion Q1 (m/z) | Product ion Q3 (m/z) | CE (eV) | CXP (eV) |
|---|---|---|---|---|---|
| H8–[HETE]–CPF | Quant | 470.2 | 105.1 | 35 | 5 |
| H8–[HETE]–CPF | Confirm | 470.2 | 137.1 | 30 | 7 |
| D8–[HETE]–CPF | ISTD | 478.2 | 113.1 | 35 | 5 |
| Analyte | Ion | Precursor ion Q1 (m/z) | Product ion Q3 (m/z) | CE (eV) | CXP (eV) |
|---|---|---|---|---|---|
| H8–[HETE]–CPF | Quant | 470.2 | 105.1 | 35 | 5 |
| H8–[HETE]–CPF | Confirm | 470.2 | 137.1 | 30 | 7 |
| D8–[HETE]–CPF | ISTD | 478.2 | 113.1 | 35 | 5 |
Both quadrupoles (Q1 and Q3) were set to unit resolution. CE and CXP were optimized for each transition.
Quant: quantitation ion; Confirm: confirmation ion; ISTD: internal standard.
![The chemical structure of the [HETE]–CPF biomarker. The fragmentation sites for the quantitation and confirmation ions are denoted by dashed lines (Cys = cysteine; Pro = proline; Phe = phenylalanine).](https://oup.silverchair-cdn.com/oup/backfile/Content_public/Journal/jat/38/1/10.1093/jat/bkt088/2/m_bkt08802.jpeg?Expires=1716416235&Signature=ASn7PFH2~WqI6ztaguvi4mIvRWRTqPdx9lWqNG-pplYK1SdqYDDaJUCKrCLnxbsP5CuP5PZVeORa3zkn7AqQ3HzpOhGL8ZqfvQaVvoDfwbyUF9JUTi7j3jBJGrfRPbiIv96uNvalna9dqvbLgnqbQpS-Et5Yhzl1JOPOedCq9EXp6To4tIB5wnS-JOKF73ouczaxmLTRu52KI78DUI4JuxeDLSREpXe-JA6LRV3ecHoRPhlMmy1S2m1Lt0H-l0qjpAcqNASq7qN0GZMqEdULFQWOA~xAqFgpHraiDHSNzmKlsckgaYp4aQ8rT4624c-R6Ke5HkkzXwhl5Z8DqtWXKA__&Key-Pair-Id=APKAIE5G5CRDK6RD3PGA)
The chemical structure of the [HETE]–CPF biomarker. The fragmentation sites for the quantitation and confirmation ions are denoted by dashed lines (Cys = cysteine; Pro = proline; Phe = phenylalanine).
![Product ion mass spectrum of protonated [HETE]–CPF. The two fragment ions monitored by SRM are indicated: the protonated adduct [HETE+H]+ was selected for quantitation and the protonated adduct with the cysteine sulfur atom attached [HETE–S+H]+ was selected for confirmation. The only other ions of note are the [M+H]+ precursor ion and the y2 ion containing Pro and Phe.](https://oup.silverchair-cdn.com/oup/backfile/Content_public/Journal/jat/38/1/10.1093/jat/bkt088/2/m_bkt08803.jpeg?Expires=1716416235&Signature=yL-jV5-EyEno6utPZR2Uia~lOzhzOy41M40t~h~3dqZEY8J4XZn4heeCmIsJKQn3EZdZECNncjleG~7C1qXzvdOhRvJQhABGnr~gLhN3vE70qVLf3IlP6qb8yoSF-WeixdMFCaqux-VYYeuag0tX0qjzSEoHGzI0osaZEbxcWdPHa~A8upD3xXOeHxbhKIaJpxyLgxP8JcM0jpnOboGMU9W508T5mNHPGmMt-1YhRGGJGetz1HwYZt1HFmccddWadxPrs0xLuVJP-bewSy2Fz1bqpyFutvRAqq94u23GPQpvLnW3~mJi6j~WQy0IrvZJi9MXbWBbZHVUvQTDwbrlrA__&Key-Pair-Id=APKAIE5G5CRDK6RD3PGA)
Product ion mass spectrum of protonated [HETE]–CPF. The two fragment ions monitored by SRM are indicated: the protonated adduct [HETE+H]+ was selected for quantitation and the protonated adduct with the cysteine sulfur atom attached [HETE–S+H]+ was selected for confirmation. The only other ions of note are the [M+H]+ precursor ion and the y2 ion containing Pro and Phe.
Calibration curve and QCs
High-concentration sulfur mustard-spiked plasma samples were generated by adding a stock solution of sulfur mustard solubilized in ACN to plasma, resulting in a final concentration of sulfur mustard in plasma at 0.1, 1, 10 and 100 µM. Calibrators and QC samples were generated by dilution of these high-concentration H8-sulfur mustard-spiked plasma materials (0.1, 1, 10 and 100 µM) with unexposed plasma. All calibrators and QC samples were then processed at the same time as the individual patient plasma samples used for determining background interference levels in healthy individuals. The final calibration curve ranged three orders of magnitude from 0.05 to 50 µM (0.05, 0.08, 0.1, 0.5, 1, 5, 10 and 50 µM). The QC-low and QC-high samples were prepared to 0.25 and 6.25 µM, respectively. A QC blank sample was prepared using 200 µL of unexposed plasma spiked with the same amount of ACN used in generating the sulfur mustard-spiked plasma materials. It is important to clarify that the values quantified in this method represent the concentration of sulfur mustard in blood, which results in the measured adducted peptide response. This method does not report the true concentration of adducted peptide, since sulfur mustard most likely binds to unmonitored proteins. The method was characterized by running no more than two calibration curves per day, each with a QC set, over an 8-week period by two individual analysts.
Results
The current method for assessing sulfur mustard adducts based on Cibacron Blue cartridge enrichment of albumin entails several manual cartridge steps and is not optimal for parallel processing of samples. Our interest in increasing throughput and ease of sample preparation led us to investigate alternative enrichment strategies for albumin. The Pierce® Blue Albumin Removal Kit includes Cibacron Blue discs that are readily transferred to a 96-well plate and have sufficient binding capacity for albumin adduct analysis. We assessed recovery of the Cibacron Blue cartridge and SwellGel® discs by comparing the response of the 470 → 105 m/z transition from equal column loadings of three concentrations of H8-sulfur mustard-spiked plasma preparations and found both to be equivalent.
In addition to searching for alternative albumin enrichment strategies, we also explored approaches for desalting. We investigated 96-well desalting plates (Zeba Spin Desalting Plate, Fisher Scientific), protein precipitation plates (Pierce, Fisher Scientific) and TCA/acetone precipitation in a 96-well format using centrifugation by comparing the response of the 470 → 105 m/z transition from equal column loadings of five concentrations of H8-sulfur mustard-spiked plasma preparations. Although the desalting plate resulted in increased sensitivity for the lower concentration spiked plasma samples, the response was not linear. We achieved similar results for the two precipitation procedures; both were linear over three orders of magnitude. Due to cost and concerns with effective resolubilization on the protein precipitation plate, we chose the TCA/acetone precipitation method for desalting the Cibacron Blue-enriched albumin preparation.
While optimizing the various sample preparation procedures, we found that the sensitivity of the Cibacron Blue cartridge-based method in our hands with the most recent calibrator materials was about 10-fold less than originally reported. The original albumin adduct method, (28) based on a series of protein precipitation steps, is reported to have a limit of quantitation (LOQ) of 0.0045 µM sulfur mustard exposure (29). We were interested in increasing the sensitivity of the Cibacron Blue method to make it comparable with that of the original precipitation-based albumin adduct method. Including a C18 solid-phase extraction step using a Phenomenex® Strata C18-E 96-well plate (100 mg/well, 55 μm, 70 Å) increased sensitivity ∼6-fold.
Chromatography for the Cibacron Blue cartridge-based method varies between labs, but typically utilizes a 150 × 1-mm column with a 30- to 60-min gradient at 50 µL/min. We were interested in decreasing the run time to increase throughput. We chose to decrease the column length and increase column diameter to accommodate the pressure associated with an increased flow rate. With only one analyte monitored in this method, we chose to utilize a step gradient separation. We were able to inject 50 µL of extracted sample without any loss of peak shape or retention time. The increased sample volume directly related to increased sensitivity. Figure 4 shows a typical chromatogram for the four transitions acquired in the method. The adducted pronase peptide ([HETE]–CPF) elutes at ∼6 min.
![LC–MS-MS chromatogram of [HETE]–CPF from pronase digestion of Cibacron Blue-enriched albumin from a 5 μM H8-sulfur mustard-spiked plasma sample. Quantitation ion (470 → 105 m/z), confirmation ion (470 → 137 m/z), internal calibrator (478 → 113 m/z) and internal calibrator confirmation ion (478 → 145 m/z) elute at ∼6 min.](https://oup.silverchair-cdn.com/oup/backfile/Content_public/Journal/jat/38/1/10.1093/jat/bkt088/2/m_bkt08804.jpeg?Expires=1716416235&Signature=rvWGkbpiJgWQPLZcgiKI~NGAmTz0wVRXHbJn5nMX4ZxJX~rkkpKG~BYIifu8xDjVuoXWdku5zakUWpO-oNxAHqNEnGMPIc5llpWXSSMgKrCiaYtHf-Wuwgvg5gLVilf3SOYYefxwUQtBzf5YxulVXKRIpS2utOMMDc6wiowSv7twz4bz-bCUrVQppMSb-aKTABgeDZOTQXWOIaFeEkASeH9uL1aJI7bYZR8vsKYiieKOZ8FEhZ-oZJliv9-kkixEQi8sbHpspzMWdunOAaFowVHSgkf4~dB968W-Nc~gGJ8d0isFvCaLq2SNoUyNaxhKnE6hBfGzs7JtAuyctOhZzQ__&Key-Pair-Id=APKAIE5G5CRDK6RD3PGA)
LC–MS-MS chromatogram of [HETE]–CPF from pronase digestion of Cibacron Blue-enriched albumin from a 5 μM H8-sulfur mustard-spiked plasma sample. Quantitation ion (470 → 105 m/z), confirmation ion (470 → 137 m/z), internal calibrator (478 → 113 m/z) and internal calibrator confirmation ion (478 → 145 m/z) elute at ∼6 min.
Inherent to this method is the specificity of the quantitation ion. The transition monitored for quantitation represents the loss of CPF from the protonated adduct (470 → 105 m/z). This product ion mass for [HETE+H]+ (105 m/z) is unique when considering the typical fragment ions generated by peptides in the low m/z range. However, to increase specificity of the method, a confirmation ion was included in the analysis. The transition monitored for confirmation represents the loss of the protonated adduct with the cysteine sulfur atom attached (470 → 137 m/z). Similar to the quantitation ion, the product ion mass for [HETE–S+H]+ (137 m/z) is also unique among the typical fragment ions generated by peptides in the low m/z range. The confirmation ion ratio (CIR, the area of the confirmation ion peak divided by that of the quantitation ion peak) was found to be reproducible. The within-run average CIR for the calibrators ranged from 0.353 to 0.412, with relative standard deviations (RSDs) ranging from 3.04 to 16.81%. The specificity of the method was confirmed by analyzing a convenience set of 124 individual plasma specimens from healthy individuals with no known exposure to sulfur mustard. No background/interference peaks were measured in any of the 124 unexposed specimens at the corresponding retention time of [HETE]–CPF.
Since a large volume and high concentration of extracted peptide is analyzed by LC–MS-MS for this method, matrix effects were assessed using post-column infusion of 1 ppm H8–[HETE]–CPF at 10 µL/min and monitoring the quantitation and confirmation ion transitions after 50 µL injection of the aforementioned convenience set plasma specimens (36). At the expected retention time of [HETE]–CPF, there is approximately a 2-fold decrease in signal. Dilution of the plasma samples 4-fold eliminates any observed ion suppression, but also decreases the overall signal intensity of the internal calibrator. As the matrix effect was not substantial, we chose to accept this level of ion suppression. Samples were run undiluted with the caveat that the source and Q0 would need to be cleaned on a regular basis.
The limit of detection (LOD) was estimated by calculating 3So for both quantitation and confirmation ions (37). The LOD estimate for the quantitation ion is 0.0048 µM. The lowest reportable limit (LRL) is, however, set to be the concentration of the analyte in the lowest calibrator in accordance with the Clinical Laboratory Improvement Amendments (CLIA) regulations, laboratory requirements, 42 C.F.R. Part 493 (2004). For the new enhanced throughput method, the LRL corresponds to a 0.050 µM sulfur mustard exposure, which is the lowest calibrator that gives a reproducible confirmation ion signal. From the analysis of 20 curves, the mean for the lowest calibrator was calculated to be 0.049 µM, with an accuracy of 97.5% and precision of 9.1% RSD.
Calibrator concentrations were chosen to cover a wide range of possible exposure levels. The [HETE]–albumin adduct assay has only been used to assess the extent of exposure from a small number of exposed individuals. Blood samples taken from nine Iranian casualties during the Iran–Iraq war had adduct levels ranging from 0.4 to 1.8 µM sulfur mustard exposure (28). All patients had skin injuries consistent with sulfur mustard exposure. Blood samples taken from two ordnance technicians exposed to sulfur mustard during destruction of a WWI munition were also found to have [HETE]–albumin adducts. One patient, with chemical burns over ∼6.5% of the body, had albumin adduct levels measured at 0.354 µM sulfur mustard exposure 2 days post-exposure. The other patient, who presented with only one small blister, had albumin adduct levels averaging 0.017 µM sulfur mustard exposure 2 days post-exposure (11).
Due to the extremely low tolerance for false positives associated with reporting results from this method, we selected the lowest calibrator based on a combination of specificity and sensitivity rather than entirely on sensitivity. The lowest calibrator was chosen based on the sulfur mustard-spiked concentration that approached the LOQ of the original albumin adduct method (0.0045 µM) (29), yet permitted integration of the confirmation ion with high confidence (signal-to-noise = 10). The highest calibrator was chosen based on estimation of the sulfur mustard-spiked concentration, which would reflect a severe exposure with chemical burns over the majority of the body. The highest calibrator concentration represents approximately 2 × LD50 (lethal dose 50, 96 h) in the hairless guinea pig model after intravenous administration of sulfur mustard (38). The intermediate points were chosen to result in a curve with at least seven points spanning three orders of magnitude. For ease of dilution of the spiked plasma stock solutions, we chose multiples of 2 and 5 to span the calibration range, adding one additional point at the low end of the curve. QC concentrations were selected to fall in the middle of the curve between the third and the fourth calibrators (QC-low) and sixth and seventh calibrators (QC-high).
Individual curves were analyzed using a linear regression with 1/× weighting. For 20 curves, the average slope was 1.0114 ± 0.1102 (slope ± standard deviation), intercept was 0.0037 ± 0.0088 and correlation coefficient value was 0.9997 ± 0.0003. Based on the average correlation coefficient and its calibrator deviation for 20 curves, the method is linear over three orders of magnitude.
Precision was assessed by calculating the RSD for 20 measurements of the calibrators and QC samples. True accuracy cannot be assessed due to the indirect measurement of chemical exposure. However, accuracy can be inferred by comparing the average calculated value with the known spike value for the calibrators and QC samples over 20 measurements. Table II depicts the mean, accuracy and RSD for the calibrators and QC samples. Accuracy for all calibrators and QC samples is >95%, with a precision of <10% RSD. The 20 QC measurements were analyzed by the Statistical Analysis System (SAS) for random and systematic errors based on Westgard Rules (1 3S Rule, 2 2S Rule, R 4S Rule and 10 x-bar Rule) (39). No runs were rejected, and neither QC-low nor QC-high results fell outside of 2 SD (data not shown).
Calibrator and QC sample mean concentrations, accuracy and RSD over 20 measurements
| Sample ID | Expected concentration (μM ExP)a | Mean concentration (μM ExP)a | Accuracy (%) | RSD (%) |
|---|---|---|---|---|
| Calibrator 1 | 0.050 | 0.049 | 97.5 | 9.1 |
| Calibrator 2 | 0.080 | 0.079 | 99.2 | 6.0 |
| Calibrator 3 | 0.100 | 0.096 | 95.6 | 7.9 |
| Calibrator 4 | 0.500 | 0.513 | 102.5 | 5.4 |
| Calibrator 5 | 1.00 | 1.03 | 103.0 | 6.2 |
| Calibrator 6 | 5.00 | 5.15 | 103.0 | 4.2 |
| Calibrator 7 | 10.0 | 10.1 | 100.6 | 3.8 |
| Calibrator 8 | 50.0 | 49.8 | 99.6 | 1.2 |
| QC-Low | 0.250 | 0.259 | 103.6 | 6.5 |
| QC-High | 6.25 | 6.21 | 99.3 | 6.2 |
aThe expected and calculated concentration units “μM ExP” are based on in vitro exposure of plasma to sulfur mustard.
ExP: exposed plasma.
Discussion
We have presented modifications to the Cibacron Blue cartridge-based method (29) for measuring [HETE] adducts to albumin which decrease analysis time, increase sensitivity despite decreasing plasma amount requirements, increase specificity and increase reproducibility. These improvements include transferring the method to a 96-well plate format, which was accomplished by changing the albumin enrichment procedure from a GE Healthcare HiTrap® Blue cartridge column to Pierce Blue Albumin SwellGel® Discs. These discs are readily transferred to a 96-well fritted plate and allow facile scaling by the addition of multiple discs. Although the cartridge column recovers more total protein compared with a single gel disc, the current method based on cartridges analyzes only a small fraction of the recovered albumin (1/60th). In addition to using a smaller format enrichment strategy, we found that we could also decrease the required plasma sample amount (200 µL, 40% of the current method based on cartridges) and still achieve equivalent sensitivity. Reducing sample volume allows us to accept lower sample volumes, enables repeat analysis and permits confirmatory work using different methods and laboratories. Young et al. (40) investigated several albumin depletion products for albumin enrichment, and though they found the HiTrap® Blue column to provide higher albumin purity compared with the SwellGel® discs (88 vs. 78%), they found slightly higher signal intensities/mg of protein recovered by the gel discs when monitoring for both H8– and D8–[HETE]–CPF peptides by LC–MS-MS.
This method is a retrospective method to detect exposure to sulfur mustard. Except for a few individuals involved in the demilitarization of sulfur mustard munitions, it is not expected that the general population would have HETE-adducted albumin in their body. We evaluated a convenience set of 124 plasma specimens from a random sampling of individuals and found no peak present at the expected retention time of the [HETE]–CPF peptide in any of the samples. These results suggest that biomarker levels detected above the LRL with a CIR within ±20% of the average calibrator CIR for the batch would be consistent with exposure to sulfur mustard and not a background interference. Running an expanded reference range study with a larger number of unexposed patient samples would help to increase the confidence in this assessment. It is important to note, however, that data from this assay have to be interpreted in the context of the larger epidemiological picture including patient case history, symptoms and environmental sample data in order to make a positive diagnosis of sulfur mustard exposure.
Despite the improved performance of the reported plate-based method, all versions of the sulfur mustard albumin adduct method to date are limited by the availability of pronase with the required activity. In examining new pronase lots from three different vendors, we have not been able to identify a lot that results in generation of the adducted tripeptide to the same level as the older pronase lots. As pronase is a mixture of proteinases that is typically used for complete digestion of proteins into individual amino acids, it is suspected that the newer commercially available pronase preparations may be more efficient at digesting around a site of adduction, resulting in complete digestion of the tripeptide and loss of our biomarker signal.
Changing to a more specific enzyme should resolve the issue of variation in the activity of newer lots of pronase and also allows us to measure the percent adduction. With the existing pronase-digested albumin method, monitoring for the unadducted tripeptide transition (366.2 → 263.2) results in high background and a complex chromatogram, making assessment of the percent adduction unfeasible. Choosing a more specific enzyme that generates a slightly longer peptide should provide the specificity needed to measure both the adducted and unadducted peptides and to determine percent adduction. In addition, switching to a more specific enzyme will decrease the amount of enzyme needed, thereby decreasing the amount of background peptides in the peptide extract and possibly decrease ion suppression.
In the field of proteomics, trypsin is the enzyme of choice for protein identification and characterization. Trypsin is chosen for several reasons, including its low cost, its specificity (C-terminal to lysine and arginine residues) and the sequence information that it provides. Trypsin was examined as a possible enzyme for this method initially (28); however, the tryptic peptide produced was found to be not as sensitive as the pronase tripeptide and also had interferences near its retention time. The decrease in sensitivity is most likely due to the size of the peptide produced in digesting HSA with trypsin. Trypsin generates a fairly large peptide encompassing the adduction site (21 amino acids), which typically produces several multiply charged species by electrospray ionization and spreads out signal intensity. For the purposes of quantitation, selection of an enzyme that produces smaller peptides is often desirable as it should decrease the charge state distribution and increase sensitivity. High-specificity chymotrypsin is a good choice for an alternative enzyme for this method, as it produces a fairly small peptide (a hexapeptide, LQQCPF) that encompasses the adduction site and still should provide the needed specificity. Initial experiments investigating the use of chymotrypsin have begun and look promising (data not shown).
HSA is the most abundant protein in serum/plasma with an average concentration of ∼35–55 mg/mL in blood plasma (41). The ability to purify large amounts of albumin, along with a fairly stable adduction and a relatively slow turnover rate of ∼20 days, makes HSA advantageous for retrospective determination of chemical exposure (42). Cysteine residues are one of the most reactive groups in proteins; they are excellent nucleophiles and make good targets for electrophilic chemicals (43). A wide range of electrophiles bind the one available cysteine residue (Cys-34). Adducts to Cys-34 have been detected from reactive oxygen species, aldehydes, oxiranes, quinones, metal ions and several drugs (43–45) in addition to vesicants, including nitrogen mustards and sulfur mustard (28, 46).
In addition to Cys-34, tyrosine-411 (Tyr-411) is also a reactive residue found on HSA. Nerve agents and a wide range of organophosphate pesticides bind to Tyr-411 (15, 47–49). Similar to the Cys-34 adduction site, chymotrypsin digestion of HSA is predicted to produce a suitable peptide encompassing the Tyr-411 adduction site (an octapeptide) for SRM. The combination of the two reactive sites with chymotrypsin digestion makes HSA an attractive biomarker to monitor for diverse chemical agents (vesicants and nerve agents) at the same time. With the wide range of known chemicals that adduct these two sites, and with careful selection of fragment ions, precursor-ion scans can be used to monitor for both known and unknown modifications to these sites (50).
In summary, we have developed and validated an enhanced throughput method for the detection of exposure to sulfur mustard by measuring its adducts to HSA. The reported method is based on Cibacron Blue enrichment in a 96-well plate format, digestion of the purified albumin with pronase and isotope dilution LC–MS-MS analysis of the peptide biomarker of exposure [HETE]–CPF. The reported method was designed to provide clinically relevant data regarding exposures to sulfur mustard with sufficient specificity, precision and accuracy. Additional diagnostic constraints include an extremely low tolerance for false-positive results. Calibrator concentrations were chosen to cover a wide range of possible exposure levels, and the quantitation range of this analytical method is well below the expected concentrations that can result from a high-level or fatal exposure. Additionally, the incorporation of a 96-well plate format has increased our response capabilities in the case of a large-scale emergency.
Conflict of interest
The findings and conclusions in this report are those of the authors and do not necessarily represent the views of the Centers for Disease Control and Prevention. Use of trade names is for identification only and does not imply endorsement by the Centers for Disease Control and Prevention, the Public Health Service or the US Department of Health and Human Services.
Acknowledgments
The authors thank the members of the Analytical Response and LRN-C Laboratories, Emergency Response Branch, Division of Laboratory Sciences, NCEH, CDC, for technical assistance and thoughtful discussions during the analysis of the individual specimens and preparation of this manuscript.
References
Author notes
Authors’ contributions: The manuscript was written through contributions of all the authors. All the authors have given approval to the final version of the manuscript.
Funding: This work was funded by the Centers for Disease Control and Prevention and the Defense Threat Reduction Agency (DTRA).
