


Abstract
To perform a systematic review and meta-analysis of the level of funding support and the sputum culture conversion rates in pulmonary Mycobacterium avium–intracellulare complex (P-MAC) disease in adult patients without cystic fibrosis or HIV infection, treated with recommended antibiotic regimens.
We performed a literature search to identify clinical trials, prospective studies and registries that reported outcomes in P-MAC patients. Studies that reported P-MAC diagnosis and treatments based on established guidelines met the inclusion criteria and were examined for bias and quality. We modified existing quality scales and came up with a 10 star quality score. Outcomes meta-analysed were sputum conversion incidence ratios (IR) and their 95% CI, weighted for study quality.
Twenty-one studies that examined 28 regimens, including 2534 patients in intent-to-treat analyses and 1968 in per-protocol analyses, were identified. The study quality mean ± SD scores were 5.4 ± 2.2 out of 10 stars. Only two (9.5%) studies received public funding. There was significant heterogeneity of microbial effect among treatment regimens (I2 > 40%; P > 0.001). The pooled IR for sustained sputum conversion was 0.54 (95% CI 0.45–0.63) for macrolide-containing regimens versus 0.38 (0.25–0.52) with macrolide-free regimens. Prolonging therapy duration beyond 12 months was associated with an average decline in sputum conversion to 22% (95% CI 1%–44%).
Researchers working on P-MAC therapy have received very little public funding support. As a result, the evidence base for treatment guidelines is based on studies of relatively small numbers of patients in low-quality studies. Nevertheless, these studies showed poor sputum conversion rates in patients receiving recommended treatment regimens.
Introduction
Mycobacterium avium–intracellulare complex (MAC) accounts for most cases of non-tuberculous mycobacterial pulmonary infection; its prevalence is increasing worldwide.1,2 In the USA, pulmonary MAC (P-MAC) is now more common than tuberculosis.3 Unlike Mycobacterium tuberculosis, MAC is not transmitted from person to person; therefore, there are no public health infrastructures to deal with the rising epidemic, similar to the situation encountered in childhood tuberculosis.4 Here, we were interested in the impact of this paradigm on public funding for this disease.
P-MAC is currently treated with an expensive multidrug combination, for which sputum culture conversion rates of 40%–80% have been reported.5–7 However, recurrence occurs in half of those completing therapy. Moreover, the majority of patients still endure poor health-related quality of life, including serious adverse drug events and diminished lung function.8,9 Furthermore, there is little evidence to suggest that different therapeutic approaches, including additional drugs or prolongation of therapy, offer additional benefits or make a difference in outcomes.10,11 Indeed, in some cases clinicians have withheld treatment as they perceive the side effects of treatment to be worse than the disease.2
Macrolides are considered indispensable to the standard treatment regimen. We were interested to examine the evidence base for the Infectious Diseases Society of America (IDSA) and the American Thoracic Society (ATS) recommendations, when microbiological criteria are used to define outcome.2 To achieve that, we performed a comprehensive search to identify, and to systematically review and meta-analyse, prospective clinical studies of treatment for P-MAC.
Methods
Standards and search strategy
The study was performed in accordance with the Preferred Reporting Items for Systematic Reviews and Meta-Analyses (PRISMA) guidelines.12 The PRISMA checklist for the current study is available as Table S1 (Supplementary data at JAC Online). We searched PubMed, Embase, LILACs, Cochrane and Web of Science, as well as the grey literature (www.greylit.org) to identify full-length articles published up to 30 June 2016. The following search terms and their variations were used: ‘Pulmonary AND Mycobacterium avium’ or ‘Nontuberculous Mycobacteria AND Outcomes’. We supplemented our databases by screening the references of previous systematic reviews and meta-analyses, thereby updating those reviews.6,7 After removing duplicates, we reviewed titles and abstracts of publications identified in the initial search to determine eligibility. There were no language restrictions applied to searches.
Eligibility criteria
Original studies that reported treatment regimens and clinical outcomes of patients with P-MAC met the inclusion criteria. The basis for establishing a diagnosis of P-MAC in this study was as recommended by IDSA/ATS guidelines.2 Eligibility was restricted to prospective studies (observational cohort), and to clinical trials and reports from established P-MAC disease registries documented on the clinicaltrials.gov website. Retrospective studies, or prospective case series with fewer than 10 subjects, or studies of patient groups with cystic fibrosis or HIV infection were excluded because of the inherent bias associated with such study designs. Studies performed in patients with disseminated MAC or hypersensitivity pneumonitis due to MAC were excluded because the pathogenesis and treatment approach to both diseases are different from that used for P-MAC.6,13 Two reviewers (J. G. P. and D. O.) independently selected studies and extracted data from identified studies.
Definition of terms
The current definition of P-MAC sputum culture conversion is dependent on the method used to obtain the samples, the number of samples collected available for examination, and the ease of liquid versus solid cultures. The definition of sputum culture conversion, and the methods used to collect, process and interpret the results, have varied widely over the years.6,14,15 We chose to use the term ‘sputum conversion’ as originally intended by each study. Since the definitions of when sputum conversion is said to occur varied, we examined sputum conversion definition at different pre-specified timepoints as outcomes: (i) after 6 months of therapy; (ii) at the end of therapy; or (iii) on follow-up after stopping therapy. Sustained sputum culture conversion referred to the absence of growth in cultures on follow-up after stopping therapy. Microbiological recurrences referred to patients who had attained ‘sputum culture/smear conversion’ status but in whom disease relapse occurred on follow-up, regardless of whether the infecting organism was the same organism or a new strain. This was defined as at least two consecutive positive cultures after sputum conversion. Therapy failure was defined as either patients dying during therapy, or therapy changed and did not convert sputum, relapsed or failed to convert outright.
Study quality assessment
Study quality was assessed for risk of bias using a two-step process with two separate instruments: the Newcastle–Ottawa Scale and the RTI item bank (RTI-IB) questionnaire. The former is more qualitative while the latter is more quantitative and useful for assessing effect size precision. Briefly, RTI-IB comprises 29 non-weighted questions that evaluate the quality of studies by grading reports of interventions, treatments or exposures (https://www.effectivehealthcare.ahrq.gov/ehc/products/414/1612/RTI-item-bank-bias-precision-130805.pdf).16 The Newcastle–Ottawa Scale contains eight semi-quantitative items that range between zero and four stars categorized into three domains: selection, comparability and outcomes/exposures (http://www.ohri.ca/programs/clinical_epidemiology/oxford.asp). This scale awards a maximum of nine stars to each study: four for adequate selection of participants, two for comparability of patient groups based on study design and analysis, and three for adequate ascertainment of outcomes. Both tools, which are consistent with the GRADE methodology and fulfil PRISMA criteria, have demonstrated utility and validity (face and content) in the evaluation of clinical studies.12,16,17 We modified the Newcastle–Ottawa Scale scoring by adding a one point star for randomization, so that the total score was 10 stars. We defined low quality as ≤4 stars, moderate quality as >4 but ≤7 stars, and good quality as >7 stars. Two reviewers (J. G. P. and D. O.) scored each study separately using both questionnaires. Agreement between the two instruments and reviewers was assessed using percent scores. A third reviewer (T. G.) acted as referee and final scorer whenever disagreements arose between the two reviewers.
Statistical analyses
Since P-MAC therapy is generally poorly tolerated, and some patients default or are purposely taken off treatments early in therapy because of adverse events, we decided a priori to undertake intention-to-treat analyses in addition to per-protocol analyses. The primary endpoint was sputum culture conversion: (i) after 6 months of therapy; (ii) at the end of therapy; and (iii) on follow-up after stopping therapy (i.e. sustained sputum culture conversion). The secondary composite endpoint was failure of therapy, comprising death, recurrence and microbiology failures.
We calculated the incidence ratios (IR), risk ratios (RR) and their 95% CI across therapy regimens, stratified by nodular/bronchiectatic versus fibrocavitary disease, disease severity and study quality. The DerSimonian and Laird random effects model, which incorporates variation between studies in weighting, was used to pool estimates and was performed with STATA software, version 14 (College Station, TX, USA). Freeman and Tukey double arcsine transformation was used to stabilize the variance.18 This allowed admissible 95% CI in events when sample sizes were small and/or proportions were near the margins. To quantify inconsistency across studies by describing the percentage of the variability in effect estimates from heterogeneity we used the I2 statistic with I2 ≤40% representing moderate, >40% but ≤80% substantial, and >80% considerable heterogeneity.19 To assess the veracity of our findings, several study level factors obtained, including study quality and proportion of patients with different P-MAC disease phenotypes, were examined with subgroup analysis and fractional meta-regression with quasi-likelihood estimators and robust standard errors.20 The factors examined in the subgroup analysis included study quality and the proportions of patients with P-MAC disease diagnoses of either nodular/bronchiectatic disease or fibrocavitary disease. Egger’s test was used to assess for publication bias and small study effects. Finally, we also wanted to identify the proportion of studies that received public funding for performance, in order to gauge the level of support researchers received for P-MAC studies. We gave a score of 2 for any public funding (governmental or national/international granting institutions), 1 for any level of funding from the pharmaceutical industry, and 0 when no public or pharmaceutical funding was used.
Results
Studies included and funding of studies
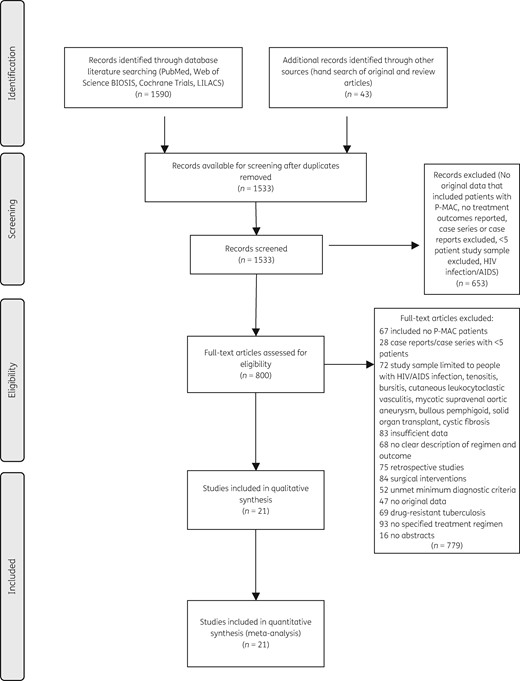
We identified 21 studies that prospectively enrolled adult patients with nodular bronchiectatic or fibrocavitary P-MAC disease, or both, over a period of four decades from 1977 to 2015 (Figure 1).10,11,14,21–38 Table 1 describes the 21 primary studies that met the inclusion criteria. These studies comprised 2534 patients who were eligible for intent-to-treat analyses; 1968 (78%) of these received some therapy and were evaluated for outcomes as identified by the study protocol. At least 272 (11%) patients were reported in multiple studies, and it was sometimes difficult to decipher actual patient groups or identify studies reporting the same patients in multiple manuscripts. Nonetheless, after exclusion of some duplicate reports we estimate that the effective intent-to-treat sample was 2224 patients and the per-protocol sample was 1696 patients. There were two studies that exclusively recruited a combined 424 patients with nodular bronchiectatic disease based on radiological findings.36,37 There were only two publicly funded studies, for a total score of 4 (Table 1).34,37 Nine (43%) studies did not report any funding, which means they received a total score of zero. Ten studies reported funding from the pharmaceutical industry, of which one also reported receiving money from a philanthropic organization. Overall, the mean ± SD funding score was 0.68 ± 0.67 out of a maximum possible score of 2.
Characteristics of studies meeting inclusion criteria for meta-analysis
| Study ID (year published), relevant citationsa | Study design; enrolment years | Locale (type of institutions) | Patients enrolled; P-MAC disease type | Sputum conversion definition; clinical endpoints examined | Study quality | Study funding (scores) |
|---|---|---|---|---|---|---|
| Macrolide/azalide free-regimens | ||||||
| 1. Ahn et al. (1986)21 | prospective observational; 1977–84 | Texas, USA (single tertiary, referral centre) | 120; new and previously treated FCD and NBED patients; 46 evaluated for clinical efficacy | ≥2 consecutive negative sputum cultures; 24 month outcomes including recurrences | low (3*) | none stated (0) |
| 2. BTS (2001)22,48 | RCT; 1987–92 | UK, Scandinavia | 75; new and previously treated FCD and NBED; 75 evaluated for efficacy | negative sputum cultures; 36 month post-treatment outcomes (5 year follow-up) | moderate (7*) | full private (BTS) (1) |
| Macrolide-containing regimens | ||||||
| 1. Wallace et al. (1994)23 | prospective, open, non-comparative trial; 1991–92 | Texas, USA (single tertiary referral centre) | 30; new and previously treated FCD and NBED; 20 evaluated for clinical efficacy | 3 consecutive negative cultures; definite microbiological response (reduction in colony counts on 3 successive cultures) at 6 months and at end of therapy | low (4*) | partial, private (1) |
| 2. Dautzenberg et al. (1995)24 | prospective compassionate use trial; 1990–92 | France (multiple; 40 centres) | 45; new and previously treated FCD and NBED; 45 evaluated for clinical efficacy | 6 consecutive months negative sputum cultures; end of treatment sputum conversion | low (3*) | partial, private (1) |
| 3. Wallace et al. (1996)25 | prospective, open, non-comparative trial; IND; 1992–94 | Texas, USA (single tertiary referral centre) | 50; new and previously treated FCD and NBED; 39 evaluated for clinical efficacy | 3 consecutive negative cultures within 2 months; recurrences | low (4*) | partial, private (1) |
| 4. Griffith et al. (1996)14 | prospective, open, non-comparative trial; 1993–94 | Texas, USA (single tertiary referral centre) | 29; macrolide-treatment-naive FCD and NBED; 23 analysed for efficacy | 3 consecutive negative cultures; response also measured in semi-quantitative reduction in cfu | low (4*) | partial, private (1) |
| 5. Roussel and Igual (1998)26 | prospective, open, non-comparative trial; 1992–94 | France (multiple centres) | 30; new and previously treated; FCD and NBED; only 22 evaluated | 6 consecutive months of negative cultures; 24 months recurrences | low (4*) | none stated (0) |
| 6. Griffith et al. (1998)27 | prospective, open, non-comparative trial | Texas, USA (single tertiary referral centre) | 68; new and previously treated; FCD and NBED; 58 evaluated | 3 consecutive negative cultures; response measured in semi-quantitative cfu reduction | low (4*) | partial, private (1) |
| 7. Tanaka et al. (1999)28 | prospective, open, non-comparative trial; 1992–97 | Japan (single, referral centre) | 46; new and previously treated FCD and NBED; 46 evaluated | negative cultures for 3 consecutive months; relapse at end of therapy (variable follow-up period) | low (3*) | none stated (0) |
| 8. Griffith et al. (2000)29 | prospective, open, non-comparative trial (IND for CLR/RFB) | Texas, USA (single, referral centre) | 59; new and previously treated FCD and NBED; 41 evaluated for efficacy | 3 consecutive negative cultures, reduction in colony counts; outcomes after 6 month therapy | low (4*) | partial, private (1) |
| 9. Griffith et al. (2001)14,27,30 | prospective, open, non-comparative trial (IND for CLR/RFB) | Texas, USA (single, referral centre) | 103; new and previously treated FCD and NBED; 92 evaluated | 3 consecutive neg. cultures, reduction in colony counts; outcomes after >12 month therapy | moderate (7*) | partial, private (1) |
| 10. Kobashi and Matsushima (2003)31 | prospective non-comparative study; 1998–2002 | Japan (multiple centres) | 102; treatment-naive FCD and NBED; 71 evaluated | 3 consecutive negative cultures within 6 months; sputum relapse, clinical improvement at end of therapy | moderate (7*) | none stated (0) |
| 11. Lam et al. (2006)32 | prospective, non-comparative trial; 2000–03 | USA (multiple centres, 17 cities**) | 91 new and previously treated FCD and NBED; 91 evaluated | reduction in colony counts, 3 consecutive negative cultures within 2 months, time-to-event; sustained negative through observation period | good (8*) | none stated (0) |
| 12. Kobashi and Matsushima (2007)11 | prospective non-comparative study; 1998–2004 | Japan (multiple centres) | 73; treatment-naive FCD and NBED; 65 evaluated | 3 consecutive negative cultures within 6 months; relapse on follow-up after end of 24 month treatment | moderate (7*) | none stated (0) |
| 13. Kobashi et al. (2007)10 | RCT; 1998–2004 | Japan (multiple centres) | 160; macrolide-treatment-naive FCD and NBED; 146 evaluated | 3 consecutive negative cultures within 6 months, relapse on follow-up | good (9*) | none stated (0) |
| 14. Jenkins et al. (2008)33 | RCT, factorial design for Mycobacterium vaccae; 1995–99 | UK, Italy, Scandinavia | 170 new and previously treated FCD and NBED; 170 evaluated using ITT analysis | sustained negative cultures, failure defined as 2 sputum smears in last 3 months; recurrence and death at 36 months post treatment | good (8*) | full, private (1) |
| 15. Koh et al. (2012)34,54,55 | ongoing prospective observational cohort; 2000–09 | Seoul, South Korea (tertiary referral centre) | 590; treatment-naive (112 FCD, 409 NBED and 69 unclassifiable); 295 evaluated | 3 consecutive negative cultures within 6 months; time to conversion; outcomes at end of treatment. | low (4*) | full, public (2) |
| 16. Miwa et al. (2013)35 | RCT open label; 2009–11 | Japan (single tertiary centre) | 119; treatment-naive FCD and NBED; 119 evaluated | 3 consecutive negative cultures; outcomes at end of treatment | good (9*) | none stated (0) |
| 17. Wallace et al. (2014)15,36 | mixed retrospective and prospective | Texas, USA (referral centre) | 207; NBED only; 180 evaluated | 3 consecutive negative cultures; 1 negative with no further samples; treatment failures (+relapse) | moderate (7*) | institutional support; private |
| 18. Jeong et al. (2015)37 | mixed retrospective and prospective; 2005–12 | Seoul, South Korea (tertiary referral centre) | 217 treatment-naive NBED only; 217 evaluated | 3 consecutive negative cultures within 6 months; time to conversion; outcomes at end of treatment | low (4*) | full, public (2) |
| 19. Jarand et al. (2016)38,56 | mixed retrospective and prospective; 1990–2009 | Alberta, Canada (referral centre) | 150; treatment-naive FCD and NBED; 107 evaluated | ≥2 consecutive negative culture; 1 negative with no further samples | low (3*) | none stated (0) |
Abbreviations: BTS, British Thoracic Society; RCT, randomized control trial, IND, investigational new drug application; CLR, clarithromycin; RFB, rifabutin; FCD, apical fibrocavitary disease; NBED, nodular bronchoectatic disease.
Two or more citations means that data presented were reported more than once in separate publications.
Study enrolment.
Study quality
The agreement between the two reviewers for study selection was 88% and for grading 81%, which is good. Similarly, agreement between the two rating tools used was 60%, which is reassuring. A summary of the consensus grading scores is given in Table 2. The mean ± SD of study quality scores was 5.4 ± 2.2 out of 10 possible stars, which indicates overall low quality and a poor evidence base. Only 4/21 (19%) studies were ranked as good quality, 6/21 (29%) moderate quality, but the majority (11/21, 52%) were ranked as low quality. The poor-quality scores were mainly driven by: (i) small sample size; (ii) inadequate follow-up; and (iii) poor ascertainment of treatments and outcomes for patient groups, which raised concern of confounding bias.16,17 There was no publication bias in studies that examined 6 month and end-of-treatment outcomes (Figure 2a and b) and minimal large study bias for the follow-up studies (Figure 2c).
Modified Newcastle–Ottawa Scale quality assessment and consensus results of individual studies
| Domain and topics | |||||||||||||
|---|---|---|---|---|---|---|---|---|---|---|---|---|---|
| selection | comparability | outcome | |||||||||||
| Study | Type of study | representativeness of study cohort | randomization | selection of the treated cohort | ascertainment of treatment | outcome was not present at start of study | comparability: demographics and disease severity | comparability: other factors, follow-up | assessment of outcome | was follow-up sufficient | adequacy of follow-up of cohort | Total | Study quality |
| 1. Ahn et al. (1986)21 | PCS | + | + | + | 3 | low | |||||||
| 2. Wallace et al. (1994)23 | PCS | + | + | + | + | 4 | low | ||||||
| 3. Dautzenberg et al. (1995)24 | PCS | + | + | + | 3 | low | |||||||
| 4. Griffith et al. (1996)14 | PCS | + | + | + | + | 4 | low | ||||||
| 5. Wallace et al. (1996)25 | PCS | + | + | + | + | 4 | low | ||||||
| 6. Griffith et al. (1998)28 | PCS | + | + | + | + | 4 | low | ||||||
| 7. Roussel and Igual (1998)26 | PCS | + | + | + | + | 4 | low | ||||||
| 8. Tanaka et al. (1999)28 | PCS | + | + | + | 3 | low | |||||||
| 9. Griffith et al. (2000)29 | PCS | + | + | + | + | 4 | low | ||||||
| 10. BTS (2001)22,53 | RCT | + | + | + | + | + | + | + | 7 | moderate | |||
| 11. Griffith et al. (2001)14,27,30 | PCS | + | + | + | + | + | + | + | 7 | moderate | |||
| 12. Kobashi and Matsushima (2003)31 | PCS | + | + | + | + | + | + | + | 7 | moderate | |||
| 13. Lam et al. (2006)32 | PCS | + | + | + | + | + | + | + | + | 8 | good | ||
| 14. Kobashi et al. (2007)10 | RCT | + | + | + | + | + | + | + | + | + | 9 | good | |
| 15. Kobashi and Matsushima (2007)11 | PCS | + | + | + | + | + | + | + | 7 | moderate | |||
| 16. Jenkins et al. (2008)33 | RCT | + | + | + | + | + | + | + | + | 8 | good | ||
| 17. Koh et al. (2012)34,54,55 | PCS | + | + | + | + | 4 | low | ||||||
| 18. Miwa et al. (2013)35 | RCT | + | + | + | + | + | + | + | + | + | 9 | good | |
| 19. Wallace et al. (2014)36 | PCS | + | + | + | + | + | + | 7 | moderate | ||||
| 20. Jeong et al. (2015)37 | mixR/P | + | + | + | + | 4 | low | ||||||
| 21. Jarand et al. (2016)38,56 | mixR/P | + | + | + | 3 | low | |||||||
BTS, British Thoracic Society; PCS, prospective cohort study; RCT, randomized control trial; mixR/P, mixed retrospective/prospective.
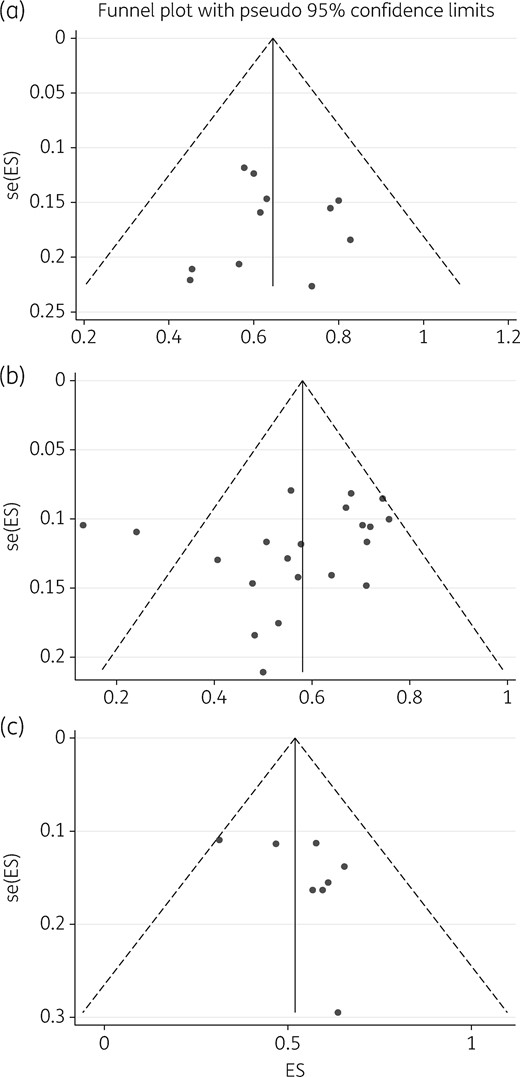
Publication bias and small-study effects. The figure depicts funnel plots examining publication bias and small-study effects for the three outcomes: 6 month therapy (a), end of treatments (b) and on follow-up (c). As shown, studies depicted in (a) and (b) are evenly distributed which is indicative of no obvious bias; however, in (c) there is some skewedness so that the blank spaces in the left lower half of the triangle indicate places we would have expected some studies, suggesting some bias. This suggests that there were fewer small studies enrolled to examine sustained sputum conversion. ES, effect size; se, standard error (of ES).
Composition of therapy regimens
There were 28 different regimens comprising ethambutol with/without a macrolide examined (Table 3). The duration for macrolide-containing regimens was variable, ranging between 4 and 93 months.23,38 The mean therapy duration for macrolide-free regimens was 23.06 ± 1.58 months, while that for macrolide-containing regimens was 18.06 ± 5.67 months. Nine of 21 (43%) studies also reported that one or more patients received surgical excision of localized lesions. There was no clear preference for any particular anti-MAC regimen even for distinct clinical disease diagnoses. There were 26 different regimens used for fibrocavitary diseases and more than 5 used for nodular/bronchiectatic disease.39
Description of the therapy regimens, doses and dosing patterns examined by studies included in the meta-analysis
| Study ID (year) | Drugs, drug doses and the dosing interval in combination regimens examined in studies | Therapy duration, months, mean ±SD (range) |
|---|---|---|
| Macrolide/azalide free-regimens | ||
| 1. Ahn et al. (1986)21 | 24 (INH + EMB + RIF) + 6 SM; daily, standard doses used for pulmonary tuberculosis | 21.27±3.06 |
| 2. BTS (2001)22,53 | 24 (RIF + EMB + INH) versus 24 (RIF + EMB); daily, standard doses | 24 |
| Macrolide-containing regimens | ||
| 1. Wallace et al. (1994)23 | 4 CLR 500 mg twice daily if ≥50 kg, >90 kg 1 g twice daily, otherwise 250 mg twice daily for <50 kg; other drug added after sputum culture conversion or after 4 months of therapy | NA |
| 2. Dautzenberg et al. (1995)24 | 12 (CLR + other drugs); high CLR ∼30 mg/kg/day, variable dosing pattern, doses >1.5 g/day | 10.0±6.2 |
| 3. Wallace et al. (1996)25 | 12 (RIF or RFB) + CLR + EMB + SM; low CLR dose <1 g/day; 500 mg twice daily; 4 months CLR monotherapy then other drugs added; 6 had lung resection | NA |
| 4. Griffith et al. (1996)14 | 4 AZI + 2 (EMB + RFB + SM); AZI 600 mg daily monotherapy, followed by the other drugs; comparison with CLR using historical controls23 | NA |
| 5. Roussel and Igual (1998)26 | 15 (CLR + CFZ + MC); CLR dose >1–2 g in twice/day equal doses | 14.64±1.22 |
| 6. Griffith et al. (1998)27 | AZI 600 mg thrice weekly + (Reg A versus Reg B) [Reg A = (EMB 25 mg/kg/day then 15 mg/kg/day + RFB ±SM), all daily; Reg B = EMB + RFB ±SM thrice weekly]. Surgical resection of severely affected lung in three patients | NA |
| 7. Tanaka et al. (1999)28 | 24 (OFX or LVX) + CLR + EMB + KM; CLR 10 mg/kg dose daily | 19.35±4.88 |
| 8. Griffith et al. (2000)29 | 6 (CLR 1 g + EMB + RFB) thrice weekly; comparison with AZI and CLR using historical controls23 | NA |
| 9. Griffith et al. (2001)14,27,30 | 18 [AZI (300–600 mg) + EMB + (RFB or RIF)], daily ±SM versus AZI 600 mg thrice weekly + daily [EMB + (RFB or RIF)] ±SM versus AZI + EMB + (RFB or RIF) thrice weekly±SM | NA |
| 10. Kobashi and Matsushima (2003)31 | >12 (CLR + EMB + RIF) daily ±2 SM thrice weekly; CLR 400 mg for <50 kg, 600 mg for ≥50 kg, 800 mg given if tolerated | 13.4±5.6; (1–28) |
| 11. Lam et al. (2006)32 | 18 (AZI or CLR) + EMB + (RIF or RFB) given thrice weekly; in RCT of ± inhaled IFN-γ; CLR 1 g and 750 mg, AZI 600 mg and 375 mg for >50 kg and ≤50 kg body weight, respectively | CLR 8.83; AZI 11.43; all 10.13±1.84 |
| 12. Kobashi and Matsushima (2007)11 | 24 (RIF + EMB + SM + CLR); 400 mg versus 600 mg CLR | 24 |
| 13. Kobashi et al. (2007)10 | 24 (CLR + EMB + RIF + SM) versus 24 (CLR + EMB + RIF); SM given im thrice a week, other drugs daily; CLR dose 15 mg/kg/day | SM 27.6±7.8; (24–36) versus no SM 28.4±8.0; (24–42) |
| 14. Jenkins et al. (2008)33 | 24 (CLR + EMB + RFB) versus 24 (CIP + EMB + RFB); CLR 750 mg twice daily; study also randomized M. vaccae | 24 |
| 15. Koh et al. (2012)34,54,55 | 24 (CLR + EMB + RIF ±SM) ±surgical excision of lung lesions; CLR given as 1 g daily doses; M. avium versus M. intracellulare (NCT00970801 on ClinicalTrials.gov); surgical resection in 12 patients | NA |
| 16. Miwa et al. (2013)35 | 12 (CLR + EMB + RIF) versus 12 (CLR + EMB); CLR 200 mg thrice daily or twice for patients <40 kg | |
| 17. Wallace et al. (2014)15,36 | >12 (RIF or RFB) + EMB + (CLR or AZI); AZI versus CLR versus both; surgical resection in 6 patients | CLR 18.6±8.8; AZI 18.8±6.3 |
| 18. Jeong et al. (2015)37 | 12 [AZI (500 mg) or CLR (1 g)] + EMB + RIF ±3 SM; thrice weekly; versus standard daily therapy (NCT00970801) | daily 24.3 (23.8–24.5); thrice weekly 16.6 (15.2–18.4) |
| 19. Jarand et al. (2016)38,56 | >12 CLR or AZI + EMB + (RIF or CFZ) + others; CLR 500 mg twice/day, AZI 250 mg/day 5 days per week; surgical resection for recalcitrant patients | 15±9; (6–93) |
NA, individual patient estimate not available; AZI, azithromycin; CLR, clarithromycin; CIP, ciprofloxacin; CFZ, clofazimine; EMB, ethambutol; IFN-γ, interferon-γ; KM, kanamycin; OFX, ofloxacin; LVX, levofloxacin; RIF, rifampicin; RFB, rifabutin; SM streptomycin.
Descriptive statistics of microbiological outcomes
The definition of sputum culture conversion differed over the studies examined (Table 1). Microbiological outcomes were examined after 6 months of therapy in 12 regimens in 11 unique studies, and at the end of therapy in 22 regimens in 15 unique studies. Two types of pooled analyses were performed for outcomes at these two timepoints: per-study protocol and intent-to-treat analyses. Both analyses were based on data provided in text, tables or figures in the original publications. Table 4 shows summary unweighted mean sputum conversion proportions stratified by therapy regimens. The unweighted mean sputum conversion proportions after 6 months of therapy was 0.64 ± 0.13 with the macrolide-containing regimen and 0.83 ± 0.41 with the macrolide-free regimens, using per-protocol analyses. For the intent-to-treat analyses, the unweighted mean sputum conversion was 0.53 ± 0.14 and 0.32 ± 0.44, respectively. Total patients enrolled and available for intent-to-treat analysis for the 6 month outcome was 620, while the per-protocol sample comprised 466 (75%) patients for macrolide-containing regimens. For the end of therapy, the total patient numbers enrolled for end-of-treatment analysis were 1698 for the intent-to-treat and 1564 (92%) for the per-protocol analyses. Eight studies of 590 patients examined microbiological outcomes of 11 separate regimens on follow-up after stopping therapy. The unweighted mean sustained sputum conversion was 0.55 ± 0.11 for the per-protocol analysis. Sputum conversion rates based on intent-to-treat analyses are shown in Table 4. The sample sizes were sufficiently large to examine heterogeneity of treatment effect.
Unweighted sputum culture conversion ratios after 6 months of therapy, at designated end of therapy and after stopping therapy on follow-up
| Sputum culture conversion | ||||||
|---|---|---|---|---|---|---|
| 6 months of therapy | end of treatment | on follow-upa | ||||
| Analysis | regimens analysed | mean ± SD | regimens analysed | mean ± SD | regimens analysed | mean ± SD |
| Macrolide-containing regimens | ||||||
| per-protocol | 11 | 0.64±0.13 | 22 | 0.63±0.18 | 8 | 0.55±0.11 |
| intent-to-treat | 11 | 0.53±0.14 | 22 | 0.56±0.16 | NA | |
| Macrolide-free regimens | ||||||
| per-protocol | 1 | 0.83±0.41 | 3 | 0.53±0.35 | 8 | 0.44±0.20 |
| intent-to-treat | 1 | 0.32±0.44 | 3 | 0.33±0.09 | NA | |
NA, data not available.
After stopping treatment (sustained sputum culture conversion).
Incidence ratios for microbiological outcomes at 6 months
Heterogeneity between all macrolide-containing regimens was substantial and statistically significant for the 6 month sputum conversion outcome: I2 = 56%, P = 0.01. This was driven by variations in study quality in the clarithromycin regimens. However, the size of the effect was not significantly different between the two macrolides, as shown in the Forest plot in Figure 3. The RR comparing the two macrolides was 1.03 (95% CI 0.86–1.24), P = 0.796, which confirmed the random effects meta-analysis findings. The pooled sputum conversion was 0.65 (95% CI 0.58–0.72) based on random effects models.
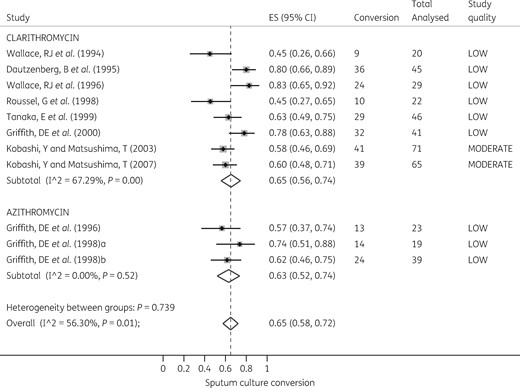
Forest plot for sputum conversion at 6 months. The forest plot shows sputum culture conversion at 6 months of therapy with azithromycin- and clarithromycin-containing regimens. (Macrolide-free regimens were excluded as there was only one such regimen examined.)
Next, we computed the RR of macrolide-free regimens versus macrolide-containing regimens. There were 38/46 (83%) sputum conversions in the macrolide-free regimens compared with 140/203 (69%) in the macrolide-containing regimens, based on a per-protocol analysis. The RR was 1.22 (95% CI 1.05–1.43) in favour of macrolide-free regimens (P = 0.044). This means that the number needed to be treated to benefit one patient was 7.33 (95% CI 3.57–141). However, on intent-to-treat analysis, sputum conversion in the macrolide-free regimen was 38/120 (32%) versus 191/356 (54%) in the macrolide-containing regimen. This translated to an RR of 0.59 (95% CI 0.45–0.78) in favour of macrolide-containing regimens (P < 0.001). The number needed to be treated was 4.55 (95% CI 3.11–8.45) with the intent-to-treat analysis.
End of treatment outcomes
With regards to sputum conversion at the end of treatment, the heterogeneity effect across therapy regimens ranged from substantial to considerable: I2 = 86%–97%, P < 0.010. The Forest plots for both macrolide-containing and macrolide-free regimens are shown in Figure 4, which demonstrates that the heterogeneity of effect was also driven by a variation in study quality. The exception was with the azithromycin-containing regimens, the study quality of which was rated as moderate for all four regimens: I2 = 6.12%, P = 0.38. Nevertheless, there was no difference in effect between the two macrolides for sputum conversion at the end of treatment (RR = 0.94; 95% CI 0.82–1.09).
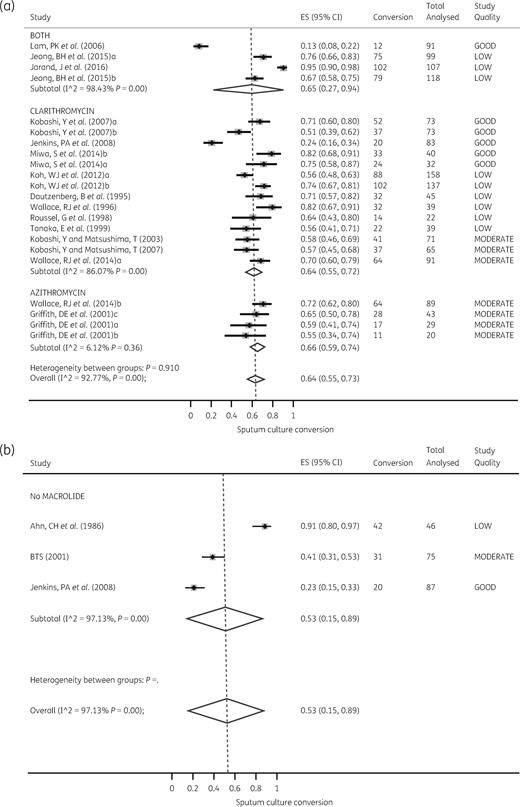
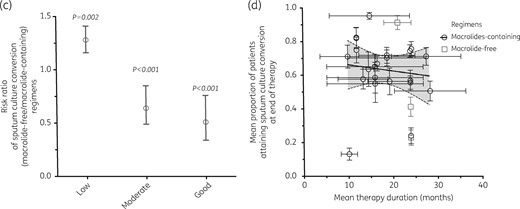
Forest plots for sputum conversion at the end of therapy. Comparisons of sputum conversion rates in macrolide-containing and macrolide-free regimens are shown, as well as the effect of study quality. (a) Despite significant heterogeneity of effect across azithromycin- and clarithromycin-containing regimens, there was no significant difference in sputum conversion between the two regimens. (b) The three macrolide-free regimens were heterogeneous because of different study quality scores. (c) Relative risk for sputum conversion with macrolide-free compared with macrolide-containing regimens stratified by study quality. As study quality improved from low to good, sputum conversion increased in macrolide-containing regimens compared with macrolide-free regimens. (d) Scatter plot of sputum conversion versus therapy duration fitted to a statistically significant fractional regression line, showing that as therapy duration was prolonged beyond 12 months, sputum conversion decreased significantly.
Figure 4(c) shows that none of macrolide-containing regimens was associated with significantly lower sputum conversion rates, particularly in the better-quality studies [RR = 0.51 (95% CI 0.34–0.76), P < 0.001]. The number needed to treat was 4.46 (95% CI 2.97–8.96). The pattern was the same in the intent-to-treat analysis.
Figure 4(d) shows the effect of prolonging therapy on sputum conversion rates, accounting for variation in study quality, using meta-regression. Sputum conversion consistently declined with prolonged therapy duration (P = 0.034) as well as with improvement in study quality (P < 0.005). The marginal decrease in sputum conversion for each 1% increase in therapy duration was 22% (95% CI 1%–44%).
Outcomes on follow-up (sustained sputum conversion)
Heterogeneity for sustained sputum conversion for macrolide-containing regimens was an I2 = 70% (P < 0.001), which was substantial. For macrolide-free regimens, I2 = 63% (P = 0.070), which was substantial, but did not attain statistical significance. The RR for the macrolide-containing regimens versus macrolide-free regimens was 0.92 (95% CI 0.72–1.17), showing equal efficacy for sustained sputum conversion. Forest plots for both macrolide-free and macrolide-containing regimens are depicted in Figure 5. However, Figure 5(c) shows a waning effect for the sustained sputum conversion outcomes with good-quality studies. The RR for macrolide-free versus macrolide-containing regimen in good-quality studies was 0.72 (95% CI 0.52–1.01), P = 0.047. The number needed to treat to show benefit was 7.58 (95% CI 3.87–192).
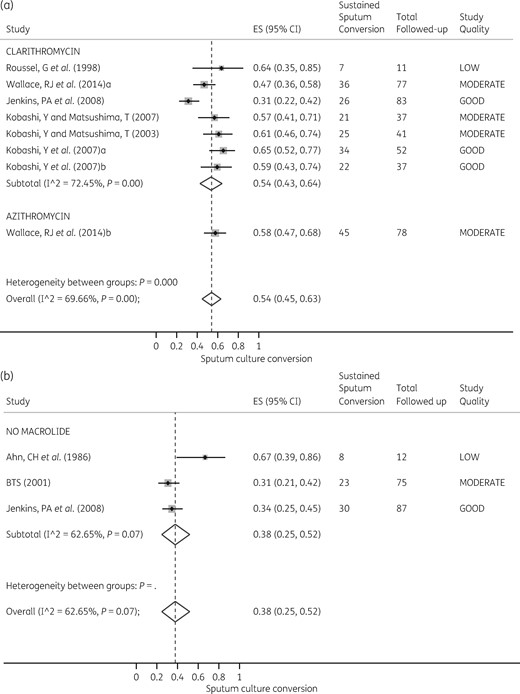
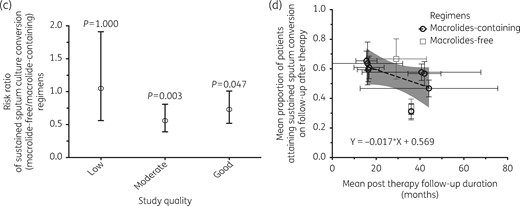
Plots for sustained sputum conversion on follow-up after end of therapy. (a) Despite significant heterogeneity of effect across azithromycin- and clarithromycin-containing regimens, there was no significant difference in sustained sputum conversion between the two drugs in random-effects analysis. (b) The three macrolide-free regimens were heterogeneous because the variation in study quality. (c) The relative risk for sustained sputum conversion with macrolide-free compared with macrolide-containing regimen stratified by study quality. As study quality improved from low to good, sputum conversion increased in macrolide-containing regimens compared with macrolide-free regimens. (d) Scatter plot of sputum conversion versus follow-up duration fitted with a fractional regression line, showing that sustained sputum conversion significantly declined with longer follow-up.
Since follow-up duration was variable between studies we examined its impact using meta-regression, with scatter plots shown in Figure 5(d). The mean follow-up was 29.90 ± 1.52 months. The marginal decrease in sustained sputum conversion with each 1% increase in monthly follow-up was 20% (95% CI 8%–33%).
Acquired macrolide resistance outcome
Acquired drug resistance (ADR) to macrolides could be adequately assessed in 17 regimens from 11 studies. All studies used clarithromycin for susceptibility testing, with a critical concentration of ≤ 8 mg/L defining susceptibility and ≥32 mg/L defining resistance in 6/11 (55%) studies. Heterogeneity for ADR was an I2 = 73% (P < 0.010) for both clarithromycin and azithromycin, which is substantial. The Forest plot shown in Figure 6(a) shows that ADR was not significantly different between the three patient groups: 20/403 (4.98%) for patients who received clarithromycin versus 4/181 (2.21%) for patients who received azithromycin versus 14/415 (3.37%) for patients who received both macrolides, P = 0.226.
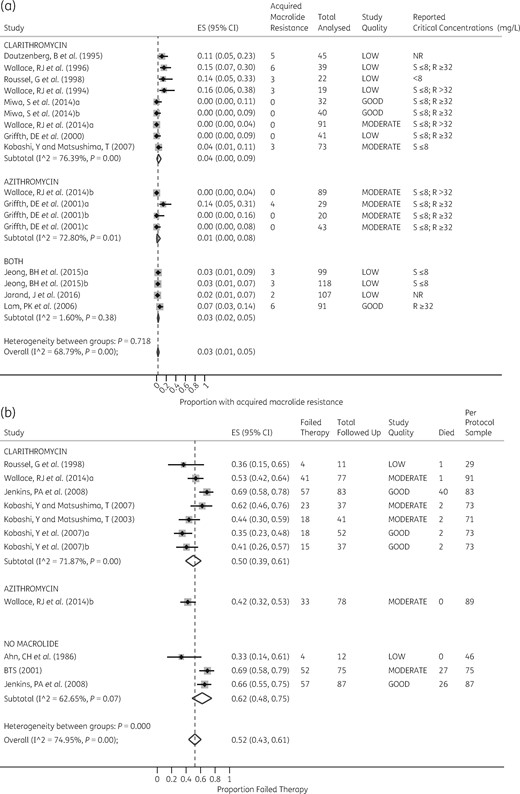
Forest plots of acquired macrolide resistance at the end of treatment and failure of therapy on follow-up. (a) The Forest plot shows the proportions of patients with acquired macrolide drug resistance at the end of therapy. The critical concentrations used to define susceptibility and resistance by each study as well as the study quality are shown in columns on the right side of the plots. (b) The Forest plot shows the proportions of patients who failed therapy on follow-up after completing therapy. The columns on the right side of the plots depict the number of patients who died in each study and the per-protocol patients analysed in that study. As shown, 50/493 (10%) patients who received clarithromycin, 0/89 (0%) who received azithromycin and 53/208 (25%) who received neither macrolide, died, P < 0.001.
Failed therapy outcome
Finally, we estimated the proportion of patients who failed therapy, including those who had died in each study at the ‘test-of-cure visit’ on follow-up after stopping therapy. Heterogeneity for ADR was substantial with an I2 = 75% (P < 0.001). Figure 6(b) also shows that the number and proportion of patients who died in each study were significantly higher with macrolide-free regimens than with any of the macrolide-containing regimens (P < 0.001). In good-quality studies, 26/87 (30%) patients in macrolide-free regimens compared with 44/229 (19%) patients in macrolide-containing regimen failed therapy (P = 0.049).
Discussion
There are several findings in our analyses. First, and likely underpinning the quality of studies and the problems we encountered in the meta-analyses, the difficult conditions in which researchers have worked should be noted. This is demonstrated by the striking finding of poor levels of support by public funding agencies for P-MAC therapy studies, based on a score to quantify public funding that we first propose here. This could explain, in part, the slow progress in the improvement of diagnosis and treatment of P-MAC: over the decades only ∼2500 patients were identified for intent-to-treat analyses and ∼2000 for per-protocol treatments. Moreover, given that local institutions funded these small studies, it is not a surprise that definitions of outcomes varied greatly by locality. Why is this? One main reason may be that P-MAC is viewed as the ‘other’ less-dangerous sibling to tuberculosis. We argue for increased funding for tuberculosis research, which is currently woefully underfunded. In the same breath, however, more public funding for P-MAC is also urgently required. Perhaps one way to change perception would be to abandon the moniker ‘non-tuberculous mycobacteria’ and simply call entities such as MAC directly by name. Calling a lion a ‘non-elephant animal’ has the effect of concealing how dangerous that predator is, giving the happy impression that we should be thankful that at least it is not an elephant.
Secondly, the quality score was poor in 52% of studies. Thus, the evidence base for the current treatment recommendations is poor. This is not to say that no recommendations should have been made, but simply to say that we should bear in mind that the evidence base for them is not strong. Moreover, even when quality of study was taken into account, the incidence ratio for sustained sputum conversion was low. However, the norm is to prolong therapy for at least a year, as exemplified by the median duration of therapy of 18–23 months: sustained sputum conversion was only 22%. The number needed to treat was about eight patients, which is hardly inspiring. The bottom line is that we still have failing regimens and have to treat many patients to achieve a single success. Our study updates previous systematic reviews6,7,36 by adding more recent studies, and improves on the precision of effect estimates by using subgrouping with intent-to-treat analytic approaches.
Why are there such poor success rates with currently recommended therapy? The precise reasons are unclear; however, our preclinical pharmacokinetics/pharmacodynamics model results suggest several possibilities. First, the standard regimen contains drugs of limited efficacy as monotherapy, dual therapy and even triple therapy.40–45 Secondly, the microbial killing achieved by the recommended regimens is often terminated by ADR.43 Thirdly, it has been shown that the ability of MAC to form a biofilm is associated with invasiveness of the bronchial epithelium.46 Bacteria within a biofilm may be in an altered physiological state associated with persistence and an increased tolerance to standard antibiotics. Each of these three possibilities can be overcome by selecting different antibiotics to treat P-MAC, and pharmacokinetics/pharmacodynamics optimization of drug combinations.
Finally, experience has taught us the difficulty in putting all the P-MAC evidence together, as compared with other chronic pneumonias.47–49 Problems encountered included different definitions of microbiological outcome and sputum conversion, different durations of therapy and inconsistent follow-up definitions employed. There is a need for P-MAC researchers and clinicians to reach a consensus on definitions of outcome as well as other study definitions, and then utilize these in adequately powered randomized controlled trials. In addition, there is also a need to find better biomarkers of P-MAC that would allow for better follow-up, quantification of outcome and proper time-to-event analyses. Finally, we observed a discrepancy between microbial failure and ADR, which likely reflects that the breakpoints currently used to define resistance are wrong and should be updated.13,42,50–56
Our study has its own limitations. First, systematic errors in original studies can be carried forward in pooled meta-analyses studies.19 We identified and highlighted some of that bias as well as other confounding factors in our analyses, including inconsistencies in the definition of clinical endpoints in some studies which precluded the further analysis of any relationship between therapy and microbiological response or sustained microbiological cure. Specifically, patients for whom criteria for diagnosis was via bronchoscopy rarely underwent the serial repeated tests needed to confirm culture conversion. Second, the focus on microbiological outcomes ignores other important clinical outcomes, including radiological response, symptomatic relief and quality-of-life measures. Third, most studies mixed treatment-naive patients with previously treated patients; other studies modified or switched patients’ regimens. Therapy duration was variable, while in some instances the therapy duration was not stated in the report. This and other sources of heterogeneity could significantly bias more objective comparison of post-treatment P-MAC recurrence rates, death rates and failure rates between studies. However, we emphasize this as one of the main findings of the meta-analyses: the poor quality and heterogeneity simply emphasize our point that current guidelines are based on less than optimal evidence.
Funding
This study was supported by the Baylor Research Institute, Baylor University Medical Center.
Transparency declarations
None to declare.
This article forms part of a supplement sponsored by the Baylor Research Institute.
Supplementary data
Table S1 is available as Supplementary data at JAC Online.
