


Abstract
The Patient Assessment of Chronic Illness Care (PACIC) was created to assess whether provided care is congruent with the Chronic Care Model, according to patients. We aimed to identify all studies using the PACIC in diabetic patients to explore (i) how overall PACIC scores varied across studies and (ii) whether scores varied according to healthcare delivery, patient and instrument characteristics.
MEDLINE, Embase, PsycINFO, CINAHL and PubMed Central (PMC), from 2005 to 2016.
Studies of any design using the PACIC in diabetic patients.
We extracted data on healthcare delivery, patient, and instrument characteristics, and overall PACIC score and standard deviation. We performed random-effects meta-analyses and meta-regressions.
We identified 34 studies including 25 942 patients from 13 countries, mostly in North America and Europe, using different versions of the PACIC in 11 languages. The overall PACIC score fluctuated between 1.7 and 4.2, with a pooled score of 3.0 (95% confidence interval 2.8–3.2, 95% predictive interval 1.9–4.2), with very high heterogeneity (I2 = 99%). The PACIC variance was not explained by healthcare delivery or patient characteristics, but by the number of points on the response scale (5 vs. 11) and the continent (Asia vs. others).
The PACIC is a widely used instrument, but the direct comparison of PACIC scores between studies should be performed with caution as studies may employ different versions and the influence of cultural norms and language on the PACIC score remains unknown.
Introduction
The Chronic Care Model is a widely used evidence-based framework developed to guide healthcare systems for the delivery of high-quality care for patients with chronic diseases [1]. The Patient Assessment of Chronic Illness Care (PACIC) instrument assesses whether care is congruent with the Chronic Care Model, according to patients [2]. In a context of increasing attention towards program evaluation and the consideration of patient-reported outcomes and experiences measures (PROMS [3, 4] and PREMS [5]), the PACIC is increasingly used in clinical studies and evaluations of healthcare services and has been described as ‘the most appropriate instrument to measure the experience of people receiving integrated chronic care’ in a review of 31 instruments published in 2009 [6].
Up to now, studies using the PACIC have shown mixed results regarding the association of the overall score and healthcare delivery and patient characteristics. Some studies have shown that PACIC scores improved after implementation of interventions aimed to improve chronic care delivery [7, 8] while other studies reported no improvement or lower PACIC scores [9, 10]. Studies have also reported opposing findings regarding the impact of socio-demographic characteristics, such as gender and age [2, 11, 12].
To our knowledge, the systematic exploration of the PACIC use and scores across studies has not yet been performed. In that context, the aims of this study were to systematically identify all studies using the PACIC instrument to explore the variation of overall PACIC scores across studies, and according to: (i) healthcare delivery characteristics, (ii) patient characteristics and (iii) instrument characteristics. We hypothesized that the variance of the overall PACIC scores would be mainly explained by the type of care patients received (i.e. patients receiving integrated care would have higher PACIC scores compared with patients receiving usual care). We chose to focus on PACIC scores in diabetic populations as the instrument has been validated and widely used in this population [13].
Methods
Data sources
We performed a systematic search of four indexed databases (Ovid MEDLINE, Ovid Embase, Ovid PsycINFO, CINAHL) and PubMed Central (PMC), without language restrictions, between January 2005, year of the first PACIC validation study, and October 2016. We used MeSH and free text words for the two main concepts, ‘PACIC’ and ‘diabetes’ (Supplementary material 1).
Study selection
Studies including patients diagnosed with type 1 or type 2 diabetes, receiving any type of care in any setting, and considering the PACIC instrument (the 11-, 20- or 26-item version [2, 13, 14]), were eligible for inclusion. Since we focused our interest on mean PACIC scores and their variations, any type of observational study (e.g. cross-sectional (XS), cohort) or interventional study (e.g. randomized-controlled trial (RCT), controlled before–after study (CBA) and before–after study (BA)) were considered. We excluded studies including patients with multiple chronic diseases if they did not present subgroup results for patients with diabetes. Studies were also excluded if only one item or dimension of the PACIC was measured or if a modified version of the PACIC was used.
After a first title and abstract screening, the full text of primary studies were evaluated by two authors (CA and IPB), working independently and in duplicate, to determine whether they met the eligibility criteria.
Primary outcome and effect modifiers
Our primary outcome was the overall PACIC score. The PACIC is a 20-item instrument measuring the extent to which patients report having received specific actions and care that are congruent with various aspects of the Chronic Care Model [2]. The original questionnaire was developed in English and has been translated and tested in many languages. Each item is scored on a 5-point scale, ranging from 1 to 5, and the overall PACIC is scored by averaging scores across all 20 items. The anchors of the 5-point scale are ‘never/always’ or ‘almost never/almost always’. Two other versions have been validated: a 26-item version called PACIC-5As [13] and an 11-item short version [14], with an 11-point scale ranging from ‘none (0)’ to ‘always (100)’.
We pre-defined the following effect modifiers: (a) healthcare delivery characteristics: setting (community, primary care practices, hospital or diabetes clinics, or mixed), usual care or integrated care (e.g. managed care, disease management program), healthcare professionals involved in patient care (general practitioners, others professionals (e.g. specialists, nurses, dietitians)); (b) patient characteristics: age (mean age, dichotomized at the study level as under or above 65), gender (percentage of men, dichotomized at the study level as under or above 50%) and type of diabetes (dichotomized at the study level as type 2 or any type); (c) study characteristics: country (categorized into continents and dichotomized into high-income economy versus others [15]), study quality (strong, moderate or weak) [16, 17] and (d) PACIC characteristics: number of items, language, anchors of the response scale (‘never’ vs. ‘almost never’), and response scale (5-point vs. 11-point).
Data extraction
We extracted, independently and in duplicate, the overall PACIC score and standard deviation (SD) as well as the above characteristics. We contacted authors of 20 primary studies to obtain missing data; 14 replied and ten sent additional data. Missing SDs were replaced by the median SD of the other studies.
Study quality
We assessed the overall quality of the studies as strong, moderate or weak, based on the assessment of the risk of bias measured with a modified version of the Effective Public Health Practice Project quality assessment tool [16, 17] (Supplementary material 2). The quality of the studies was assessed globally, even if we only considered baseline data in this review.
Data management and synthesis
In studies with more than one study group, we considered the data separately if groups received different types of care (usual care vs. integrated care) or if the settings were different, and combined the data if groups received the same type of care in the same setting, using the formula presented in the section 7.7.3.8 of the Cochrane Handbook for Systematic Reviews of Interventions [18]. For studies with before and after data (RCTs, CBAs, BAs), only baseline data were considered. If authors did not use the 5-point response scale for the PACIC score, we cross-multiplied the score to match the 5-point scale score. As most studies using the 26-item version provided the overall PACIC score (calculated on the same 20 items of the original instrument), we combined the studies using either questionnaire in the same analyses and investigated the impact of the study presenting the 5 A summary score (calculated on 15 of the original items) [19] in sensitivity analyses. We analyzed separately the overall score calculated with the 11-item version.
First, random-effects meta-analyses were performed to obtain the pooled mean overall PACIC score, the 95% confidence interval (CI), the 95% prediction interval (PI) [20], and the I2, measuring the level of heterogeneity between studies. We performed sensitivity analyses excluding studies of weak quality. Second, we conducted subgroup analyses and univariate meta-regressions to explore heterogeneity and identify healthcare delivery, patient, and PACIC characteristics possibly associated with overall PACIC scores and explaining variance between studies (adjusted R2 in univariate meta-regression). Third, we conducted multivariate meta-regressions, building a model with the forward selection approach using the adjusted R2 as criterion for variable selection and retention.
Results
Results of our search strategy are presented in Fig. 1; we included 32 studies [8–10, 12, 13, 19, 21–46] and 34 studies in the quantitative and qualitative synthesis of this review, respectively (two studies [47, 48] did not report overall PACIC scores). In addition, we identified three ongoing studies [49–51] and two studies without published results [52–54], presented in Supplementary material 4.
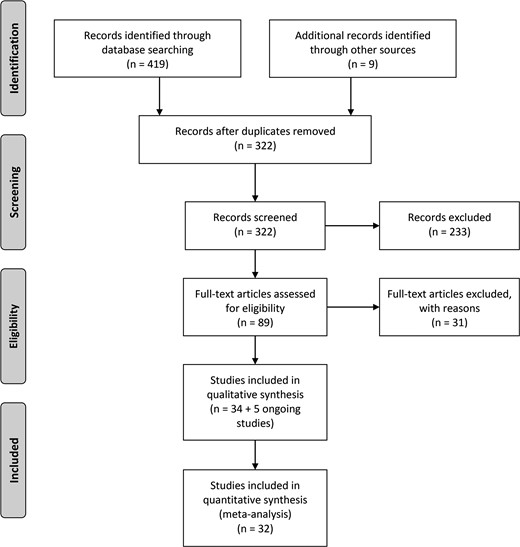
PRISMA flow diagram.
Qualitative synthesis
Details of the included studies are presented in Supplementary material 3.
Study characteristics
Most studies were XS studies (n = 22); six studies were RCTs, four studies were BAs and two studies were CBAs. The included studies were conducted in 13 different countries, mostly in North America (n = 16) and in Europe (n = 10); five studies [26–28, 32, 47] were conducted in low- and middle-income economies.
Healthcare delivery characteristics
The healthcare setting was primary care practices (n = 18), hospital outpatient clinics (n = 3), the community (n = 2), diabetes clinics (n = 1), and a mix of settings (n = 9). General practitioners were the main providers of care in 11 studies, while GPs and/or other healthcare professionals provided care in 12 studies, the type of providers being unclear in the remaining studies. At baseline, all patients were receiving usual care in 20 studies and integrated care in six studies [12, 33, 36, 37, 44, 47]; in seven studies [9, 21, 27, 29–31, 34], some patients were receiving usual while the others were receiving integrated care.
Patient characteristics
Studies included between 40 and 3761 patients (576.5 on average and 25 942 in total), of a mean age varying between 54 and 75.8 years (mean age <65 in 40% of study groups). The percentage of male patients ranged between 21% and 98% (percentage men < 50% in 48% of study groups), and patients were diagnosed with type 2 diabetes in the majority of studies (n = 27).
PACIC characteristics
Studies used mainly the 20-item version (n = 24); five studies [13, 19, 29, 33, 36] used the 26-item version, three studies [14, 44, 45] used the 11-item version, and two studies did not specify the version [30, 48]. While the majority of studies utilized the 5-point response scale, ranging from 1 to 5 (n = 29), the three studies using the 11-item version and two other studies [35, 40] utilized an 11-point response scale, ranging from 0 to 100. Among studies reporting the anchors, ten studies employed ‘never/always’ whereas 11 studies employed ‘almost never/almost always’.
The questionnaire was provided to patients in 11 different languages: in English in 11 studies, in German [8, 29, 34], Dutch [10, 33, 37] and Spanish [12, 35, 40] in three studies each, in Cantonese in two studies [35, 40], and in Danish [22], French [25], Italian [45], Mandarin [21], Thai [27] and Turkish [32] in one study each.
Study quality
Overall, the quality of studies was rated as moderate for three quarters of the studies (n = 24); eight studies were rated as weak, one study as strong, and one study as unknown (Table 1).
Quality assessment per domain and overall, per study
| Study | Selection bias | Study design | Confounders | Blinding | Missing data | Overalla |
|---|---|---|---|---|---|---|
| Aragones [12] | Moderate | Weak | N/A | N/A | Moderate | Moderate |
| Aung [38] | Weak | Moderate | N/A | N/A | Strong | Moderate |
| Chiu [21] | Moderate | Weak | Strong | Moderate | Strong | Moderate |
| Dede [32] | Unknown | Weak | N/A | N/A | Unknown | Unknown |
| Drewes [33] | Moderate | Weak | N/A | N/A | Strong | Moderate |
| Fan [24] | Moderate | Weak | N/A | N/A | Weak | Weak |
| Frei [8] | Moderate | Weak | Strong | Moderate | Moderate | Moderate |
| Frei [29] | Weak | Strong | Strong | Weak | Strong | Weak |
| Glasgow [30] | Moderate | Strong | Weak | Moderate | Strong | Moderate |
| Glasgow [13] | Moderate | Weak | N/A | N/A | Moderate | Moderate |
| Gugiu [46] | Moderate | Weak | N/A | N/A | Moderate | Moderate |
| Jackson [43] | Strong | Weak | N/A | N/A | Strong | Moderate |
| Jiamjarasrangsi [27] | Moderate | Weak | Strong | Moderate | Moderate | Moderate |
| Johnson [44] | Weak | Strong | Strong | Strong | Moderate | Moderate |
| Ko [41] | Weak | Moderate | Weak | Moderate | Moderate | Weak |
| Ku [26] | Moderate | Moderate | N/A | N/A | Strong | Moderate |
| Ku [28] | Moderate | Weak | Strong | Weak | Strong | Weak |
| Kuznetsov [9] | Moderate | Strong | Weak | Moderate | Weak | Weak |
| Lewis [39] | Moderate | Moderate | N/A | N/A | Weak | Moderate |
| Liu [47] | Strong | Weak | N/A | N/A | Strong | Moderate |
| Maindal [22] | Moderate | Weak | N/A | N/A | Strong | Moderate |
| Ose [34] | Moderate | Weak | Strong | Moderate | Strong | Moderate |
| Pemu [42] | Weak | Moderate | N/A | N/A | Strong | Moderate |
| Pintaudi [45] | Strong | Weak | N/A | N/A | Strong | Moderate |
| Ratanawangsa [40] | Weak | Strong | Strong | Moderate | Moderate | Moderate |
| Sansgiry [48] | Weak | Weak | N/A | N/A | Moderate | Weak |
| Schillinger [35] | Moderate | Strong | Strong | Moderate | Strong | Strong |
| Stock [31] | Weak | Weak | Strong | Moderate | Moderate | Weak |
| Thomas [19] | Weak | Weak | N/A | N/A | Moderate | Weak |
| Tsiachristas [10] | Moderate | Moderate | N/A | N/A | Moderate | Moderate |
| Wallace [36] | Strong | Weak | N/A | N/A | Strong | Moderate |
| Wensing [37] | Strong | Weak | N/A | N/A | Moderate | Moderate |
| Xue [23] | Weak | Strong | Strong | Moderate | Moderate | Moderate |
| Zuercher [25] | Moderate | Moderate | N/A | N/A | Strong | Moderate |
N/A: not applicable. aWe rated the domain ‘data collection method’ assessing validity and reliability of the data collection tool as strong for all studies based on the hypothesized validity and reliability of the PACIC questionnaire
Quantitative synthesis
Intervention and control groups of RCTs and CBAs were combined at baseline in all studies except one [30], while intervention and control groups of seven XS studies were considered separately, resulting in 43 study groups for the quantitative analyses.
Variation in PACIC scores and meta-analysis
Mean overall PACIC scores fluctuated between 1.7 (SD 0.4) and 4.2 (SD 5.2); eight study groups (19%) had an overall PACIC score lower than 2.5, whereas five study groups (12%) had an overall PACIC score higher than 3.5.
The random-effects meta-analysis including the 40 study groups using the 20- or 26-item version showed a pooled overall PACIC score of 3.0, at the center point of the scale (95% CI 2.8–3.2, 95% PI 1.9–4.2) (Fig. 2). The pooled overall PACIC score for the three studies using the 11-item version was 2.8 (95% CI 1.8–3.9, 95% PI -11.0–16.6) (Fig. 2). Heterogeneity was very high in both groups (I2=99.5%). In sensitivity analyses, removing studies of weak quality and the study presenting the 5 A summary score did not alter the results.
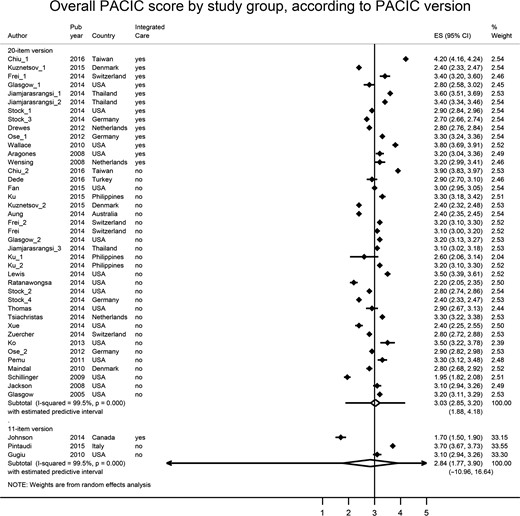
Forest-plot of overall PACIC score by study group, according to PACIC version.
Subgroup analyses and meta-regressions
In the subgroup analyses among studies using the 20- or 26-item version, differences in scores between subgroups varied between 0 and 1 (median: 0.3); heterogeneity remained very high in all subgroups (Table 2).
Subgroup analyses: pooled overall PACIC scores, heterogeneity, and explained variance, according to healthcare delivery, patient and PACIC characteristics
| Characteristics | Na | Pooled overall PACIC scores (95% CI) | Heterogeneity (%) | Explained varianceb |
|---|---|---|---|---|
| Healthcare delivery characteristics | ||||
| Integrated care | 13 | 3.2 (2.9–3.6) | 99.7 | 4.7% |
| Usual care | 27 | 2.9 (2.8–3.1) | 98.9 | |
| GP and/or other healthcare professionals | 12 | 3.2 (2.8–3.6) | 99.8 | 13.3% |
| GP only | 15 | 2.8 (2.6–2.9) | 98.3 | |
| PCP and/or other settings | 18 | 3.2 (2.9–3.5) | 98.6 | 8.9% |
| Primary care practices | 22 | 2.9 (2.8–3.0) | 99.6 | |
| Low- and middle-income economies | 7 | 3.2 (3.1–3.4) | 94.2 | 0% |
| High-income economies | 33 | 3.0 (2.8–3.2) | 99.6 | |
| Asia | 9 | 3. 4 (3.1–3.7) | 99.3 | 15.9% |
| Other continents | 31 | 2.9 (2.8–3.1) | 98.7 | |
| Patient characteristics | ||||
| Patients’ mean age >65 | 21 | 3.1 (2.8–3.4) | 99.6 | 1.9% |
| Patients’ mean age <65 | 16 | 2.9 (2.8–3.1) | 98.5 | |
| % of men >50% | 21 | 3.2 (2.9–3.4) | 99.4 | 6.6% |
| % of men <50% | 19 | 2.9 (2.8–3.0) | 98.3 | |
| Type 2 diabetes only | 33 | 3.1 (2.9–3.3) | 99.6 | 4.0% |
| Type 1 and/or type 2 diabetes | 4 | 2.7 (2.3–3.1) | 97.2 | |
| PACIC characteristics | ||||
| English | 9 | 3.0 (2.8–3.3) | 99.0 | −6.4% |
| German | 7 | 3.0 (2.7–3.3) | 98.9 | |
| Other | 14 | 3.1 (2.7–3.5) | 99.7 | |
| ‘Almost never’ to ‘almost always’ anchors | 16 | 3.2 (2.9–3.5) | 99.6 | 6.7% |
| ‘Never’ to ‘always’ anchors | 12 | 2.9 (2.7–3.1) | 98.6 | |
| 5-Point scale | 38 | 3.1 (2.9–3.3) | 99.5 | 20.0% |
| 11-Point scale | 2 | 2.1 (1.8–2.3) | 84.1 | |
GP: general practitioner, PCP: primary care practice, CI: confidence interval anumber of observations in each subgroup bAdjusted R2 in univariate meta-regression.
In univariate meta-regressions (Table 2), whereas the response scale (5- vs. 11-point) and the continent (Asia vs. other continents) were significantly associated with higher PACIC scores, having a GP as main provider (vs. a GP and/or other healthcare professionals) was significantly associated with lower PACIC scores. The final multivariate model included the response scale and the continent, explaining 33% of the variance and significantly predicting higher PACIC scores.
Removing the two studies using an 11-point response scale from the analyses altered the results of univariate meta-regressions: gender, type of anchors, continent, and age, explaining 20%, 18%, 16% and 11% of the variance, respectively, were significantly associated with higher PACIC scores. However, none of these variables remained significant when combined in a multivariate model.
Discussion
Our systematic review of the literature on the use of the PACIC instrument in patients with diabetes identified 34 studies using the PACIC, in 11 different languages in 13 countries, predominantly in North America and Western Europe. Studies were mainly conducted in primary care practices; two thirds of patients were receiving usual care, while one-third was receiving integrated care. The majority of studies employed the 20- or 26-item instrument and a 5-point response scale; while half adopted the ‘never/always’ anchors, the other half adopted the ‘almost never/almost always’ anchors. Mean overall PACIC scores fluctuated between 1.7 and 4.2, with a pooled overall score of 3.0, at the center of the scale. The heterogeneity of the scores was very high and remained high in all subgroup analyses.
Our main hypothesis, that patients receiving integrated care would have significantly higher scores, was not verified in the analyses. The two variables significantly predicting higher PACIC scores were an instrument characteristic, i.e. using a 5-point response scale (vs. an 11-point scale), and a study characteristic, i.e. taking place in Asia (vs. in other continents); the choice of anchors (‘never’ vs. ‘almost never’) also became a significant predictor when we excluded the two studies using the 11-point scale from the analyses. Having these two instrument characteristics as significant predictors is not surprising as the number of points on a scale and the type of anchors are essential elements in response style, where acquiescence (agreeing with items), extremity (favoring the extreme point) and moderation (favoring the midpoint) affect how individuals answer a Likert scale [55]. Consequently, interpreting the combined results of studies using different number of points on the response scale and different anchors requires caution as response styles might explain observed differences. In addition, previous studies have shown that response styles vary substantially between countries [55–57].
These issues add to the complexity of comparative research, where similarities and differences between population groups are investigated with self-reported instruments, requiring not only that the measured constructs have the same factorial structure (i.e. configural invariance), but also that the comparison of the means between groups are meaningful and defensible (i.e. strong and strict factorial invariance) [58]. The required strong factorial invariance, also called scalar invariance, is especially an issue in cross-national and cross-cultural comparisons as cultural norms and language are likely to influence rating tendency and yield different scores that do not reflect difference in care but rather differences in the way populations answer questions. Thus, the finding that patients in Asia tended to report higher PACIC scores on average compared with patients in other continents, could be due to differences in culture or language.
We found PACIC score differences between subgroups ranging between 0 and 1. If we look at the observed score differences in terms of effect size using Cohen’s effect size classification (0.2 = small, 0.5 = medium, 0.8 = large) [59], the impact of the number of points on the scale (5-point vs. 11-point) would represent a large effect, whereas the impact of the continent (Asia vs. other continents) would represent a medium effect. What such a score difference means, and whether these differences are meaningful to patients, remain unclear, however, requiring thus caution when interpreting PACIC results. In fact, up to now, no minimal important difference (MID), which provides a ‘measure of the smallest change in the patient-reported outcome of interest that patients perceive as important, either beneficial or harmful, and that would lead the patient or clinician to consider a change in management’ [60], has been defined for the PACIC instrument. Longitudinal studies have reported statistically significant changes in PACIC scores after the implementation of the Chronic Care Model (e.g. a mean change of 0.2 in a RCT [8] and mean change of 0.3 in a BA [26]), but whether these changes were clinically significant remains undetermined. To derive a MID for the PACIC, anchor-based and distribution-based approaches could be combined as suggested in the literature [61, 62], using meaningful patient experiences and outcomes measures as anchors. In addition, the interpretability of the PACIC, defined as the degree to which one can assign qualitative meaning to an instrument’s quantitative scores or change in scores [61], and its sensitivity to detect change, also need to be further thoroughly investigated.
The main strength of the study is that, to our knowledge, this systematic review is the first to have examined the use of the PACIC instrument worldwide and the variation of PACIC scores across studies, pooling evidence from 13 countries. However, the following two main limitations need to be considered when interpreting the results. First, the PACIC was neither created nor tested to make cross-national comparisons. This means that observed differences in scores between studies and countries may be due to cultural factors and nation-specific rating tendencies rather than to differences in chronic care received. Second, it was only possible to systematically extract a few characteristics that could then be used in the subgroup analyses. Other potential effect modifiers, such as health literacy [36] and number and type of comorbidities [2], which might explain differences and between study variance, were not available.
Even if the PACIC is a widely used instrument to assess care according to patients, the direct comparison of PACIC scores between studies should be performed with caution because studies may employ different versions of the instrument and it remains unknown how cultural factors affect its overall score. We encourage future research to investigate the appropriateness of using the PACIC instrument to compare chronic care across groups and countries, and to determine the MID to help interpreting the clinical significance of observed differences.
Acknowledgements
We thank Elisa Gijs and Mauro Mayer for their contribution to the literature search and first version of the evidence table in the early stage of the review, and Emilie Zuercher for her contribution to the assessment of study quality.
References
https://datahelpdesk.worldbank.org/knowledgebase/articles/906519#High_income Accessed [February 15,
