


Abstract
The E3N (Etude Epidémiologique auprès de femmes de la Mutuelle Générale de l'Education Nationale) cohort was initiated in 1990 to investigate therisk factors associated with cancer and other major non-communicable diseases in women. The participants were insured through a national health system that primarily covered teachers, and were enrolled from 1990 after returning baseline self-administered questionnaires and providing informed consent. The cohort comprised nearly 100 000 women with baseline ages ranging from 40 to 65 years. Follow-up questionnaires were sent approximately every 2–3 years after the baseline and addressed general and lifestyle characteristics together with medical events (cancer, cardiovascular diseases, diabetes, depression, fractures and asthma, among others). The follow-up questionnaire response rate remained stable at approximately 80%. A biological material bank was generated and included blood samples collected from 25 000 women and saliva samples from an additional 47 000 women. Ageing among the E3N cohort provided the opportunity to investigate factors related to age-related diseases and conditions as well as disease survival. The new E4N complementary cohort (Epidemiology 4 kNowledge), which comprises the children and grandchildren of the E3N cohort as well as the children’s fathers, will allow researchers to investigate key life periods during which exposures to environmental factors most strongly influence the later disease risk. The E3N and E4N cohort data will be used to investigate diseases and risk factors through a transgenerational approach. Requests for collaborations are welcome, particularly those in conjunction with rare diseases.
E3N has increased the available knowledge regarding the benefit-risk balances of the specific menopausal hormone therapies used in France and has led to considerable changes in menopausal treatment prescription habits.
The E3N cohort was characterized by a large proportion of lean women and has produced a spectrum of results regarding the association between the risk of major chronic diseases and anthropometric characteristics at various life stages.
Furthermore, E3N has provided evidence regarding the influences of dietary habits on the risks of cancer development at various sites, of diabetes and of asthma in middle-aged women.
Why was the cohort set up?
Experimental, ecological and epidemiological studies have clearly indicated that nutrition and lifestyle can account for manifold variations in the incidences of numerous diseases. Endogenous hormones have been studied extensively, primarily through analyses of reproductive factors, and the use of exogenous hormones such as contraceptive pills, hormone replacement therapies or infertility treatments has been shown to affect the risks of several types of cancers and cardiovascular diseases. However, it remains unknown whether environmental factors also play a role either alone or through interactions with genes.
Until the early 1990s, the vast majority of the literature regarding dietary habits or hormone use and cancer was derived from case-control studies. However, cohort studies of healthy participants were considered preferable because the prospective design allowed the avoidance of numerous biases due to the use of retrospective records and the collection of biological samples, thus making it possible to use measurements of various biomarkers and genetic variants to substantially improve our understandings of diseases.
In an attempt to overcome the limitations of the traditional case-control study design, in 1990 we developed the E3N (Etude Epidémiologique auprès de femmes de la Mutuelle Générale de l'Education Nationale) prospective cohort, the largest epidemiological study ever initiated in France, with the aim of generating a large dataset that would facilitate the identification of the environmental causes of cancer and other chronic diseases and would contribute to the development of effective public health strategies. Although the research interests of our GustaveRoussy-based team (a leading cancer centre in Europe) are focused on cancer, we expanded the E3N cohort’s objectives to other outcomes, given the low marginal costs of studying other health endpoints. Moreover, several questions pertaining to French-specific issues such as dietary habits, some hormonal treatments and alcohol consumption needed to be addressed.
The design of the E3N cohort study allowed us to explore the interactions between nutritional, hormonal, lifestyle and genetic factors. Our team addressed several lines of research. First, the associations between major chronic diseases (particularly cancer) and lifestyle and metabolic factors (including diet, overweight, physical activity, hormonal treatment use, reproductive factors and early-life exposure) were investigated. Second, data recorded in the questionnaires were linked with analytical data from biological specimens to assess the relationships between chronic diseases and several biomarkers (including dietary and hormonal milieu markers and genetic polymorphisms). Third, the interactions between these potential risk factors and genetic characteristics were studied using extracted DNA from the collected blood and saliva samples. Finally, linkages with the drug reimbursement files from the health insurance plan that covered all women in the cohort enabled the performance of pharmacoepidemiological studies.
In 1993, a portion of the E3N cohort (women who had answered the dietary questionnaire; n = 74 529) was included in the European Prospective Investigation on Cancer (EPIC), a collaborative study of >500 000 participants in 10 countries that was coordinated by the International Agency for Research on Cancer (IARC, Lyon, France).
An Inserm-Paris South University 35-member research team is currently located at the IGR (Institut Gustave-Roussy) cancer centre and works to maintain, manage and analyse the E3N data. The E3N cohort receives support from four major partners (Institut Gustave Roussy, Inserm, Ligue Nationale contre le Cancer and Mutuelle Générale de l’Education Nationale) and from the European Union through its participation in EPIC. Funding and acknowledgements are detailed at the end of the paper.
All participants signed informed consent in compliance with the rules of the French National Commission for Computed Data and Individual Freedom (Commission Nationale Informatique et Libertés), from which we obtained approval. Moreover, we obtained ethical clearance from our Institutional Review Board for the use of biospecimens (blood fractions and extracted DNA from blood or saliva).
Who is in the cohort?
In June 1990, a questionnaire was sent to 500 000 women who had been born between 1925 and 1950 and were insured by the Mutuelle Générale de l'Education Nationale (MGEN), a national health insurance plan that primarily covers teachers. The questionnaire was sent along with a leaflet explaining that an Inserm research team was launching a study of cancer risk factors and that participation would require filling in questionnaires every 2–3 years as well as the submission of a signed consent form providing permission to obtain information about each participant's vital status, address changes and medical expense reimbursements from the insurance plan. Nearly 100 000 women volunteered; their characteristics are described in Table 1. A comparison of the respondents and non-respondents revealed a high level of similarity between the two groups (Table 2).
Characteristics of the E3N cohort participants (n = 98 995)
| Characteristics | Mean |
|---|---|
| Age at baseline, years | 49.4 (+/− 6.7) |
| Percentages | |
| Education level, years | |
| • <12 | 13.5 |
| • 12–14 | 47.7 |
| • ≥15 | 34.5 |
| • Missing | 4.3 |
| Body mass index, kg/m2 | |
| • <18.5 | 4.3 |
| • 18.5–22.5 | 51.5 |
| • 22.5–25 | 24.6 |
| • 25–30 | 14.2 |
| • ≥30 | 2.3 |
| • Missing | 3.1 |
| Hip circumference,a cm | |
| • Mean | 97.0 (+/− 8.4) |
| • <93 | 29.8 |
| • 93–100 | 42.0 |
| • ≥100 | 24.4 |
| • Missing | 3.8 |
| Waist circumference,a cm | |
| • Mean | 76.1 (+/−9.0) |
| • <80 | 66.9 |
| • ≥80 | 29.4 |
| • Missing | 3.7 |
| Parity | |
| • 0 | 12.2 |
| • 1–2 | 58.0 |
| • ≥3 | 29.0 |
| • Missing | 0.8 |
| Age at first birth,b years | |
| • <22 | 18.9 |
| • 22–24 | 22.0 |
| • 24–27 | 30.1 |
| • ≥27 | 28.5 |
| • Missing | 0.5 |
| Postmenopausal at baseline, % | 41.1 |
| Any history of MHT use, % | 63.2 |
| Smoking status | |
| • Non-smoker | 53.7 |
| • Former smoker | 30.4 |
| • Current smoker | 14.9 |
| • Missing | 1.0 |
| Walking, m/day | |
| • 0 | 2.8 |
| • 0–500 | 34.4 |
| • 500–2000 | 48.7 |
| • ≥2000 | 12.7 |
| • Missing | 1.4 |
| Alcohol intake,c g/day | |
| • 0 | 12.0 |
| • <5 | 29.7 |
| • 5–10 | 16.8 |
| • 10–20 | 20.1 |
| • 20–30 | 10.1 |
| • ≥30 | 9.3 |
| • Missing | 2.0 |
aAmong responders to the fourth questionnaire.
bAmong parous women.
cAmong responders to the third questionnaire.
Comparisons (percentages) between responders and non-responders
| Characteristics | At first questionnaire | Since first questionnaire (Q1–10) | ||
|---|---|---|---|---|
| Responders n = 98 995 | Non-responders n = 399 304 | Not lost to follow-up n = 46 600 | Lost to follow-up n = 3160e | |
| Year of birth | ||||
| • 1925–1929 | 7.3 | 8.9 | 5.7 | 8.6 |
| • 1930–1934 | 13.0 | 13.4 | 12.2 | 11.6 |
| • 1935–1939 | 19.1 | 18.7 | 19.9 | 17.3 |
| • 1940–1944 | 24.3 | 23.0 | 25.2 | 25.2 |
| • ≥1945 | 36.3 | 36.0 | 37.0 | 37.3 |
| Regiona | ||||
| • Mediterranean | 13.7 | 14.0 | 12.6 | 14.7 |
| • Centre North | 31.4 | 29.4 | 32.0 | 33.8 |
| • North West | 9.0 | 9.1 | 9.1 | 8.9 |
| • North | 5.2 | 5.6 | 4.9 | 5.1 |
| • East | 8.4 | 9.1 | 8.9 | 7.2 |
| • South East | 13.0 | 12.3 | 13.6 | 11.9 |
| • South West | 11.9 | 13.0 | 11.8 | 11.5 |
| • West | 6.9 | 6.8 | 7.1 | 6.6 |
| • Not metropolitan | 0.3 | 0.4 | ||
| • Missingb | 0.2 | 0.3 | 0.03 | 0.3 |
| Vital status | ||||
| • Alive (%) | 89.5c | 88.8c | 99.96d | 83.4d |
aDecember 1997.
bParticipants who moved between Q1 and Q2.
cAmong still-insured participants (June 2013).
dMarch 2012.
eParticipants who died between Q1 and Q2 were deleted.
How often have they been followed-up?
Until now, nine follow-up questionnaires have been sent every 2–3 years from the baseline.
Approximately half of the answers were obtained after the first mailing. Two reminders were sent thereafter. The questionnaires were accompanied with newsletters that informed participants about the major results obtained to date [http://www.e3n.fr/]. The participation rate remained high (77–92% according to the questionnaires, as shown in Table 3) and the lost to follow-up rate was minimal because of the ability to trace non-respondents through their insurance plan files. The questionnaires were accurately filled in, with few missing or unacceptable answers. For cases in which the values of a given covariate were lacking for <5% of participants, the values were presented as medians or modes; for higher proportions, unknown values categories were created.
Questionnaire history and response rate (E3N cohort 1990–2011)
| Questionnaire | Date | Number sent | Number received | Response rate (%) |
|---|---|---|---|---|
| Q2 | January 1992 | 98 990 | 86 164 | 87 |
| Q3 | June 1993 | 93 055 | 74 529 | 80 |
| Q4 | December 1994 | 75 347 | 69 148 | 92 |
| Q5 | April 1997 | 97 860 | 86 825 | 89 |
| Q6 | June 2000 | 96 605 | 83 196 | 86 |
| Q7 | July 2002 | 93 389 | 81 453 | 87 |
| Q8 | July 2005 | 93 121 | 71 411 | 77 |
| Q9 | July 2008 | 92 886 | 73 705 | 79 |
| Q10 | December 2011 | 87 751 | 70 516 | 80 |
| Q11 | September 2014 |
What has been measured?
To date, 10 self-administered questionnaires have been sent (see Table 3). Each follow-up questionnaire also recorded the participant’s health status. The questionnaires are available at [http://www.e3n.fr/]. All recorded information (see Table 4) has been computerized and validated. The questionnaires are anonymous and identified with an identification number and pin code that can be rapidly scanned to identify the respondents. The questionnaires are optically scanned and all answers are checked on screen. The scanned images are saved to allow data entry at a later time, including information regarding the addresses of medical doctors (n = 18 000 to date) or drug names (pre-listed to avoid errors). The longitudinal data (repeats of identical questions for the purpose of updating information about topics such as menopause or smoking) are routinely homogenized. Several validation studies (e.g. dietary and anthropometrical data studies) have been performed and have revealed very satisfactory results.1,2
Collected data
| Data | Q1 1990 | Q2 1992 | Q3 1993 | Q4 1995 | Q5 1997 | Q6 2000 | Q7 2002 | Q8 2005 | Q9 2008 | Q10 2011 |
|---|---|---|---|---|---|---|---|---|---|---|
| Sociodemographic factors | ||||||||||
| • Educational level | X | |||||||||
| • Professional activity | X | X | ||||||||
| • Age at cessation of activity | X | X | ||||||||
| Anthropometric measurements | ||||||||||
| • Height | X | X | X | X | X | X | X | |||
| • Weight | X | X | X | X | X | X | X | X | X | |
| • Hip circumference | X | X | X | X | X | |||||
| • Waist circumference | X | X | X | X | X | |||||
| Reproductive factors | ||||||||||
| • Menstrual factors (age at menarche, length of menstrual cycle) | X | X | X | X | X | X | (X) | |||
| • Reproductive history (number of pregnancies, age at each pregnancy, durations and outcomes of pregnancies, breastfeeding, infertility) | X | X | ||||||||
| • Menopause (age, type) | X | X | X | X | X | X | ||||
| Hormonal treatments | ||||||||||
| • MHT, oral contraceptives, other (age at first use, duration of use, age at last use) | X | X | X | X | X | X | X | X | ||
| Health behaviours | ||||||||||
| • Tobacco consumption | X | X | X | X | X | X | X | X | X | |
| • Alcohol consumption | X | X | X | |||||||
| • Physical activity | X | X | X | X | ||||||
| • Diet questionnaire | X | X | ||||||||
| General health | ||||||||||
| • Medical and surgical history | X | X | X | X | X | X | X | X | X | X |
| • Medication use | X | X | X | X | X | X | X | X | X | X |
| • Family history of cancer, diabetes and cardiovascular disease | X | X | X | |||||||
| Mental health | ||||||||||
| • Centre for Epidemiologic Studies Depression Scale (CESD) | X | X | ||||||||
| • Depression | X | X | X | X | X | X | X | X | X | X |
| Health outcomes | X | X | X | X | X | X | X | X | X | X |
Self-reported cases of cancer are validated and coded after reviewing the pathology reports obtained from medical practitioners, and nearly 90% of all cancer cases are histologically confirmed. Other diseases are also validated (e.g. diabetes, myocardial infarction, stroke, Parkinson disease) by requesting additional information about the participants (e.g. glycosylated haemoglobin levels, fracture-related circumstances, drug names) and sending questionnaires to medical doctors.
Additionally, a biological material bank was generated. Blood samples were initially collected from 1994–99. The participation rate among the invited participants was approximately 40%; this yielded approximately 25 000 blood samples that were each separated into 28 aliquots (e.g. plasma, serum, leukocytes, erythrocytes). Plastic straws were used to store each participant's samples in liquid nitrogen containers (−196°C). The bio-repositories are located at the IARC (Lyon) and the EFS (Etablissement Français du Sang, Annemasse).
Since 2004, approximately 10 case-control studies have been conducted (approximately 1800 cases and 3500 controls) with regard to the measurements of various biomarkers (e.g. fatty acids, calcium, vitamin D, vitamin B, cholesterol and C-reactive protein). A metabolomics study is currently ongoing.
From 2009–11, saliva samples (Oragene, DNA Genotek, Kanata, ON, Canada) were requested from 68 242 living women and were obtained from 47 000 women (participation rate, 69%). Salivary DNA has been extracted and has been used for genotyping in two case-control studies (approximately 2500 cases and 850 controls) since December 2010.
We are currently planning to set up a tumour tissue bank and will begin with the collection of breast cancer tissues.
What has it found? Key findings and publications
The E3N cohort has produced a spectrum of results regarding the complex roles played by nutrition, hormonal factors, physical activity, anthropometric characteristics and other major lifestyle-related factors with respect to various diseases. The key findings are described below.
Hormonal treatments
We analysed the use of menopausal hormone therapies (MHT) as a potential risk factor for hormone-related diseases by taking advantage of the large number of French-specific MHTs available on the market for the treatment of menopausal symptoms. Small structural changes can considerably alter the effects of progestogens and it remains unclear whether some of these changes are more deleterious than others. Ours is the only existing study to include hormonal treatment usage and menopausal occurrence data that has been updated at regular and frequent intervals. Our main results are summarized hereafter (see also Figure 1).
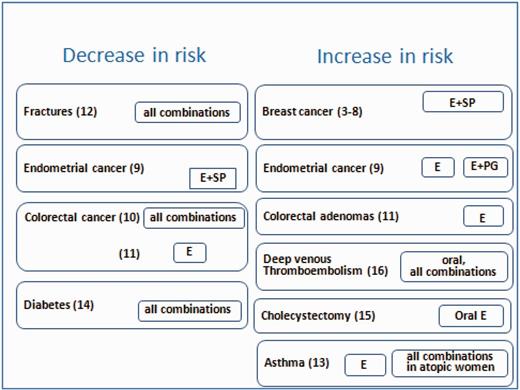
Benefits/risks of use of menopausal hormone therapies. Results from the E3N cohort. E, estrogen; SP, synthetic progestin; PG, micronised progesterone.
We found that the associations of estrogens with progesterone or dydrogesterone were less deleterious than the association with synthetic progestins.3–5 The impact of MHT on breast cancer varied not only according to the estrogen/progestogen combination but also according to the histological tumour type (a higher risk was observed with lobular vs ductal breast cancers) and the hormone dependence status (a higher risk was observed in receptor-positive tumours).5 The initiation of MHT use soon after menopause or several years later yielded similar risks for long durations of use, though an increase in risk was seen for short durations, restricted to combinations of estrogen with synthetic progestins initiated soon after menopause.6 The excess in breast cancer risk associated with estrogen-only and estrogen/synthetic progestins MHT, when used for more than 5 years, persisted until 10 years after treatment cessation.7,8 After the huge decline in MHT use due to the Women’s Health Initiative publications, our results, which were largely covered by the French media, have led to a complete modification of the MHT prescription habits.
We confirmed that any unopposed estrogen use was associated with an increased risk of endometrial cancer but also showed that oral micronised progesterone might not be as efficient as other oral progestogens for the prevention of estradiol-induced endometrial cancer.9
MHT use was associated with a reduced colorectal cancer risk.10 Additionally, we found that any MHT use did not significantly associate with the colorectal adenoma risk and that any use of estrogens alone was associated with opposing risks of colorectal adenoma and colorectal cancer, suggesting a complex relationship.11
The benefit of long-term MHT use for bones might be limited to current and recent users; women might no longer be protected against fractures beyond 5 years after the cessation of MHT use. We found no differences in risk with regard to the route of estrogen administration, the type of combination therapy or the age at postmenopausal treatment initiation.12
Studies have suggested that female hormones might play a role in asthma and that MHT might increase the risk of asthma in postmenopausal women. In the E3N cohort, we observed an increased rate of newly diagnosed asthma cases related to the postmenopausal use of estrogen alone.13
The risk of diabetes decreased with the use of MHT in a BMI (body mass index) change-independent manner.14
The risk of cholecystectomy increased with the use of unopposed oral estrogens.15
The route of estrogen administration and the type of progestogen are important: transdermal estrogens alone or combined with progesterone might be safe with respect to thrombotic risk.16
Overweight
Excess body weight is an increasing problem worldwide. In France, the prevalence of obesity in women nearly doubled between 1997 and 2012 (8.3% in 1997 vs 15.7% in 2012). We analysed the relationships between various anthropometric and health outcomes according to the detailed questions that were included in the follow-up questionnaires (key findings shown in Figure 2).
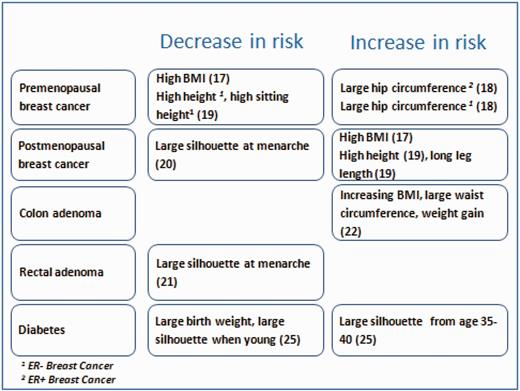
Anthropometric characteristics and risk of various outcomes. Results from the E3N cohort.
Among postmenopausal women, we found an increase in the risk of breast cancer with increasing weight and BMI,17 although this was limited to hormone receptor-positive tumours. The risk of premenopausal breast cancer, regardless of hormone receptor status, was associated with a large hip circumference.18 Simultaneously, we observed that leg length and sitting height correlated with an increased risk of postmenopausal estrogen receptor-positive (ER+) tumours and a decreased risk of premenopausal estrogen receptor-negative (ER-) tumours, respectively.19 We used the self-reported body shapes at ages 8, menarche, 20–25 and 35–40 years (recorded via Sørensen’s drawings). Women with a large body shape at menarche, irrespective of their body shape before or after menarche, had a decreased risk of ER+/PR+ postmenopausal breast cancer when compared with those who were consistently lean; this was independent of the current BMI or age at menarche.20 Using group-based trajectory modelling, we found that a consistently large body shape or a marked increase in the body shape at menarche was associated with a decreased risk of ER+/PR+ postmenopausal breast cancer, compared with a body shape that slowly increased throughout life.20
Using a database comprising >17 000 women who had undergone colonoscopy examinations during follow-up, 1408 of whom developed adenomas, we found that the left colon adenoma risk was associated with a high birthweight and large adult body shape, whereas a large body shape near menarche was associated with a decreased rectal adenoma risk relative to that of women with small body shapes near menarche.21 Obesity and waist circumference were associated with an increased risk of left colorectal adenoma. Obesity and weight gain might also be associated with early colorectal carcinogenesis, particularly that of the distal colon.22
A strong dose-effect relationship with BMI was observed; women with a BMI of 22.5–25 kg/m2 were found to have a significantly increased risk when compared with leaner women. This finding was specific to cohorts such as ours that included large proportions of lean women.23 In a case-control study that was nested within the European Prospective Investigation into Cancer and Nutrition, we evaluated whether inflammatory markers [C-reactive protein (CRP), interleukin 6 (IL-6) and IL-1 receptor antagonist (IL-1Ra)] influenced the association between obesity and endometrial cancer. We found that chronic inflammation might mediate this association and that endometrial carcinogenesis might be promoted by an inflammatory milieu.24
We found that low birthweight and thinness until young adulthood increased the risk of diabetes, independently of adult BMI.25
Diet
A large portion of our contribution to the analysis of diet and cancer was conducted in collaboration with the EPIC consortium. Our interest was regarding the study of dietary patterns. We demonstrated a reduced risk of breast cancer with a healthy/Mediterranean dietary pattern only in women with reasonable energy intake levels, and an increased risk of breast cancer with a Western diet, particularly in normal-weight women.26 To quantify the health impacts of dietary modification, we aggregated alcohol consumption and fruit and vegetable consumption into a health index that also accounted for smoking, the BMI and physical activity. Adherence to a single recommendation exerted a moderate impact on the cancer risk, whereas adherence to all five healthy practices might have prevented 6.3% of cancers at any site, 6.2% of premenopausal breast cancers, 8.0% of postmenopausal breast cancers and 12.8% of colorectal cancers.27
In addition to dietary factors, which were assessed with questionnaires, we analysed dietary and lifestyle biomarkers. Dietary fatty acid biomarkers provide objective, qualitative measures of the bioavailable amounts of these nutrients irrespective of the food source and quality, particularly for fatty acids that are not endogenously synthesized such as essential fatty acids, n-3 long-chain polyunsaturated fatty acids and some trans-fatty acids (3–6).28 In a nested case-control study, we showed that women in the highest trans-monounsaturated fatty acids tertile had an increased breast cancer risk.29 In another nested case-control study, we found that high serum concentrations of 25-hydroxyvitamin D [25(OH)D] were associated with a reduced breast cancer risk, leading us to propose randomized intervention trials to confirm the benefit of this nutrient on the breast cancer risk and to conclude that public health policies should encourage the maintenance of adequate vitamin D levels in the population.30
Future plans
In the short term, we will address factors related to breast cancer recurrence and survival. We are also developing collaborations to integrate genomics and classic epidemiology and thus identify new factors associated with the risks of cancer development and death after cancer survival. Finally, the E4N (Epidemiology 4 kNowledge or, in French, Enfants des femmes E3N) project, which will rely on a new cohort comprising the spouses, children and grandchildren of the E3N women, has been funded by the Agence Nationale de la Recherche (ANR) and is currently being launched (2014: spouses, 2016: children and grandchildren).
What are the main strengths and weaknesses?
The E3N cohort relied on a population of highly educated and motivated women. The response rate remains very high after >20 years and, most importantly, the questionnaires are answered seriously (as shown by the satisfactory results in the validation studies, and by the rate of answers to questionnaires), thus ensuring high reliability. All participants are members of a health insurance plan that maintains active vital status and address records (for medical fee reimbursement). In France, subjects have complete coverage of expenses related to a list of 29 chronic diseases (e.g. cancer, cardiovascular disease, diabetes, neurodegenerative diseases, psychiatric disease). Linkage of our data with the insurance plan files, when allowed by the ethical authorities (authorizations are under way), will ensure the traceability of non-respondents with regard to any of these 29 diseases.
Limitations of our study include a lack of heterogeneity regarding certain exposures in our population. However, we consider this to be a moderate limitation; for instance, we obtained very interesting results from the 6% of the E3N women with professional exposure to cleaning sprays (related to asthma occurrence) and from the marked regional differences in dietary habits and alcohol consumption among the cohort.31 Prospective cohort studies are never representative of the general population, because of selective participation. The occupational and social gradient in exposure to risk factors and disease between invited individuals who accept or decline to participate has been largely documented.32 However, it is unclear how this selection would have affected the results.33,34 Many cohort studies comprise thorough responders and have the advantage of obtaining quality data from motivated participants.
Can I get hold of the data? Where can I find out more?
Documentation for this cohort, including the questionnaires, photo booklets sent with the questionnaires, information leaflets sent to the participants and detailed information about the research and publications is available at [http://www.E3N.fr]. Requests for collaborations are welcome, particularly those regarding rare diseases. Further information can be obtained by contacting [E3N.SECRETARIAT@gustaveroussy.fr].
Funding
The E3N study has been conducted with financial support from the Mutuelle Générale de l’EducationNationale (MGEN); French League against Cancer (LNCC); Gustave Roussy Institute (IGR); French Institute of Health and Medical Research (Inserm); and the European Union through participation in EPIC. Additional funds have also been obtained from research grants, mostly from French institutions such as the Institut National du Cancer, Fondation de France, Fondation ARC pour la Recherche sur le Cancer, Ligue nationale contre le Cancer, Agence nationale de Sécurité du Médicament and Agence Nationale de la Recherche, and from the European Union.
Acknowledgements
Special thanks are given to the following past and present E3N team members: N.B., A.B., M.C.B.R., C.C., V.C., R.C., L.Da., B.D.L., L.Do., P.E., V.E., G.F., M.F., A.Fa., Y.F., A.Fo., E.G., P.G.R., H.G., C.G., G.G., V.H., L.A.H., C.J., C.K., E.K., M.K., M.L., C.L., S.Me., S.Mo., L.N., A.N., M.Y.N., L.O., X.P., F.P., D.P., J.P., N.P., S.Rag., S.Re., E.Ro., M.S.T., B.T., A.T., L.T., M.T., M.V., V.V., A.V., S.V. and F.W;. as well as those who made the E3N cohort possible: E.B., C.B., C.C.N., R.F†, J.G., A.L., G.L. E.S., A.S and E.Ri.
Conflict of interest: None declared.
References

