


Abstract
Objectives The effectiveness of vaccines in populations must consider both direct and indirect protection. This study reanalyses data from a large individually randomized oral cholera vaccine trial that was conducted in rural Bangladesh from 1985 to 1990. A recent analysis of the results of that trial showed that the proportion of people in household clusters who received the vaccine was inversely related to placebo incidence during the first year of surveillance, which was attributed to herd immunity.
Methods In this study we measure the relationship between neighbourhood-level oral cholera vaccine coverage and protective efficacy (PE) during a 2 year follow-up period, controlling for known effect modifiers. We link trial data to a household geographic information system to facilitate the neighbourhood-level analysis.
Findings Neighbourhood-level PE can be partially explained by vaccine coverage after adjusting for ecological variables.
Conclusions The inverse relationship between vaccine coverage and efficacy illustrates that people living in high-coverage areas may be indirectly protected from cholera because people living around them are vaccinated.
Evaluations of the effectiveness of vaccines in populations must consider both direct and indirect protection.1–3 In the 1980s, a large, individually randomized oral cholera vaccine trial resulted in only ∼50% protective efficacy (PE) and, therefore, the vaccine has not been introduced into endemic populations. Ali et al. (2005)4 reported that in that trial the proportion of people in household clusters who received the vaccine was inversely related to placebo incidence during the first year of surveillance, which was attributed to the effect of herd protection of the vaccines. The study also showed that in household clusters in which >51% of people were vaccinated, PE was only ∼14%. In other words, if the trial would have only considered the 22 394 vaccine and placebo recipients living in these high-coverage clusters then the vaccine would have been shown to be almost completely ineffective. In contrast, in areas with low coverage (i.e. <28%) the PE would have shown a more promising result (i.e. PE = 62%). An inverse relationship between neighbourhood vaccine coverage and PE is consistent with the idea that the oral cholera vaccine confers both direct and indirect protection. This paper further analyses this vaccine trial by measuring the relationship between neighbourhood vaccine coverage and PE, while controlling for known ecological effect modifiers. This analysis uses the same definition of vaccination (i.e. two doses of either vaccine or placebo) but measures the relationship using continuous variables and by using a 2 year follow-up period instead of one.
Background and data
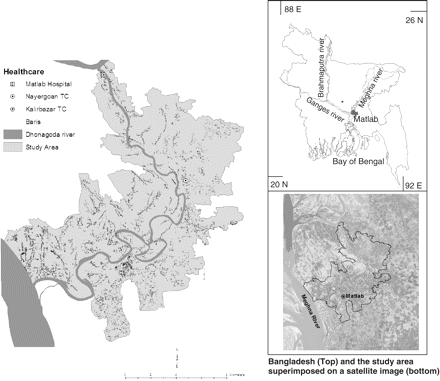
The study area is in south-central Bangladesh, ∼50 km south-east of Dhaka, adjacent to where the Ganges River meets the Meghna River (Figure 1). Rural Bangladeshis live in clusters of patrilineally related groups of households called baris. This study uses three datasets including the original cholera vaccine trial database,5 a longitudinal demographic database from which the vaccine trial participants were selected, and a household-level spatial database of the study area.6–7 All vital demographic events of the population are noted through an extensive community-based health and demographic surveillance system (HDSS). A corresponding household-level geographic information systems (GIS) database allows us to identify the household location of all individuals who took part in the trial as well as the household location of each person in the HDSS. The GIS database includes an accurate bari location for all individuals living in the study area including all people who were vaccinated, controls, people who refused vaccines, and everyone else living in the study area who was not part of the study. Figure 1 shows three features in the GIS database including health facilities, the Dhonagoda River, and baris. Baris are all identified by the HDSS census number within the GIS database. This allows us to link attribute data to the spatial database. In turn, demographic data, disease incidence, or vaccine status data are linked to specific bari locations.
Study area GIS database
From 1985 to 1990, we conducted a community-based individually randomized oral cholera vaccine trial in Matlab, Bangladesh, the research site for the ICDDR,B: Centre for Health and Population Research. This double-blind trial measured the PE of two vaccines, the B subunit-killed whole cell (BS-WC) and the killed whole cell only (WC) vaccines. The control agent was the Escherichia coli K12 strain. Females aged 15 years and older and children aged 2–15 were the target group in the trial because these are the groups with the highest cholera incidence rates.5 Three vaccine doses were given to 62 285 people in the target group at 6 week intervals. During 3 years of follow-up, the global PE was 49% for the BS-WC group (P < 0.001) and 47% for the WC group (P < 0.001). Protection was lower in children who were vaccinated at 2–5 years than in older persons. After 1 year, protection was 38% for the BS-WC group and 31% for the WC group and after 3 years there was no protection at all in this age group.
Methods
The description of vaccines, control agents, vaccine administration procedures, and the definition of cholera cases are described in detail elsewhere.8 The efficacy calculations were based on cholera cases for a 2 year surveillance period beginning 14 days after the second dose. To minimize the effect of migration in the analysis, we omitted the third year of follow-up in this study. We grouped the two vaccines because they were identical in composition except for the inclusion of the B subunit; the vaccines also conferred similar levels protection.5,9
Unit of analysis and neighbourhood size
Neighbourhoods were defined by a 2 km buffer around each of the 6423 baris. A 2 km neighbourhood was chosen by exploring the distribution of PE within different neighbourhood sizes with radii ranging from 0.5 to 5 km (Table 1). With a 0.5 km size, 1098 neighbourhoods had no cholera cases and there was high variation (i.e. standard deviation > mean) of PE across neighbourhoods. This suggests that such a small neighbourhood size is not suitable to explain local PE variation. With 1 and 1.5 km radii, 146 and 2 neighbourhoods, respectively, had no cholera cases and the standard deviations were also quite large. With a 2 km size, all neighbourhoods had cholera cases and the standard deviation suggests that there is a moderate amount of variation. Since our objective was to address local-level variation, the 2 km size was found to be the smallest neighbourhood with no missing cholera cases that would allow us to reliably investigate the factors that influence PE across local areas. The average number of baris within the 2 km radius was 424 (range = 77–921) and the target population was 7591 (range = 1800–13 772). Figure 2 is a correlogram of PE that illustrates how correlations between neighbourhood pairs decrease with increasing distances. Figure 3 is an interpolated PE map that is classified into quintiles so the spatial variation can be visualized. The interpolation technique employed to make this map is kriging, which is a method that creates unbiased weighted averages of the data with minimum variance.
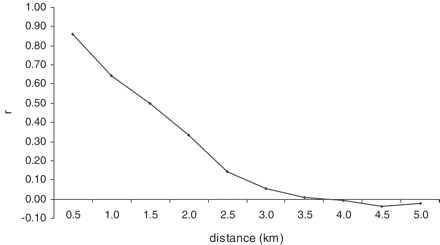
Correlogram of protective efficacy
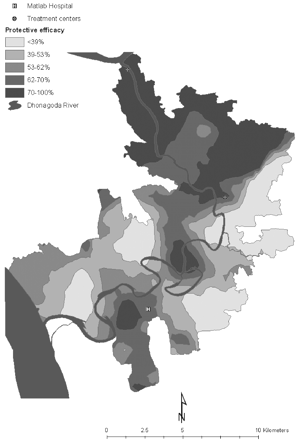
Spatial variation of oral cholera PE in Matlab, 1985–86
Cholera cases and protective efficacy (PE) statistics by varying neighbourhood sizes
| Neighbourhood sizes (km) | Cholera cases | PE (%) | ||||||||||||
|---|---|---|---|---|---|---|---|---|---|---|---|---|---|---|
| Min. | Max. | Mean | SD | Min. | Max. | Mean | SD | |||||||
| 0.5 | 0 | 17 | 2.93 | 2.51 | −257.5 | 100.0 | 37.26 | 46.54 | ||||||
| 1.0 | 0 | 26 | 8.78 | 4.99 | −306.1 | 100.0 | 43.39 | 47.17 | ||||||
| 1.5 | 0 | 44 | 17.28 | 7.93 | −295.7 | 100.0 | 51.08 | 32.28 | ||||||
| 2.0a | 1 | 73 | 28.58 | 11.46 | −246.9 | 100.0 | 52.94 | 28.08 | ||||||
| 2.5 | 3 | 87 | 42.23 | 16.02 | −46.5 | 100.0 | 55.28 | 15.93 | ||||||
| 3.0 | 4 | 109 | 57.88 | 20.62 | −47.5 | 93.1 | 56.10 | 12.90 | ||||||
| 3.5 | 10 | 127 | 74.44 | 24.71 | 2.4 | 93.0 | 56.79 | 10.95 | ||||||
| 4.0 | 10 | 153 | 91.58 | 28.87 | .6 | 93.1 | 56.88 | 10.67 | ||||||
| 4.5 | 11 | 183 | 109.47 | 34.04 | .1 | 93.1 | 57.07 | 9.90 | ||||||
| 5.0 | 11 | 206 | 128.50 | 39.39 | 31.1 | 93.1 | 57.22 | 8.68 | ||||||
The text in bold indicate the data for neighbourhood size used in this study.
Neighbourhood-level vaccine coverage was calculated as the number of vaccinated individuals (i.e. two-dose recipients of either BS-WC or WC) divided by the number of persons who were age-eligible and sex-eligible for participation in the trial within that neighbourhood. The other variables are all potential effect modifiers of the vaccine. Bari-level population statistics were taken from HDSS records and aggregated by neighbourhood. Since Clemens et al.5 found that age is an important effect modifier for the oral cholera vaccines, we calculated the average age of two-dose recipients of vaccine or placebo within each neighbourhood. The population size is a density measure since all neighbourhoods are the same size. Most people in Matlab are Muslim and the minority population is Hindu. We calculated the percentage of Hindus in a neighbourhood using HDSS records. We also calculated the percentage of educated people >5 years of age within each neighbourhood. A person was considered to be educated if they had at least 4 years of secular education. Farming is the most common profession in Matlab. Because the household head is the main health-decision maker, we considered his/her occupation when defining whether or not the household was agrarian or not, and then calculated the percentage of agrarian households for each neighbourhood. Because population migrations progressively change the composition of neighbourhoods over time, we computed migration rates (both in and out) by neighbourhood to determine a net migration rate (i.e. in-migration minus out-migration). All migrations during the 2 year period (1985–86) were used in the computation. Linear distances from the centre of each neighbourhood to the main river (i.e. the Dhonagoda River) and the closest surveillance facility (i.e. either the Matlab hospital or community-operated treatment centres) were computed using the GIS.
Statistical analysis
We used a spatial autoregressive lag model implemented in GeoDA version 0.9.5.i to measure the relationships between PE and vaccine coverage and the other ecological variables obtained at a neighbourhood scale.10–12 Initially, we fit the data in an ordinary least squares (OLS) regression model. As expected, the results suggested considerable non-normality (Jarque-Bera = 389 819.7; P < 0.001) and heteroscedasticity (White statistic = 1960.42; P < 0.001), as well as high spatial correlation (Moran's I = 0.2848; P < 0.001). Based on this result we concluded that a spatial lag model was appropriate for this dataset. The spatial lag model is a maximum likelihood estimate that uses a spatially lagged dependent variable. Formally, this model is y = ρWy + Xβ + ε, where y is a vector of observations of the dependent variable, Wy is a spatially lagged dependent variable for weight matrix W, X is a matrix of observations of the explanatory variables, ε is the vector of the independently and identically distributed error terms, and ρ and β are parameters.13 The spatial weights were constructed based on a 2 km fixed distance, the same size used for computing neighbourhood-level variables. The fixed distance was used because we believe distance is an important factor for the spread of cholera and also our experience suggests that using a fixed number of neighbourhoods (using k-nearest neighbours) in sparsely populated areas may produce spurious results for disease-related phenomena.13
Results
Oral cholera PE varied by neighbourhood from below zero to as high as 100% (Table 1). PE also varied in space; it was highest in neighbourhoods in the northern part of the study area (Figure 3). Average neighbourhood-level vaccine coverage was 40% but it varied from 23 to 58% (Table 2). The highest size of population in a neighbourhood was 10 times the lowest population size. The average age of the two-dose recipients of either vaccine or placebo by neighbourhood was 20 years. An average of 13% of the population was Hindu and there were no Hindus in 35 neighbourhoods. In contrast, Muslims were found in all neighbourhoods. An average of 24% of the population was educated in each neighbourhood and 31% of households were agrarian. There was more out-migration than in-migration resulting in an overall net negative migration. The mean distance from the centre of neighbourhoods to the nearest hospital or community operated treatment centre was 3.9 km and the mean distance to the main river was 1.3 km.
Descriptive statistics of the neighbourhood-level study variables
| Independent variables | Mean | SD | Minimum | Maximum |
|---|---|---|---|---|
| Vaccine coverage (%) | 39.71 | 8.52 | 23.05 | 57.78 |
| Total population (no.) | 11 503 | 3684 | 2725 | 20 865 |
| Age of the two-dose recipients (years) | 19.71 | 0.63 | 18.17 | 21.72 |
| Hindu population (%) | 13.72 | 3.14 | 0 | 86.93 |
| Educated population over 5 years (%) | 23.64 | 3.60 | 13.73 | 33.42 |
| Agrarian households (%) | 31.38 | 6.49 | 13.09 | 53.96 |
| Net migration (%) | −2.93 | 1.60 | −11.25 | −0.64 |
| Distance to the hospital/treatment centre from the centre of neighbourhood (km) | 3.87 | 1.98 | 0.034 | 9.305 |
| Distance to the river from the centre of neighbourhood (km) | 1.32 | 1.14 | 0.003 | 6.106 |
There were differences in regression coefficients between OLS and spatial lag regression. The OLS regression model explained 26% (R2 = 0.2595) of the total variation, which increased to 61% (R2 = 0.6149) when building the spatial lag model. However, the spatial lag model has a pseudo-R2 that cannot be directly compared with the R2 of the OLS model. The proper measures of fit are the log-likelihood, Akaike Information Criterion (AIC), and the Schwarz Criterion (SC). There was an increase in the log-likelihood from −29 571.6 for the OLS model to −27 721.9 for the spatial lag model. The AIC was 59 163.2 for the OLS model and 55 465.9 for the spatial lag model and the SC 59 230.9 and 55 540.3 for each model, respectively. These lower values for the spatial lag model compared with the OLS suggests an improved fit for the spatial lag specification.
The results of the spatial lag regression with distance-based spatial weight shows significant negative association between vaccine coverage and PE after controlling for the other factors included in the model (Table 3). As expected, average age was positively associated with PE. Other variables that were positively associated with PE include percentage of Hindus, percentage agrarian, and distance from the main river. Those variables that were negatively associated with PE include net migration and treatment centre distance. The spatial patterns of residuals were also analysed by creating a Moran's I scatter plot. The Moran's I test statistic for the OLS residuals is 0.4419 (Figure 4a) and for the lag residuals is 0.0807 (Figure 4b), which is near zero. This indicates that the inclusion of the spatially lagged dependent variable term in the model eliminated the spatial autocorrelation.
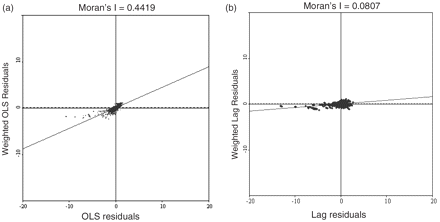
(a) Moran scatter plot for OLS (left) and (b) spatial lag residuals (right), PE
Ecological influences on PE of oral cholera vaccines
| Variable | Coefficient | Std. Error | Z-value | Probability |
|---|---|---|---|---|
| Constant | −27.94 | 8.37 | −3.34 | 0.00 |
| Vaccine coverage | −0.40 | 0.04 | −9.14 | 0.00 |
| Average age | 1.13 | 0.44 | 2.59 | 0.00 |
| Population | 0.00012 | 7.58e−005 | 1.57 | 0.12 |
| % Hindu | 0.19 | 0.02 | 7.50 | 0.00 |
| % Educated | −0.01 | 0.08 | −0.15 | 0.88 |
| % Agrarian | 0.34 | 0.05 | 6.44 | 0.00 |
| Net migration | −2.46 | 0.22 | −11.30 | 0.00 |
| Hospital distance | −0.41 | 0.19 | −2.16 | 0.03 |
| River distance | 1.08 | 0.29 | 3.72 | 0.00 |
R2: 0.61.
Discussion
Our results illustrate that the PE of oral cholera vaccines varied across neighbourhoods, and the variation was inversely related to vaccine coverage after adjusting for several ecological factors. Although the vaccines conferred nearly 53% protection against cholera in the 2 years of follow-up, our neighbourhood level analysis showed that 33% of the neighbourhoods had at least 65% protection, and 13% of the neighbourhoods had a minimum of 75% protection against cholera. In contrast, 16% of the area experienced a very low level of protection (PE ≤ 35%) against cholera with the same vaccines. How can such neighbourhood-level variation in PE be explained? Our previous analysis with 1 year of follow-up data showed that cholera incidence was influenced by the level of vaccine coverage in extended households.4 The inverse relationship between PE and vaccine coverage found in the present analysis using 2 years of follow-up data suggests that higher neighbourhood coverage reduces cholera incidence more rapidly in the placebo group than in the vaccine group resulting in an inverse relationship between PE and vaccine coverage. This is possible because the overall incidence rate is much lower in the vaccine group than in the placebo group. In areas with low transmission, because of high vaccine coverage, the incidence rate in the placebo group is lower.4 This indicates that when there is very high coverage, PE can be obscured and suggests that global efficacy measures can be misleading in certain circumstances.
This local-level analysis of a vaccine trial suggests that conventional evaluation (i.e. global efficacy estimation) may be biased because of variation in neighbourhood-level vaccine coverage. Thus, the traditional method of vaccine evaluation may result in an artificially low estimate of the benefit of a vaccine and in some situations it may produce a misleading result. Therefore, a vaccine that could have a major impact on health might not be used because of weaknesses in analytical methods not the intervention itself. Vaccines are one of the most cost-effective measures for improving health outcomes, thus they require rigorous evaluation including local-level analyses.
Oral cholera vaccine efficacy varied by neighborhood in a trial in rural Bangladesh.
There is an inverse relationship between vaccine coverage percentage and efficacy.
People living in high-coverage neighborhoods are indirectly protected since more people living around them are vaccinated (i.e., there is herd immunity).
Conventional vaccine trials that do not consider local differences in coverage may result in artificially low estimates of the benefit of vaccines.
Funding for this study was provided by grant number 1R03AI53214-01 National Institute of Allergies and Infectious Disease, National Institutes of Health, and grant number 0323131 Geography and Regional Science Program, National Science Foundation.
References
Fox JP, Elveback L, Scott W, Gatewood L, Ackerman E. Herd immunity: basic concept and relevance to public health immunization practices.
Ali M, Emch M, von Seidlein L et al. Herd immunity conferred by killed oral cholera vaccines in Bangladesh: a reanalysis.
Clemens JD, Sack DA, Harris JR et al. Field trial of oral cholera vaccines in Bangladesh: Results from three-year follow-up.
Ali M, Emch M, Ashley C, Streatfield PK. Implementation of a medical geographic information system: concepts and uses.
Clemens JD, Sack DA, Harris JR et al. Field trial of oral cholera vaccines in Bangladesh.
Clemens JD, Harris JR, Sack DA et al. Field trial of oral cholera vaccines in Bangladesh: Results of one year of follow-up.
Anselin L. Under the hood: Issues in the specification and interpretation of spatial regression models.
Anselin L, Bera A. Spatial dependence in linear regression models with an introduction to spatial econometrics. In: Ullah A, Giles D (eds). Handbook of Applied Economic Statistics. New York: Marcel Dekker,
Anselin L. GeoDA 0.9 User's Guide. Urbana-Champaign, IL: Spatial Analysis Laboratory, University of Illinos,
Anselin L. Exploring spatial data with GeoDA: A workbook. Urbana-Champaign, IL: Spatial Analysis Laboratory, Department of Geography, University of Illinois,

