


Abstract
Background Limited data are available regarding global hepatitis B virus (HBV)-related morbidity and mortality and potential reduction in disease burden from hepatitis B vaccination.
Methods A model was developed to calculate the age-specific risk of acquiring HBV infection, acute hepatitis B (illness and death), and progression to chronic HBV infection. HBV-related deaths among chronically infected persons were determined from HBV-related cirrhosis and hepatocellular carcinoma (HCC) mortality curves, adjusted for background mortality. The effect of hepatitis B vaccination was calculated from vaccine efficacy and vaccination series coverage, with and without administration of the first dose of vaccine within 24 h of birth (i.e. birth dose) to prevent perinatal HBV infection.
Results For the year 2000, the model estimated 620 000 persons died worldwide from HBV-related causes: 580 000 (94%) from chronic infection-related cirrhosis and HCC and 40 000 (6%) from acute hepatitis B. In the surviving birth cohort for the year 2000, the model estimated that without vaccination, 64.8 million would become HBV-infected and 1.4 million would die from HBV-related disease. Infections acquired during the perinatal period, in early childhood (<5 years old), and ≥5 years of age accounted for 21, 48, and 31% of deaths, respectively. Routine infant hepatitis B vaccination, with 90% coverage and the first dose administered at birth would prevent 84% of global HBV-related deaths.
Conclusion Globally, most HBV-related deaths result from the chronic sequelae of infection acquired in the perinatal and early childhood periods. Inclusion of hepatitis B vaccine into national infant immunization programs could prevent >80% of HBV-related deaths.
Introduction
Safe and effective vaccines have been available to prevent hepatitis B virus (HBV) infection since 1981, and the cost-effectiveness of hepatitis B vaccination has been well-documented.1 In 1992, the World Health Organization (WHO) recommended that childhood hepatitis B vaccination be included in immunization programs of all countries.2 Over a decade later, in 2003, 151 (79%) of 192 countries had adopted universal childhood hepatitis B vaccination policies.3 However, many countries, including those with high prevalences of HBV infection and presumably high disease burden, had not introduced hepatitis B vaccine into their national immunization programs. In addition, vaccination coverage was low in many countries that had introduced the vaccine.3
A barrier to the introduction of routine childhood hepatitis B immunization has been a lack of appreciation of the disease burden attributable to HBV infection. Although most new HBV infections occur among infants and young children, HBV-related morbidity and mortality is not immediately apparent. Acute symptomatic hepatitis B is infrequent among infected infants and children, but the likelihood of progression to chronic infection, which accounts for most HBV-related morbidity and mortality, is highest in these age groups.4,5 Chronic HBV infection usually remains asymptomatic until cirrhosis and hepatocellular carcinoma (HCC) become clinically apparent, usually among adults. Although chronic liver disease accounts for a high proportion of deaths worldwide,6 liver disease and its etiology often go unrecognized, especially in less-developed countries.7
While hepatitis B mathematical models have been developed, most focus on models of disease burden in a single country or economic evaluations of hepatitis B vaccination, but do not include estimates of global disease burden or vaccination impact.1 To define the disease burden associated with HBV infection, we developed a mathematical model to estimate HBV-related morbidity and mortality. This model can be used to estimate country, regional and global hepatitis B disease burden and potential reduction in disease burden with different hepatitis B vaccination strategies.
Methods
Model overview
A model was developed to estimate population-based HBV-related morbidity (i.e. total and chronic HBV infections) and mortality (i.e. deaths from acute hepatitis B and the chronic sequelae of HBV infection—cirrhosis and HCC) and the effect of hepatitis B vaccination on these outcomes using the age-specific risk of acquiring HBV infection, development of acute hepatitis B (illness and death), and progression to chronic infection (Figure 1a and b). Because the natural history of HBV infection is related to age, infection was assumed to occur in one of three age periods: perinatal (at birth); early childhood (after birth through 5 years), and late (>5 years). Cirrhosis and HCC deaths among persons with chronic HBV infection were presumed to be HBV-related, and were estimated from age-specific HBV-related cirrhosis and HCC mortality curves (Figure 2a and b), adjusted for background mortality.
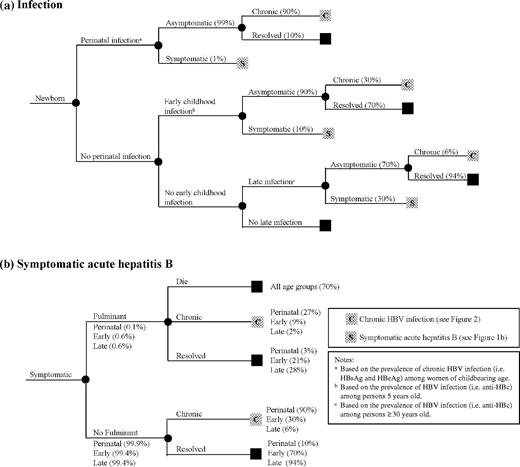
(a) Outcome of hepatitis B virus infection. (b) Outcome of symptomatic acute hepatitis B
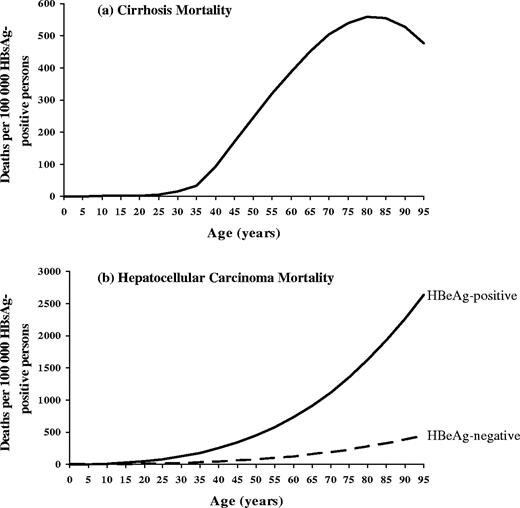
Age-specific hepatitis B-related cirrhosis and hepatocellular carcinoma mortality
Risk of infection
Perinatal period: The number of HBV infections acquired in the perinatal period among the surviving birth cohort was calculated from the prevalence of hepatitis B surface antigen (HBsAg) and hepatitis B e antigen (HBeAg) among women of childbearing age. We assumed 90% of infants born to HBsAg-positive/HBeAg-positive women, and 10% of infants born to HBsAg-positive/HBeAg-negative women would become infected (Appendix 1).8–14
Early childhood period: The number of infections acquired after the perinatal period through 5 years of age (i.e. early childhood infections) was determined from the prevalence of HBV infection among the 5 year old population by excluding perinatal infections (Appendix 1).
Late period: The number of infections acquired after 5 years of age (i.e. late infections) was determined from the prevalence of HBV infection among persons ≥30 years old in the population by excluding infections acquired in the perinatal and early childhood periods (Appendix 1). The prevalence of infection among persons ≥30 years old was taken to represent the lifetime risk of HBV infection.
Outcome of infection
Acute hepatitis B: The risk of acute hepatitis B is age dependent and occurs in ∼1% of perinatal, 10% of early childhood, and 30% of late infections (Figure 1a).11,15–18 Risk of fulminant hepatitis is also age dependent and occurs in 0.1–0.6% of acute hepatitis B cases (Figure 1b).19,20 Mortality from fulminant hepatitis B was assumed to be 70%, regardless of age.20–22 To estimate the current deaths from acute hepatitis B (see Model output section), age-specific mortality was derived from United States surveillance data for a period (1983–89) prior to the widespread use of hepatitis B vaccine.23
Chronic HBV infection: Development of chronic HBV infection is inversely related to age and occurs in ∼90% of persons infected perinatally, 30% infected in early childhood, and 6% infected after 5 years of age (Figure 1a).4,5,8–18 The likelihood of progression to chronic infection did not differ among persons with symptomatic or asymptomatic infection.4,15,24 The model assumed loss of chronic infection (i.e. loss of HBsAg) of 0.5% per year beginning at 20 years of age.25–27 Persons in whom infection resolved were assumed not to die from HBV-related cirrhosis or HCC.
Mortality from chronic HBV infection
Cirrhosis mortality: A composite age-specific mortality curve was derived from cirrhosis mortality data (ICD-9 code 571) from Taiwan (1990–96)28 and the United States (1985–93; Multiple Cause of Death computer records, National Center for Health Statistics, Department of Health and Human Services) by fitting a polynomial function of age to country data using Chi-square goodness of fit (Figure 2a) (Appendix 2A). HBV-specific cirrhosis mortality data were not available for either country and this parameter was estimated from studies of the attributable fraction of chronic HBV infection among persons with chronic liver diseases: 64% in Taiwan29 and 7% in the United States.30–32 To calculate HBV-related cirrhosis mortality among HBsAg-positive persons, each curve was adjusted for the prevalence of HBsAg in the population: 15.2% in Taiwan33 and 0.39% in the United States.34
HCC mortality: Composite age- and sex-specific mortality curves were derived from HCC mortality data from populations with a high endemicity of HBV infection and HCC incidence (Alaska Natives, China, the Gambia, Taiwan) by fitting a polynomial function of age to population data using Chi-square goodness of fit (Figure 2b) (Appendix 2B).35–40 HCC incidence and mortality were assumed to be equal since most people die of HCC within 1 year of diagnosis.41 For populations without HBV-specific HCC mortality data, we estimated this parameter from studies of the attributable fraction of chronic HBV infection among persons with HCC: 53% in the Gambia42 and 70% in Taiwan.43–45 To calculate HBV-related HCC mortality among HBsAg-positive persons, the curves were adjusted for the prevalence of HBsAg in the population: 12.0% in The Gambia46 and 15.2% in Taiwan.33 The mortality curves were adjusted to account for the six-times higher risk of HCC among HBeAg-positive compared to HBeAg-negative persons (Appendix 2B).47
Background mortality: Country-specific background mortality from 1999 (United Nations Development Program) was used to estimate the surviving number of HBsAg-positive persons who remained at risk of death from HBV-related cirrhosis or HCC.
Hepatitis B vaccine efficacy and effectiveness
The efficacy of a complete hepatitis B vaccination series (i.e. ≥3 doses of hepatitis B vaccine) in preventing perinatal HBV infection (post-exposure immunization) and early childhood and late infection (pre-exposure immunization) was estimated to be 95%.48 A complete vaccination series was assumed to provide lifelong protection from clinical acute hepatitis B and chronic HBV infection.49 To prevent perinatal infection, the first dose of vaccine had to be administered within the first 24 h after birth.48 Infants who received the complete vaccination series, but the first dose of vaccine >24 h of after birth were considered susceptible to perinatal infection, but protected from early childhood and late infection. Vaccination program effectiveness was calculated from vaccination coverage (complete series and birth dose) and vaccine efficacy (Appendix 3).
Model input
The model requires the following population-specific data to calculate disease burden: (i) birth cohort surviving past the first year of life, (ii) prevalence of HBsAg and HBeAg among women of child bearing age, and (iii) prevalence of HBV infection (resolved and chronic) among 5 year olds and ≥30 year olds (i.e. antibody to hepatitis B core antigen [anti-HBc]). To calculate the reduction in disease burden from vaccination the following parameters are needed: (i) proportion of the surviving birth cohort expected to receive the birth dose of vaccine and (ii) proportion expected to complete the vaccination series.
Model output
The model calculates hepatitis B disease burden in a specified year (designated as current burden) and in a specified birth cohort over the course of the birth cohort's lifetime (designated as future or lifetime burden).
Current burden: The model calculates the total number of deaths from acute hepatitis B, cirrhosis, and HCC in a specified year by applying the age-specific mortality curves for acute hepatitis B and HBV-related cirrhosis and HCC to the population structure for that year.
Future or lifetime burden: The model calculates the expected number of HBV infections, chronic infections, and deaths from acute hepatitis B, cirrhosis and HCC over the lifetime of a birth cohort. The output includes the proportion of infections and deaths according to age at acquisition (perinatal, early childhood, or late period) and potential reduction in infections and death with hepatitis B vaccination.
Global and regional estimates
Global and regional estimates of current and lifetime HBV-related deaths were calculated for the year 2000 (current burden) and the 2000 birth cohort (lifetime burden) for each of the six WHO-defined regions: Africa, Americas, Eastern Mediterranean, Europe, Southeast Asia, and the Western Pacific. For these calculations, countries were divided into 15 country groups based on similarities of estimated HBV infection prevalence (Appendix 4). The model was run for each country in the country group, using the same estimates for each of the four input parameters, and then countries were re-aggregated into their appropriate WHO region.
Sensitivity analysis
Disease burden sensitivity analyses: A sensitivity analysis was performed to determine the effect of modifying the four input parameters (HBsAg, HBeAg, anti-HBc at 5 years old, anti-HBc at ≥30 years old), the cirrhosis and HCC mortality curves, the risk of perinatal infection, and all parameters related to the natural history of infection (Figure 1a and b) on current HBV-related deaths. For each of these parameters, values 20% below and 20% above the base case estimates were used. For the cirrhosis and HCC mortality curves, values 20% lower and 20% higher than the composite estimate for each age was used. Each parameter was changed, one at a time, while the others were held constant.
Effect of incomplete vaccination: The effect of an incomplete vaccination series on the reduction in HBV disease burden was determined based on 30% efficacy of one dose of hepatitis B vaccine and 70% for two doses.50 At each level of complete coverage (i.e. 10–90% in 10% increments), it was assumed an additional number of children equal to 5% of the fully vaccinated cohort received one dose of vaccine and an additional 5% received two doses.
Results
Global and regional estimates of hepatitis B disease burden
Global and regional estimates of current hepatitis B-related deaths and lifetime HBV infections and deaths are shown in Table 1. In the year 2000, an estimated 620 000 HBV-related deaths occurred globally: 580 000 (94%) from chronic HBV infection and 40 000 (6%) from acute hepatitis B. Regionally, almost all (90–95%) deaths were attributable to chronic HBV infection; the proportion of deaths due to acute hepatitis B varied from 5 to 10%.
Regional and global estimates of current and future hepatitis B disease burden without vaccination, hepatitis B disease burden model
| Current burden (2000) | Future burden (2000 Birth Cohort) | ||||||||||
|---|---|---|---|---|---|---|---|---|---|---|---|
| Region | Deaths (n) | Deaths from chronic infection (%) | Total infections (n) | Chronic infections (n) | Deaths (n) | Deaths from chronic infection (%) | Increase in future deathsa (%) | ||||
| Africa | 69 000 | 90 | 18 541 000 | 2 915 000 | 276 000 | 93 | 301 | ||||
| Americas | 12 000 | 92 | 1 350 000 | 174 000 | 28 000 | 95 | 140 | ||||
| Eastern Mediterranean | 21 000 | 90 | 5 283 000 | 663 000 | 96 000 | 94 | 365 | ||||
| Europe | 51 000 | 94 | 2 893 000 | 365 000 | 56 000 | 95 | 10 | ||||
| Southeast Asia | 143 000 | 92 | 17 410 000 | 2 386 000 | 368 000 | 95 | 158 | ||||
| Western Pacific | 325 000 | 95 | 19 289 000 | 3 230 000 | 581 000 | 97 | 79 | ||||
| Global | 620 000 | 94 | 64 766 000 | 9 733 000 | 1 405 000 | 95 | 127 | ||||
Compared with deaths in 2000.
Over the lifetime of the year 2000 global birth cohort, without vaccination, there would be an estimated 64 766 000 HBV infections, 9 733 000 chronic infections, and 1 405 000 HBV-related deaths. This number of deaths is 127% greater than current number of deaths, primarily because of population increase and longer life expectancy. Similar to estimates of current HBV-related deaths, the majority (95%) of future deaths would result from chronic infection and only 5% from acute hepatitis B. Overall, 1.1% of the 2000 global birth cohort would be expected to die prematurely from HBV-related causes: 1.2% in Africa, 0.2% in the Americas, 0.7% in Eastern Mediterranean, 0.5% in Europe, 1.1% in Southeast Asia, and 2.2% in the Western Pacific.
Without vaccination, 21% of all HBV-related deaths in the 2000 birth cohort would result from perinatal HBV infection, 48% from infection acquired in the early childhood period, and 31% from infection acquired in the late period (Table 2). Regionally, the proportion of deaths from perinatal infection would range from 13 to 26%, deaths from early childhood infection from 37 to 52%, and deaths from late infection from 26 to 40%. The proportion of deaths resulting from the combination of perinatal and early childhood infection would be 69% globally, and ranged from 60 to 74% by region.
Proportion of future hepatitis B-related deaths without vaccination by age at acquisition of infection, hepatitis B disease burden model
| Age at acquisition of HBV infection | |||||
|---|---|---|---|---|---|
| Region | Perinatal (%) | Early childhood (%) | Late (%) | ||
| Africa | 18 | 52 | 30 | ||
| Americas | 23 | 37 | 40 | ||
| Eastern Mediterranean | 13 | 47 | 40 | ||
| Europe | 16 | 40 | 40 | ||
| Southeast Asia | 17 | 48 | 35 | ||
| Western Pacific | 26 | 47 | 26 | ||
| Global | 21 | 48 | 31 | ||
Disease burden sensitivity analysis
In the sensitivity analysis, current HBV-related deaths ranged from 563 000 to 677 000, 9.2% below and 9.2% above the base case estimate of 620 000 (Table 3). The model was most sensitive to changes in the prevalence of anti-HBc (at both 5 and >30 years old), HCC and cirrhosis mortality curves, and risk of progression to chronic infection. Changes in parameters related to the outcome of acute hepatitis (Figure 2b) had minimal (<1%) effect on mortality (data not shown).
Disease burden sensitivity analysis: estimates of current global hepatitis B-related deaths with changes in model parameters
| Parameter | Low Estimatea | High Estimatea | ||
|---|---|---|---|---|
| Input variablesb | ||||
| HBsAg among women of childbearing age | 602 000 | 638 000 | ||
| HBeAg among women of childbearing agec | 580 000 | 661 000 | ||
| Anti-HBc among persons 5 years old | 569 000 | 671 000 | ||
| Anti-HBc among persons ≥30 years old | 565 000 | 675 000 | ||
| Mortality curves | ||||
| Cirrhosis mortality curve | 564 000 | 675 000 | ||
| Hepatocellular carcinoma mortality curve | 568 000 | 672 000 | ||
| Risk of infection | ||||
| Risk perinatal transmission (HBeAg-positive) | 607 000 | 627 000 | ||
| Risk perinatal transmission (HBeAg-negative) | 616 000 | 624 000 | ||
| Natural history of infection | ||||
| Symptomatic acute hepatitis B | ||||
| Perinatal | 620 000 | 620 000 | ||
| Early childhood | 619 000 | 621 000 | ||
| Late | 613 000 | 627 000 | ||
| Chronic infection | ||||
| Perinatal | 593 000 | 635 000 | ||
| Early childhood | 563 000 | 677 000 | ||
| Late | 588 000 | 652 000 | ||
Base case estimate = 620 000 deaths.
Low and high estimates were calculated using values for the specific parameter 20% below and 20% above the base case estimate, with an upper bound of 100%.
HBsAg = hepatitis B surface antigen; HBeAg = hepatitis B e antigen; anti-HBc = hepatitis B core antibody.
Calculated as the prevalence of HBeAg among HBsAg-positive women.
Reduction in disease burden with hepatitis B vaccination
Routine hepatitis B vaccination of infants, without administration of a birth dose of vaccine to prevent perinatal HBV infection, would prevent up to 75% of global deaths from HBV-related causes depending on vaccination coverage for the complete series (Figure 3). As coverage increased from 50 to 80 to 90%, the proportion of deaths prevented increased from 38% to 60 to 68%. Administration of a birth dose of vaccine had a substantial impact on the proportion of HBV-related deaths prevented. With 90% complete vaccine series coverage, administration of a birth dose to 50 and 90% of the vaccinated birth cohort increased the proportion of deaths prevented to 77 and 84%, respectively. With 100% complete vaccine series coverage and 100% of infants receiving a birth dose of vaccine, it would be theoretically possible to prevent 95% of all HBV-related deaths.
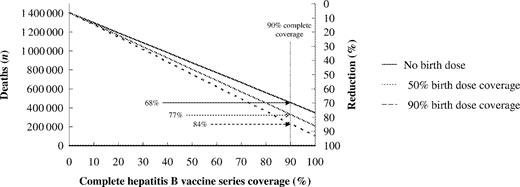
Reduction in future hepatitis B virus-related deaths with increasing hepatitis B vaccination and birth dose coverage, 2000 Global Birth Cohort
The proportional decrease in HBV-related deaths by region, with 90% complete vaccination series coverage and 0, 50, and 90% birth dose coverage is shown in Table 4. The additional reduction in deaths with 90% birth dose coverage compared to no birth dose ranged from 10% points in the Eastern Mediterranean to 20% points in the Western Pacific. The impact of the birth dose was most pronounced in the regions with the highest proportion of deaths attributable to perinatal infection.
Reduction in future hepatitis B-related deaths with 90% complete hepatitis B vaccination series coverage, with and without administration of a birth dose of vaccine: hepatitis B disease burden model
| Proportional reduction in deaths (%) | ||||||
|---|---|---|---|---|---|---|
| Region | Number of deaths in 2000 birth cohort without vaccination | No birth dose | 50% Birth dosea | 90% Birth dosea | ||
| Africa | 276 000 | 70 | 78 | 84 | ||
| Americas | 28 000 | 66 | 76 | 84 | ||
| Eastern Mediterranean | 96 000 | 74 | 80 | 84 | ||
| Europe | 56 000 | 72 | 79 | 84 | ||
| Southeast Asia | 368 000 | 71 | 78 | 84 | ||
| Western Pacific | 581 000 | 63 | 74 | 83 | ||
| Global | 1 405 000 | 68 | 77 | 84 | ||
Proportion of the vaccinated cohort receiving the first dose of vaccine within 24 h of birth.
When efficacy from one and two doses of hepatitis B vaccine were included, an additional 0–3% of global deaths were prevented compared to baseline (i.e. complete vaccination coverage), depending on the level of complete coverage (Table 5). When the first dose of vaccine was administered at birth, an additional 0–4% of deaths were prevented, depending on the level of coverage (data not shown).
Reduction in future global hepatitis B-related deaths with and without incomplete series coverage, hepatitis B disease burden model
| Proportion of global deaths prevented (%) | |||
|---|---|---|---|
| Complete series coveragea (%) | Excluding incomplete Series coverage | Including incomplete Series coverageb | |
| 10 | 8 | 8 | |
| 20 | 15 | 16 | |
| 30 | 23 | 24 | |
| 40 | 30 | 32 | |
| 50 | 38 | 40 | |
| 60 | 45 | 47 | |
| 70 | 53 | 55 | |
| 80 | 60 | 63 | |
| 90 | 68 | 71 | |
| 100 | 75 | – | |
Assumes first dose of vaccine not administered at birth (i.e. no birth dose).
Assumes an additional number of children equal to 5% of the fully-vaccinated cohort received one dose of vaccine and an additional 5% received two doses.
Discussion
Models to estimate HBV disease burden are by necessity complex because outcomes differ by age at acquisition of infection, there are acute and chronic disease conditions, and most mortality occurs many years after infection. Our model accounted for factors known to influence the natural history of HBV infection, including age-specific risk of acute and chronic infection, resolution of chronic infection over time, and difference in HCC risk among HBeAg-positive and negative persons. The model also accounted for background infant mortality and all-cause mortality, which are responsible for a substantial number of deaths, especially in developing countries. The robustness of the model was demonstrated by the sensitivity analyses which showed relatively small changes in HBV-related deaths with relatively large changes in all major parameters included in the model.
The model estimated that 620 000 HBV-related deaths occurred in 2000, the overwhelming majority from the chronic sequelae of infection (i.e. cirrhosis and HCC), and that without hepatitis B vaccination, ∼1 400 000 deaths would occur over the lifetime of the 2000 birth cohort. Differences in the current and future mortality reflect differences in the size of the birth cohort and life expectancy. The effect of changes in population demographics was reflected in the large proportional increases in future disease burden in the African and Eastern Mediterranean regions. Although early deaths from acquired immunodeficiency syndrome have resulted in shortened life expectancy in many countries of sub-Saharan Africa, the overall increase in the size of the birth cohort and increased life expectancy, especially among non-HIV-infected persons, would result in an overall increase in hepatitis B-related mortality in the region.51,52 In contrast, in the European region, the estimated future HBV-related mortality was only 10% greater than the current mortality, reflecting a birth cohort that has not increased substantially and life expectancy that is already relatively long. If the global epidemiology of HIV were to change, this could impact the future number of HBV-related deaths.
The estimates and assumptions used in the model were relatively conservative, thus the model is likely to underestimate the burden of HBV infection. Although we assumed that loss of HBsAg among persons with chronic infection did not confer a risk of death from HBV-related cirrhosis or HCC, such deaths have been reported.53 To account for these deaths, the lowest seroconversion rate from the wide range (0.5–2.5%) reported was used in the model.25–27 The model did not include the increased risk of chronic liver disease from co-infection with hepatitis C virus,29,45 the increased risk of fulminant hepatitis from HDV coinfection,54 and non-infectious etiologies of liver disease such as alcohol and aflatoxins that may increase the progression of chronic HBV infection to cirrhosis and HCC.
We constructed composite cirrhosis and HCC mortality curves from available country data. While these composite curves are likely to yield accurate estimates for regional and global mortality, country-specific mortality curves would give more refined estimates of country-specific mortality. For example, the Taiwan-specific mortality curves were higher than the Gambia-specific curves, especially among older (>50 years) persons. Similarly, few data were available regarding the attributable fraction of cirrhosis and HCC from HBV. For the Gambia, we used an attributable fraction of 53% for HCC.42 A recent study from the Gambia estimated that 60% of HCC cases were attributable to HBV infection55 and another study estimated that 68% of HCC cases in Africa were attributable to HBV, although country-specific estimates were not reported.43
The model demonstrated the potential impact of hepatitis B vaccination on HBV-related morbidity and mortality. With routine infant vaccination, up to 95% of future HBV-related deaths could be prevented, depending on complete vaccination series coverage and whether or not the first dose of vaccine was administered at birth dose to prevent perinatal infection. The impact of the birth dose would be greatest in regions with high rates of perinatal HBV transmission, and overall it could prevent an additional 16% of global HBV-related deaths. In addition, beginning the series at birth ensures protection from early childhood infection which represents the largest source of chronic infections and HBV-related deaths. If vaccine efficacy was assumed to be <95%, the efficacy used in the model, the impact of vaccination would be equal to the assumed efficacy divided by 95%. For example, assuming 90% vaccine efficacy, the reduction in HBV-related deaths would be 95% (90% divided by 95%) of the current reduction.
The increasing global use of hepatitis B vaccine is already having a substantial impact on future HBV-related mortality. Based on WHO country-specific hepatitis B vaccination coverage data from 2003, we estimate that between 537 000 and 660 000 future deaths will be prevented, depending on birth dose coverage in those countries that administer the birth dose. These latter data are not reported to WHO. This represents a 38–47% reduction in the estimated 1.4 million future HBV-related deaths in that birth cohort that would occur without vaccination. As more countries incorporate hepatitis B vaccination into their immunization programs and as coverage with the vaccination series and birth dose increase, the proportional decrease in deaths is expected to increase. Declines in HBV-related morbidity and mortality have already been demonstrated in countries with long-standing routine infant and childhood hepatitis B immunization programs. A decrease in the prevalence of chronic HBV infection among vaccinated children and adolescents has been documented throughout the world, including China, Hong Kong, Taiwan, the Gambia, Senegal, Alaska, and Italy.56–64 In the United States, which implemented routine hepatitis B vaccination in 1991, the incidence of acute hepatitis B among children and adolescents has decreased by 89%.65 In Taiwan, where routine infant hepatitis B vaccination commenced in 1984, there has been a 75% decrease in the incidence of HCC among children.66
In the model, infant vaccination was assumed to confer life-long protection from infection. While protection has been documented to last up to 15 years,56–64 the absolute duration of protection is not yet known. If protection was found to wane with time, new HBV infections could occur later in life. However, the rate of breakthrough infection (i.e. development of anti-HBc) among vaccinated persons observed in long-term studies has been low, and these infections have not resulted in clinically apparent disease and only rarely in the development of chronic infection.56–64 Such outcomes would not be expected to substantially change disease mortality from acute or chronic infection.
The model underestimated the effectiveness of hepatitis B vaccination because we did not include any benefit of an incomplete vaccination series. We did demonstrate that additional deaths could be prevented by including one and two doses of vaccine, although at the coverage levels we chose to consider, it was not substantial. Although there are no data on the duration of protection with fewer than three doses of vaccine, one and two doses should provide at least short-term protection during a time when the risk of developing chronic infection is greatest (i.e. infancy and early childhood).
The model also did not take into account the potential impact of herd immunity from infant hepatitis B vaccination.67 Although no data are available to estimate the proportion of a population that must be immune from HBV infection for there to be an effect from herd immunity, recent experience with routine infant hepatitis B vaccination among Alaska Natives and in Taiwan suggest that once HBV transmission is eliminated among young children there is a reduction in infection pressure in the general population.61,68
This model provides countries with a practical tool to estimate country-specific HBV-related morbidity and mortality and the potential impact of a national infant hepatitis B vaccination program. The model can be run on a desktop computer and has a user-friendly interface, and is available on the internet (http://aim-e-learning.stanford.edu/en/vaccines/hepb/assessBurden/model/index.html). Results generated by the model can be used to facilitate the introduction of hepatitis B vaccination and improve hepatitis B vaccination coverage in national infant immunization programs, both necessary components of a global strategy to eliminate transmission of HBV.
Appendix 1: Derivation of the number of perinatal, early childhood and late HBV infections
Appendix 2: Derivations of the cirrhosis and hepatocellular carcinoma mortality curves
A. Cirrhosis mortality curve
B. Hepatocellular carcinoma mortality curve
The prevalence of HBeAg refers to the country-specific HBeAg prevalence. Each curve was adjusted by dividing by the CRI.
| Country | Prevalence HBeAg (%) | CRI |
|---|---|---|
| China | 40 | 3.0 |
| The Gambia | 15 | 1.75 |
| Taiwan | 40 | 3.0 |
| United States | 15 | 1.75 |
| Country | Prevalence HBeAg (%) | CRI |
|---|---|---|
| China | 40 | 3.0 |
| The Gambia | 15 | 1.75 |
| Taiwan | 40 | 3.0 |
| United States | 15 | 1.75 |
| Country | Prevalence HBeAg (%) | CRI |
|---|---|---|
| China | 40 | 3.0 |
| The Gambia | 15 | 1.75 |
| Taiwan | 40 | 3.0 |
| United States | 15 | 1.75 |
| Country | Prevalence HBeAg (%) | CRI |
|---|---|---|
| China | 40 | 3.0 |
| The Gambia | 15 | 1.75 |
| Taiwan | 40 | 3.0 |
| United States | 15 | 1.75 |
Appendix 3: Vaccination program effectiveness
Appendix 4: Estimated prevalence of hepatitis B virus infection by country in the pre-vaccination Era
| Prevalence of hepatitis B virus markera | ||||||||
|---|---|---|---|---|---|---|---|---|
| Country group | Countries | HBsAg among women of childbearing age | HBeAg among women of childbearing age | Anti-HBc at 5 years old | Anti-HBc at ≥30 years old | |||
| 1 | Algeria, Angola, Benin, Burkina Faso, Cameroon, Cape Verde, Chad, Comoros, Djibouti1, Equatorial Guinea, Gabon, Gambia, Ghana, Guinea, Guinea-Bissau, Liberia, Madagascar, Mali, Mauritania, Mauritius, Niger, Nigeria, Senegal, Sierra Leone, Somalia, Sudan, Togo | 11.50 | 15.00 | 25.00 | 77.50 | |||
| 2 | Botswana, Burundi, Central African Republic, Congo (Democratic Republic of the), Congo (The Peoples Republic of), Cote d'Ivoire, Eritrea, Ethiopia, Kenya, Lesotho, Malawi, Mozambique, Namibia, Rwanda, South Africa, Swaziland, Tanzania, United Republic of, Uganda, Zambia, Zimbabwe | 11.84 | 15.00 | 25.00 | 77.50 | |||
| 3 | Canada, United States of America | 0.57 | 15.00 | 0.64 | 5.50 | |||
| 4 | Argentina, Bahamas, Barbados, Belize, Chile, Costa Rica, Cuba, El Salvador, Guyana, Honduras, Jamaica, Mexico, Panama, Paraguay, Suriname, Trinidad and Tobago, Uruguay | 1.61 | 15.00 | 1.00 | 4.00 | |||
| 5 | Brazil, Colombia, Dominican Republic, Venezuela | 1.61 | 15.00 | 3.00 | 14.00 | |||
| 6 | Bolivia, Ecuador, Guatemala, Haiti, Nicaragua, Peru | 2.01 | 15.00 | 3.00 | 14.00 | |||
| 7 | Bahrain, Cyprus, Iran, Islamic Republic of, Jordan, Kuwait, Lebanon, Libyan Arab Jamahiriya, Oman, Qatar, Saudi Arabia, Syria, Tunisia, United Arab Emirates | 2.50 | 10.00 | 6.00 | 25.00 | |||
| 8 | Egypt, Iraq, Morocco, Yemen | 4.32 | 10.00 | 10.00 | 45.00 | |||
| 9 | Austria, Belgium, Croatia, Czech Republic, Denmark, Finland, France, Germany, Greece, Iceland, Ireland, Israel, Italy, Luxembourg, Malta, Netherlands, Norway, Portugal, Slovenia, Spain, Sweden, Switzerland, United Kingdom | 0.38 | 15.00 | 0.43 | 3.70 | |||
| 10 | Albania, Armenia, Azerbaijan, Bosnia & Herzegovina, Bulgaria, Georgia, Kyrgyzstan, Macedonia (The Former Yugoslav Republic of), Poland, Romania, Slovakia, Tajikistan, Turkmenistan, Turkey, Uzbekistan, Yugoslavia, | 5.51 | 15.00 | 10.00 | 45.00 | |||
| 11 | Belarus, Estonia, Hungary, Kazakhstan, Latvia, Lithuania, Moldova, Russian Federation, Ukraine | 3.84 | 15.00 | 10.00 | 45.00 | |||
| 12 | Brunei, Indonesia, Malaysia, Philippines, Singapore, Sri Lanka, Thailand | 9.00 | 20.00 | 25.00 | 77.50 | |||
| 13 | Afghanistan, Bangladesh, Bhutan, India, Maldives, Nepal, Pakistan | 3.59 | 20.00 | 10.00 | 45.00 | |||
| 14 | Australia, Japan, New Zealand | 1.10 | 15.00 | 0.64 | 5.50 | |||
| 15 | Cambodia, China, Fiji, Hong Kong, Korea (North), Korea (South), Laos, Mongolia, Myanmar, Papua New Guinea, Solomon Islands, Taiwan, Vanuatu, Viet Nam, Western Samoa | 11.83 | 30.00 | 25.00 | 77.50 | |||
HBsAg = hepatitis B surface antigen; HBeAg = hepatitis B e antigen; anti-HBc = antibody to hepatitis B core antigen.
| Prevalence of hepatitis B virus markera | ||||||||
|---|---|---|---|---|---|---|---|---|
| Country group | Countries | HBsAg among women of childbearing age | HBeAg among women of childbearing age | Anti-HBc at 5 years old | Anti-HBc at ≥30 years old | |||
| 1 | Algeria, Angola, Benin, Burkina Faso, Cameroon, Cape Verde, Chad, Comoros, Djibouti1, Equatorial Guinea, Gabon, Gambia, Ghana, Guinea, Guinea-Bissau, Liberia, Madagascar, Mali, Mauritania, Mauritius, Niger, Nigeria, Senegal, Sierra Leone, Somalia, Sudan, Togo | 11.50 | 15.00 | 25.00 | 77.50 | |||
| 2 | Botswana, Burundi, Central African Republic, Congo (Democratic Republic of the), Congo (The Peoples Republic of), Cote d'Ivoire, Eritrea, Ethiopia, Kenya, Lesotho, Malawi, Mozambique, Namibia, Rwanda, South Africa, Swaziland, Tanzania, United Republic of, Uganda, Zambia, Zimbabwe | 11.84 | 15.00 | 25.00 | 77.50 | |||
| 3 | Canada, United States of America | 0.57 | 15.00 | 0.64 | 5.50 | |||
| 4 | Argentina, Bahamas, Barbados, Belize, Chile, Costa Rica, Cuba, El Salvador, Guyana, Honduras, Jamaica, Mexico, Panama, Paraguay, Suriname, Trinidad and Tobago, Uruguay | 1.61 | 15.00 | 1.00 | 4.00 | |||
| 5 | Brazil, Colombia, Dominican Republic, Venezuela | 1.61 | 15.00 | 3.00 | 14.00 | |||
| 6 | Bolivia, Ecuador, Guatemala, Haiti, Nicaragua, Peru | 2.01 | 15.00 | 3.00 | 14.00 | |||
| 7 | Bahrain, Cyprus, Iran, Islamic Republic of, Jordan, Kuwait, Lebanon, Libyan Arab Jamahiriya, Oman, Qatar, Saudi Arabia, Syria, Tunisia, United Arab Emirates | 2.50 | 10.00 | 6.00 | 25.00 | |||
| 8 | Egypt, Iraq, Morocco, Yemen | 4.32 | 10.00 | 10.00 | 45.00 | |||
| 9 | Austria, Belgium, Croatia, Czech Republic, Denmark, Finland, France, Germany, Greece, Iceland, Ireland, Israel, Italy, Luxembourg, Malta, Netherlands, Norway, Portugal, Slovenia, Spain, Sweden, Switzerland, United Kingdom | 0.38 | 15.00 | 0.43 | 3.70 | |||
| 10 | Albania, Armenia, Azerbaijan, Bosnia & Herzegovina, Bulgaria, Georgia, Kyrgyzstan, Macedonia (The Former Yugoslav Republic of), Poland, Romania, Slovakia, Tajikistan, Turkmenistan, Turkey, Uzbekistan, Yugoslavia, | 5.51 | 15.00 | 10.00 | 45.00 | |||
| 11 | Belarus, Estonia, Hungary, Kazakhstan, Latvia, Lithuania, Moldova, Russian Federation, Ukraine | 3.84 | 15.00 | 10.00 | 45.00 | |||
| 12 | Brunei, Indonesia, Malaysia, Philippines, Singapore, Sri Lanka, Thailand | 9.00 | 20.00 | 25.00 | 77.50 | |||
| 13 | Afghanistan, Bangladesh, Bhutan, India, Maldives, Nepal, Pakistan | 3.59 | 20.00 | 10.00 | 45.00 | |||
| 14 | Australia, Japan, New Zealand | 1.10 | 15.00 | 0.64 | 5.50 | |||
| 15 | Cambodia, China, Fiji, Hong Kong, Korea (North), Korea (South), Laos, Mongolia, Myanmar, Papua New Guinea, Solomon Islands, Taiwan, Vanuatu, Viet Nam, Western Samoa | 11.83 | 30.00 | 25.00 | 77.50 | |||
HBsAg = hepatitis B surface antigen; HBeAg = hepatitis B e antigen; anti-HBc = antibody to hepatitis B core antigen.
References
Beutels P. Economic evaluations of hepatitis B immunization: a global review of recent studies (1994–2000).
World Health Assembly. Resolution WHA 45.17. Immunization and vaccine quality. Geneva: World Health Assembly,
Centers for Disease Control and Prevention. Global progress toward universal childhood hepatitis B vaccination.
Hyams K. Risks of chronicity following acute hepatitis B virus infection: a review.
Edmunds WJ, Medley GF, Nokes DJ, Hall AJ, Whittle HC. The influence of age on the development of the hepatitis B carrier state.
World Health Report 2003: Shaping the Future. Geneva, Switzerland: World Health Organization
Centers for Disease Control and Prevention. Cause-specific adult mortality: evidence from community-based surveillance—selected sites, Tanzania, 1992–1998.
Okada K, Kamiyama I, Inomata M, Imai M, Miyakawa Y. E antigen and anti-E in the serum of asymptomatic carrier mother as indicators of positive and negative transmission of hepatitis B virus to their infants.
Beasley RP, Trepo C, Stevens CE, Szmuness W. The e antigen and vertical transmission of hepatitis B surface antigen.
Stevens CE, Neurath RA, Beasley RP, Szmuness W. HBeAg and anti-HBe detection by radioimmunoassay: correlation with vertical transmission of hepatitis B virus in Taiwan.
Beasley RP, Hwang LY, Stevens CE et al. Efficacy of hepatitis B immune globulin for prevention of perinatal transmission of the hepatitis B virus carrier state: final report of a randomized double-blind, placebo-controlled trial.
Xu ZY, Liu CB, Francis DP et al. Prevention of perinatal acquisition of hepatitis B virus carriage using vaccine: preliminary report of a randomized double-blind placebo-controlled and comparative trial.
Farmer K, Gunn T, Woodfield DG. Passive immunoprophylaxis of hepatitis B virus infection in newborn infants.
Stevens CE, Beasley P, Tsui J, Lee WC. Vertical transmission of hepatitis B antigen in Taiwan.
McMahon BJ, Alward W, Hall D et al. Acute hepatitis B virus infection: relation of age to the clinical expression of disease and subsequent development of the carrier state.
Beasley RP, Hwang LY, Lin CC et al. Incidence of hepatitis B virus infections in preschool children in Taiwan.
Beasley RP, Hwang LY, Lin CC, Ko YC, Twu SJ. Incidence of hepatitis among students at a university in Taiwan.
Scott RM, Schneider RJ, Snitbhan R, Karwacki JJ Jr. Factors relating to transmission of viral hepatitis in a United States military population stationed in Thailand.
Margolis HS, Coleman PJ, Brown RE, Mast EE, Sheingold SH, Arevalo JA. Prevention of hepatitis B virus transmission by immunization.
Karvountzis G, Redeker A, Peters R. Long-term follow-up studies of patients surviving fulminant viral hepatitis.
McMahon BJ, Holck P, Bulkow L, Snowball M. Serologic and clinical outcomes of 1536 Alaska Natives chronically infected with hepatitis B virus.
Kato Y, Nakao K, Hamasaki K et al. Spontaneous loss of hepatitis B surface antigen in chronic carriers, based on a long-term follow-up study in Goto Islands, Japan.
de Franchis R, Meucci G, Vecchi M et al. The natural history of asymptomatic hepatitis B surface antigen carriers.
Health and Vital Statistics, Republic of China (Taiwan), 1990–1999. Department of Health, Executive Yuan, Taiwan.
Tsai JF, Chang WY, Jeng JE et al. Hepatitis C virus infection as a risk factor for non-alcoholic liver cirrhosis in Taiwan.
Bell BP, Sofair A, Manos MM et al. The epidemiology of newly-diagnosed chronic liver disease in the United States. Proceedings of the 11th International Symposium on Viral Hepatitis and Chronic Liver Disease, April 6–10,
Frieden TR, Ozick L, McCord C et al. Chronic liver disease in central Harlem: the role of alcohol and viral hepatitis.
Neal JJ. The etiologic spectrum of chronic liver disease: epidemiology and health impact of all causes of chronic hepatitis and cirrhosis. Thesis. Los Angeles, CA: University of California. Ann Arbor, MI: University Microfilms,
Beasley RP, Hwang LY, Lin CC, Chien CS. Hepatocellular carcinoma and hepatitis B virus.
McQuillan GM, Coleman PJ, Kruszon-Moran D, Moyer LA, Lambert SB, Margolis HS. Prevalence of hepatitis B virus infection in the United States: the National Health and Nutrition Examination Surveys, 1976 through 1994.
Ding Z, Li R, Gong J et al. Epidemiological study on relationship between hepatitis B and liver cancer—a prospective study on development of liver cancer and distribution of HBsAg carriers and liver damage persons in Guangxi (Chinese).
Hall AJ and the Gambia Hepatitis Study Group. The Gambia hepatitis B control programme. In: Hollinger FB, Lemon SM, Margolis HS (eds). Viral Hepatitis and Liver Disease. Baltimore: Williams & Wilkins,
Beasley RP. Hepatitis B virus: the major etiology of hepatocellular carcinoma.
Cancer Registry Annual Report, Republic of China (Taiwan), 1996. Department of Health, Executive Yuan, Taiwan
McMahon BJ, Alberts SR, Wainwright RB, Bulkow L, Lanier AP. Hepatitis B-related sequelae.
Stuart KE, Anand AJ, Jenkins RL. Hepatocellular carcinoma in the United States. Prognostic features, treatment outcome, and survival.
Ryder RW, Whittle HC, Sanneh AB, Ajdukiewicz AB, Tulloch S, Yvonnet B. Persistent hepatitis B virus infection and hepatoma in The Gambia, west Africa. A case–control study of 140 adults and their 603 family contacts.
Pisani P, Parkin DM, Munoz N, Ferlay J. Cancer and infection: estimates of the attributable fraction in 1990.
Tsai JF, Jeng JE, Ho MS et al. Additive effect modification of hepatitis B surface antigen and e antigen on the development of hepatocellular carcinoma.
Sun CA, Farzadegan H, You SL et al. Mutual confounding and interactive effects between hepatitis C and hepatitis B viral infections in hepatocellular carcinogenesis: a population-based case-control study in Taiwan.
Inskip HM, Hall AJ, Chotard J, Loik F, Whittle H. Hepatitis B vaccine in the Gambian Expanded Programme on Immunization: factors influencing antibody response.
Yang HI, Lu SN, Liaw YF et al. Hepatitis B e antigen and the risk of hepatocellular carcinoma.
Centers for Disease Control. Hepatitis B virus: a comprehensive strategy for eliminating transmission in the United States through universal childhood vaccination. Recommendations of the Immunization Practices Advisory Committee (ACIP).
Anonymous. Are booster immunisations needed for lifelong hepatitis B immunity? European Consensus Group on Hepatitis B Immunity.
Andre FE. Summary of safety and efficacy data on a yeast-derived hepatitis B vaccine.
2004 World Population Data Sheet. Population Reference Bureau, Washington, DC.
Yuen MF, Wong DKH, Sablon E et al. HBsAg seroclearance in chronic hepatitis B in the chinese: virological, histological, and clinical aspects.
Kirk GD, Lesi OA, Mendy M et al. The Gambia Liver Cancer Study: Infection with hepatitis B and C and the risk of hepatocellular carcinoma in West Africa.
Mele A, Tancredi F, Romano L et al. Effectiveness of hepatitis B vaccination in babies born to hepatitis B surface antigen-positive mothers in Italy.
Wu JS, Hwang LY, Goodman KJ, Beasley RP. Hepatitis B vaccination in high-risk infants: 10-year follow-up.
Huang LM, Chiang BL, Lee CY, Lee PI, Chi WK, Chang MH. Long-term response to hepatitis B vaccination and response to booster in children born to mothers with hepatitis B e antigen.
Liao SS, Li RC, Li H et al. Long-term efficacy of plasma-derived hepatitis B vaccine: a 15-year follow-up study among Chinese children.
Whittle H, Jaffar S, Wansbrough M et al. Observational study of vaccine efficacy 14 years after trial of hepatitis B vaccination in Gambian children.
Lin HH, Wang LY, Hu CT et al. Decline of hepatitis B carrier rate in vaccinated and unvaccinated subjects: sixteen years after newborn vaccination program in Taiwan.
Yuen MF, Lim WL, Cheng CC, Lam SK, Lai CL. Twelve-year follow-up of a prospective randomized trial of hepatitis B recombinant DNA yeast vaccine versus plasma-derived vaccine without booster doses in children.
Coursaget P, Leboulleux D, Soumare M et al. Twelve-year follow-up study of hepatitis B immunization of Senegalese infants.
McMahon BJ, Bruden DL, Petersen KM et al. Antibody levels and protection after hepatitis B vaccination: results of a 15-year follow-up.
Centers for Disease Control. Acute hepatitis B among children and adolescents—United States, 1990–2002.
Chang MH, Chen CJ, Lai MS et al. Universal hepatitis B vaccination in Taiwan and the incidence of hepatocellular carcinoma in children. Taiwan Childhood Hepatoma Study Group.

