


Abstract
The aim of this meta-analysis was to compare outcomes of patients undergoing transcatheter aortic valve implantation (TAVI) with those undergoing surgical aortic valve replacement using sutureless valves.
A systematic review and meta-analysis in accordance with the Preferred Reporting Items for Systematic Reviews and Meta-Analyses (PRISMA) statement was performed.
No randomized controlled trials were identified. Six comparative studies using propensity score matching met the inclusion criteria. This meta-analysis identified 1462 patients in that 731 patients underwent surgical aortic valve replacement using sutureless valves (SU) and 731 patients underwent a TAVI. The 30-day or in-hospital mortality was lower in the SU group [odds ratio (OR) 0.54, 95% confidence interval (CI) 0.36–0.80; P = 0.003]. In the TAVI group, the incidence of postoperative stroke was higher (OR 0.36, 95% CI 0.17–0.79; P = 0.01). The incidence of moderate or severe paravalvular regurgitation was higher in the TAVI group (OR 0.22, 95% CI 0.14–0.35; P = 0.001). There were neither differences in the postoperative renal failure (OR 1.44, 95% CI 0.46–4.58; P = 0.53) nor in the number of patients requiring postoperative pacemaker implantation (OR 1.06, 95% CI 0.54–2.08; P = 0.86). Patients in the SU group required more transfusions (OR 4.47, 95% CI 2.77–7.21; P = 0.0001), whereas those in the TAVI group had higher major vascular complications (OR 0.06, 95% CI 0.01–0.25; P = 0.0001). Intensive care unit stay was not different (mean difference 0.99, 95% CI − 1.22 to 1.40; P = 0.53). One-year survival was better in the SU group (Peto OR 0.35, 95% CI 0.18–0.67; P = 0.001), as was the 2-year survival (Peto OR 0.38, 95% CI 0.17–0.86; P = 0.001).
Surgical aortic valve replacement using sutureless valves is associated with better early and mid-term outcomes compared with TAVI in high- or intermediate-risk patients.
INTRODUCTION
Severe aortic stenosis is the most common valvular heart disease with a prevalence of 2.8% in adults older than 75 years. Aortic valve replacement (AVR) using a biological valve prosthesis is the conventional treatment option for severe aortic stenosis. Nevertheless, in recent years, other therapeutic strategies have been developed with the aim of reducing mortality and morbidity as well as the invasiveness of surgical procedure. Transcatheter aortic valve implantation (TAVI) has been emerged as a valuable therapeutic tool in high-risk patients or in those patients ineligible for a surgical operation [1]. Nevertheless, sutureless or rapid-deployment aortic valves in combination with a minimally invasive approach have shown excellent outcomes, allowing a reduction of myocardial ischaemia and cardiopulmonary bypass times compared with conventional surgery [2]. Several studies have reported controversial results when these 2 treatment options were compared in high- and intermediate-risk patients. However, no randomized controlled trials (RCTs) have been designed. Therefore, we conducted a meta-analysis of statistically sound studies to evaluate surgical outcomes of patients undergoing TAVI versus surgical aortic valve replacement (SAVR) using sutureless valves (SU-AVR).
MATERIALS AND METHODS
Data sources and search strategy
We performed a systematic review and a meta-analysis in accordance with the standards set forth by the Preferred Reporting Items for Systematic Reviews and Meta-Analyses (PRISMA) statement. We searched the PubMed, the EMBASE and the Cochrane Collaboration databases using the keyword ‘sutureless’ AND ‘aortic valve’, ‘bioprosthesis’ AND ‘aortic valve’, ‘rapid deployment’ AND ‘aortic valve’, ‘aortic valve’ AND ‘surgery’ AND ‘transcatheter valve replacement’ AND ‘transcatheter valve implantation’ OR ‘operation’ OR ‘replacement’. In addition, we hand searched the references of retrieved articles and used the articles related to the PubMed database feature to identify studies not captured by our primary search strategy. The search was limited to trials involving human subjects, and no language restriction was imposed. The final search was run on 31 December 2016.
Study selection
We included only comparative studies that enrolled patients at intermediate and high operative risk who were treated with sutureless aortic valve or TAVI, with at least 1 matching technique (propensity score-matched study). Once full articles were retrieved, studies were further excluded if there was an overlap in patients from other studies within the same analysis. In this case, the largest sample size was selected. Thus, although some patients could possibly have been included in both controlled and uncontrolled study analyses, they were only included once in any given analysis. Consequently, there was no overlap in patients in our meta-analyses.
Date extraction, quality and risk-of-bias assessment
Two reviewers (M.M. and A.M.) evaluated each article separately. Disagreements were resolved by discussion with a third party (M.G.).
The quality of studies was examined using the method recommended by a Cochrane Collaboration tool for assessing risk of bias in the included studies. We extracted data pertaining to baseline characteristics of study subjects, trial inclusion and exclusion criteria, postoperative complications, maximal length of follow-up and mortality.
Outcomes
The primary end-point was 30-day mortality or in-hospital all-cause mortality. Secondary end-points were the following: (i) postoperative renal failure, (ii) postoperative stroke, (iii) postoperative transvalvular mean gradient, (iv) postoperative paravalvular leak (PVL), (v) postoperative pacemaker implantation, (vi) 1-year mortality and (vii) 2-year mortality.
Statistical analysis
Meta-analysis of early outcomes
This meta-analysis was conducted by searching for any differences in mortality between the SU group and the TAVI group. The results from all of the relative studies were combined to estimate the odds ratios (ORs) and associated 95% confidence intervals (CIs) for dichotomous outcomes. With respect to the continuous outcomes, weighted mean differences and 95% CIs were estimated as the effect results. The I2 statistic was used to test for heterogeneity, and studies were considered to have low (I2 = 25–49%), moderate (I2 = 50–74%) or high (I2 ≥ 75%) heterogeneity. Thus, an I2 ≥ 50% indicates significant heterogeneity. In such cases, a random-effect model was used, whereas an inverse variance method of fixed-effect model was used when the outcome had no significant heterogeneity (I2 < 50%). Whenever heterogeneity was present, we performed sensitivity analyses to investigate the influence of a single study by excluding 1 study in each turn. Publication bias was assessed by funnel plot using mortality as an end-point. A value of P < 0.05 was considered to be statistically significant in this meta-analysis. Statistical analyses were performed using Review Manager 5 software (RevMan 5, The Cochrane Collaboration, Oxford, UK).
Meta-analysis of late outcomes
The Kaplan–Meier curves were digitalized using a dedicated software (Plot Digitizer). Using the software, the axes were defined, and the curve was read point by point. The Kaplan–Meier data reconstruction was employed to derive individual patient data. We measured the recurrence rate, a type of time-to-event data, with the statistic hazard ratio (HR) and its 95% CIs. Based on the article by Tierney et al. [7], ‘observed–expected events research (O-E)’ and ‘variance (V)’ were generated from HRs obtained from various sources, which may be presented as number of recurrence, a Kaplan–Meier curve or others. We analysed the transformed data in RevMan 5.2 and used the statistical method exp [(O-E)/V] to calculate the HR and to implement the time-to-event data analysis with a fixed-effect model.
Meta-regression analysis
To evaluate the effects of preoperative and postoperative parameters on outcome, we performed mixed-effects (unrestricted maximum likelihood) meta-regression analyses. The meta-regression coefficient (slope of meta-regression line) shows the estimated increase in logarithmic OR per unit increase in the covariate. Because logarithmic OR exceeding 0 corresponds to OR exceeding 1 and logarithmic OR of less than 0 corresponds to OR of less than 1, a negative coefficient would indicate that as the given factor increases, the OR decreases. All meta-regression analyses were conducted using Open Meta Analyst software [3].
RESULTS
Characteristics of the included study
The study selection process is shown in Fig. 1. After exclusion of duplicate or irrelevant references, 104 potentially relevant articles were retrieved. After detailed evaluation, 6 comparative ‘statistically sound’ studies [4–10] met the inclusion criteria and were included in this meta-analysis.
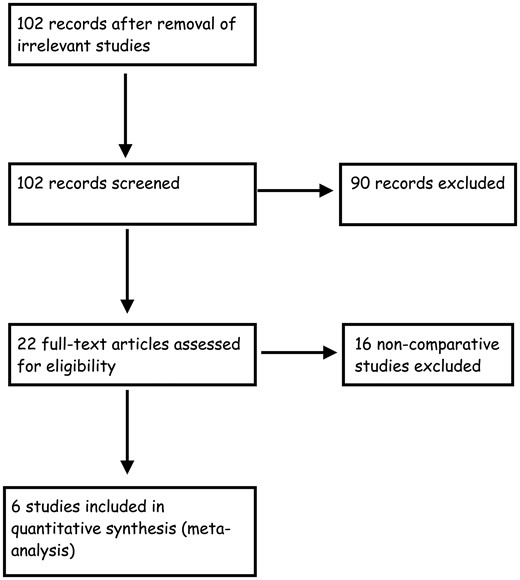
Study selection process.
This meta-analysis identified 1462 patients in that 731 patients underwent SU-AVR sutureless valve and 731 patients underwent a TAVI procedure. A list of included studies with their characteristics and quality assessment is shown in Table 1 and Supplementary Material, Fig. S1.
List of included studies
| First author | Year | Institution | Study period | Type of study | Number of sutureless valves | Number of TAVI | Mean follow-up SU (months) | Mean follow-up TAVI (months) |
|---|---|---|---|---|---|---|---|---|
| Muneretto | 2014 | University of Brescia, Italy | Oct 2010–Feb 2013 | PSM | 204 | 204 | 1.9 ± 0.6 | 2 ± 0.8 |
| Biancari | 2015 | 6 European centres | Jun 2007–Apr 2014 | PSM | 144 | 144 | None | None |
| Miceli | 2015 | Fondazione Monasterio, Massa Italy | Oct 2004–Mar 2013 | PSM | 37 | 37 | Not indicated | Not indicated |
| Kamperidis | 2015 | Leiden University Medical Center, Netherlands | Nov 2007–Feb 2013 | PSM | 40 | 40 | 1.5 ± 0.9 | 1.5 ± 0.8 |
| D’Onofrio | 2016 | 6 European centres/Italian Registry of TAVI | 2010–2014 | PSM | 206 | 206 | None | None |
| Santarpino | 2015 | Paracelsus Medical University, Nuremberg, Germany | 2010–2014 | PSM | 102 | 102 | 23 ± 14 | 24 ± 13 |
PSM: propensity score matching; SU: surgical aortic valve replacement using sutureless valves; TAVI: transcatheter aortic valve implantation.
Patient characteristics
The preoperative characteristics are shown in Table 2. The preoperative risk was estimated using the logistic EuroSCORE I and showed no differences between the 2 groups. All other analysed preoperative variables were not different between the 2 groups (Supplementary Material, Figs S2–S12).
Patient preoperative characteristics
| Sutureless | TAVI | OR (95% CI)/(WMD) | P-value | |
|---|---|---|---|---|
| Female gender (%) | 48.25 | 50 | 0.93 (0.75 to 1.15) | 0.48 |
| Preoperative renal insufficiency (%) | 26.6 | 29.2 | 0.88 (0.69 to 1.129) | 0.29 |
| Hypertension (%) | 80 | 73.6 | 1.29 (0.60 to 2.78) | 0.51 |
| Redo (%) | 9.48 | 12 | 0.77 (0.54 to 1.09) | 0.13 |
| Diabetes | 20.63 | 20.70 | 0.99 (0.75 to 1.30) | 0.94 |
| CAD (%) | 9 | 10.2 | 0.86 (0.58 to 1.26) | 0.43 |
| Extracardiac arteriopathy (%) | 19.4 | 18.4 | 1.07 (0.82 to 1.4) | 0.63 |
| NYHA Class III–IV (%) | 68.6 | 68.6 | 1 (0.78 to 1.28) | 1 |
| LVEF (%), mean ± SD | 55.2 ± 8.6 | 54.7 ± 6.8 | 0.78 (−1.07 to 2.62) | 0.41 |
| Age (years), mean ± SD | 78.96 ± 4.6 | 78.91 ± 6 | −0.16 (−0.90 to 0.57) | 0.66 |
| EuroSCORE, mean ± SD | 15.45 ± 9 | 15.58 ± 8.1 | −0.36 (−1.11 to 0.40) | 0.35 |
CAD: coronary artery disease; CI: confidence interval; LVEF: left ventricular ejection fraction; NYHA: New York Heart Association; OR: odds ratio; TAVI: transcatheter aortic valve implantation; WMD: weighted mean difference.
Postoperative outcomes
All postoperative data are reported in Table 3.
Postoperative data
| SU-AVR | TAVI | P-value | |
|---|---|---|---|
| 30-days mortality (%) | 24/741 (3.23) | 44/741 (5.93) | 0.01 |
| Postoperative stroke (%) | 12/741 (1.61) | 27/741 (3.64) | 0.01 |
| Postoperative aortic regurgitation (%) | 21/731 (2.8) | 133/731 (18.19) | 0.001 |
| Postoperative AKI (%) | 35/527 (6.51) | 37/527 (6.89) | 0.8 |
| Pacemaker implantation (%) | 69/741 (9.31) | 70/741 (9.44) | 0.9 |
| Transfused patients (%) | 88/426 (20.6) | 26/424 (6.1) | 0.001 |
| Vascular complications (%) | 0/490 (0) | 41/490 (8.36) | 0.001 |
AKI: acute kidney injury.
Pooled analysis of the 6 studies demonstrated that 30-day or in-hospital all-cause mortality was significantly lower in the SU group (OR 0.54, 95% CI 0.36–0.80; P = 0.003, I2 = 3%; Fig. 2A).
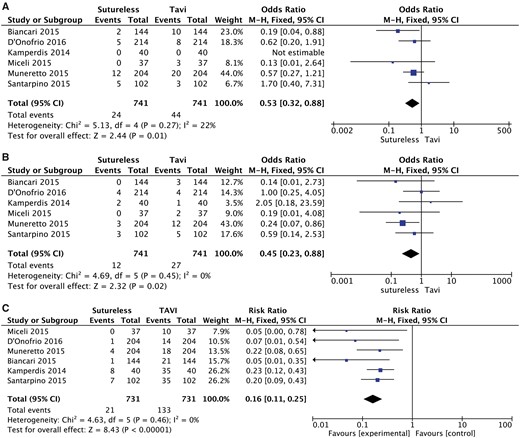
A meta-analysis of studies assessing the effect of the type of prosthesis on (A) postoperative mortality, (B) postoperative stroke and (C) postoperative aortic regurgitation. CI: confidence interval; df: degree of freedom; M-H: Mantel-Haenszel; TAVI: transcatheter aortic valve implantation.
In the TAVI group, the incidence of postoperative stroke was significantly higher (OR 0.36, 95% CI 0.17–0.79; P = 0.01, I2 = 0%; Fig. 2B). The incidence of moderate or severe paravalvular regurgitation was significantly higher in the TAVI group (OR 0.22, 95% CI 0.14–0.35; P = 0.001, I2 = 0%; Fig. 2C).
There were neither differences in the incidence of postoperative renal failure (OR 1.44, 95% CI 0.46–4.58; P = 0.53; Fig. 3A) nor in the number of patients requiring postoperative pacemaker implantation (OR 1.06, 95% CI 0.54–2.08, P = 0.86; Fig. 3B). The SU group patients required more transfusions (OR 4.47, 95% CI 2.77–7.21, P = 0.0001; Fig. 3C), whereas patients in the TAVI group had significantly more major vascular complications (OR 0.06, 95% CI 0.01–0.25, P = 0.0001; Fig. 3D). Intensive care unit stay was not significantly different between the 2 groups (mean difference 0.99, 95% CI −1.22 to 1.40; P = 0.53; Fig. 3E).
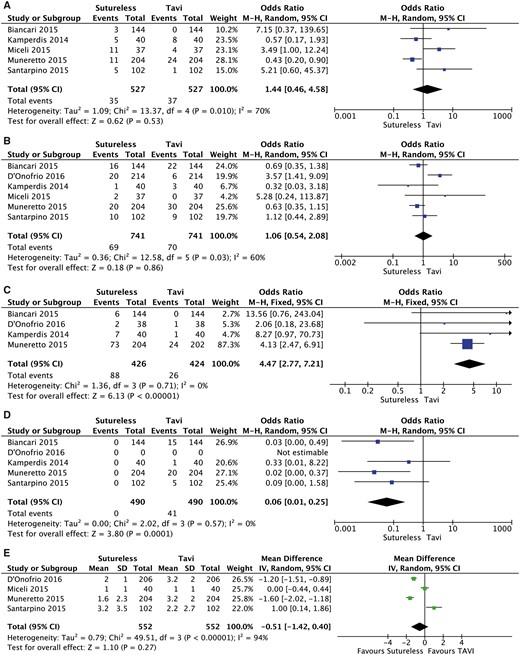
A meta-analysis of studies assessing the effect of the type of prosthesis on (A) postoperative renal failure, (B) postoperative pacemaker implantation, (C) postoperative blood transfusions, (D) postoperative vascular complications and (E) postoperative intensive care unit stay. CI: confidence interval; df: degree of freedom; M-H: Mantel-Haenszel; TAVI: transcatheter aortic valve implantation.
Meta-regression (Supplementary Material, Fig S14) did not show a significant relationship among postoperative mortality, post-procedural aortic regurgitation (AR) and periprocedural stroke. Moreover, we did not find any significant difference between post-procedural AR and stroke or postoperative acute kidney injury (Supplementary Material, Fig. S17).
Follow-up data
One-year survival was significantly better in the SU group (Peto OR 0.35, 95% CI 0.18–0.67; P = 0.001, I2 = 0%; Fig. 4A), as was the 2-year survival (Peto OR 0.38, 95% CI 95% 0.17–0.86; P = 0.001, I2 = 0%; Fig. 4B).
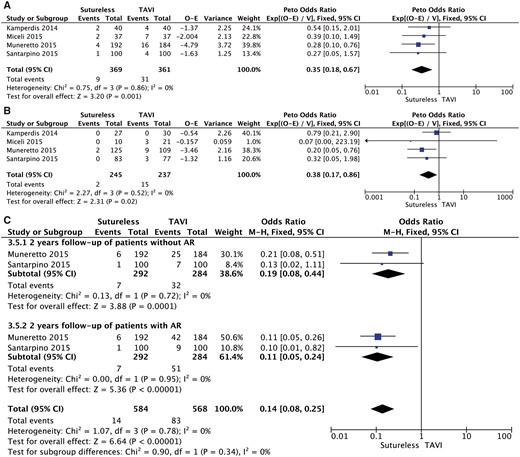
A meta-analysis of studies assessing the effect of the type of prosthesis on (A) 1-year mortality, (B) 2-year mortality and (C) meta-analysis of studies assessing the effect of postoperative aortic regurgitation on 2-year mortality. AR: aortic regurgitation; CI: confidence interval; df: degree of freedom; O-E: observed–expected values; TAVI: transcatheter aortic valve implantation; M-H: Mantel-Haenszel; V: variance.
The analysis of the effect of post-procedural AR showed an increased logarithmic OR in the group of patients with post-procedural AR, although this was not statistically significant (Fig. 4C). However, in the 2 studies, in which the follow-up of patients with mild post-procedural AR was also reported, we found that the presence of AR was associated with excess mortality at 2 years (Fig. 4D).
Publication bias
Inspection of the funnel plot (Fig. 5) did not show significant asymmetry for all-cause mortality. Trim-and-fill analysis indicated that no studies were missing. These results suggest that publication bias was not a significant influencing factor.
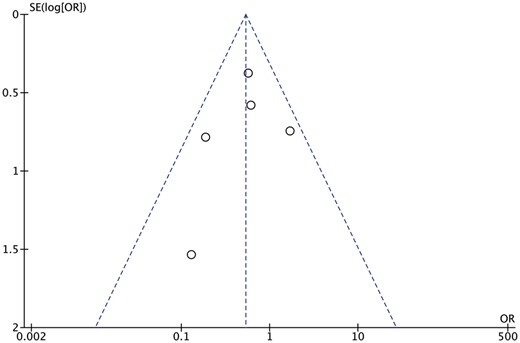
Funnel plot of postoperative mortality.
DISCUSSION
This meta-analysis shows that patients undergoing AVR using the sutureless technology experienced better outcomes than those undergoing the TAVI procedures. Specifically, we found that a 50% risk reduction in early all causes of death and a 65% and 62% risk reduction in 1- and 2-year and mortality, respectively. In addition, the use of a sutureless valve was associated with lower incidences of stroke and major vascular complications, whereas the TAVI group was associated with increased risk for moderate and severe aortic paravalvular regurgitation. Finally, we found that the post-procedural moderate-to-severe AR was associated with higher mortality at 2 years. No differences were found in the other secondary outcomes.
Recent RCTs comparing TAVI with conventional SU-AVR validated the role of TAVI in patients with a high surgical risk [1, 11, 12]. Conversely, the role of TAVI in intermediate- and low-risk patients is still under discussion. Nevertheless, these trials have shown a high rate of postoperative complications, such as stroke, vascular complication, moderate-to-severe post-procedural AR and need for new pacemaker implantation compared to patients who underwent SAVR [13].
On the other hand, minimally invasive strategies have raised interest in the development of sutureless valves to standardize the surgical implantation procedure and reduce the operative times. Furthermore, sutureless valves have shown to facilitate the minimally invasive approach by further reducing the cross-clamp and the cardiopulmonary bypass times. Several studies have shown the potential advantages of sutureless valves in high- and intermediate-risk patients, suggesting that a minimally invasive AVR approach with a sutureless valve might be a real alternative to TAVI technology [14]. Interestingly, no RCTs have been designed; therefore, we aimed to compare the surgical outcomes of statistically sound studies using propensity score matching of these 2 sample populations. TAVI has been compared with SAVR in 4 RCTs, which enrolled patients at high operative risk [1, 15] and lower-than-high operative risk [16, 17]. These trials demonstrated that TAVI is an effective alternative therapy in the treatment of severe aortic stenosis compared with SAVR, but the only trial demonstrating a survival benefit was not powered for the primary end-point or for all-cause mortality [18]. Furthermore, 2 recent meta-analyses concluded that TAVI was likely to be ineffective in reducing early and mid-term all-cause mortality in high-risk patients compared with SAVR [19, 20]. Moreover, the outcomes of intermediate-risk patients undergoing either AVR or TAVI are still inconclusive. Siemieniuk et al. [21], analysing the results of the 4 RCTs on TAVI versus SAVR in patients with a Society of Thoracic Surgeons (STS) score less than 8%, concluded that SAVR improved the symptoms of heart failure and reduced the risk for aortic valve reintervention, pacemaker insertion and paravalvular leakage, whereas TAVI reduced the risk for bleeding, atrial fibrillation and recovery time. Similar results were reported by the most recent SURTAVI trial [22]. However, these studies focused on patients receiving a conventional SAVR with a sutured valve. On the other hand, available evidence suggests that the use of sutureless valves is associated with decreased operative time, ventilation time, intensive care unit stay and hospital stay as well as fewer postoperative complications [2, 23–26].
In light of these results, sutureless valves might improve outcomes in those patients who are still considered in the grey zone and who might be beneficial of a surgical approach instead of TAVI procedure. Recently, we described our experience with sutureless valves, and we showed a 35–40% reduction of operative times compared with the stented valves [27]. As a result, the good haemodynamic performances as well as the low rate of postoperative complications and PVLs have made this procedure a valid alternative to the emerging TAVI technology in high-risk patients eligible for surgery. Compared with TAVI, the surgical approach has the advantage of removing the calcified stenotic valve, and therefore, it may reduce the risk for neurological events and PVL. These events have been associated with worse long-term outcomes. PVL is now considered a negative outcome, because it has been demonstrated that even the presence of mild regurgitation is associated with lower survival at 5 years [1].
On the basis of current available data, we have to sound a word of caution in extending TAVI to medium–low-risk patients. Sutureless AVR may offer a significant advantage, allowing for a complete removal of the diseased aortic valve and avoiding suturing stiches through the aortic annulus. This results in a surgical reduction of cardiopulmonary bypass and aortic cross-clamp, which are well-recognized determinants of the morbidity and mortality observed in cardiac surgery [28, 29].
A recent meta-analysis [30] comparing TAVI and SAVR concluded that TAVI has a similar clinical efficacy to SAVR in intermediate-risk patients and can be a suitable alternative to surgical valve replacement. These conclusions are different from our meta-analysis. In this regard, Sardar et al. [30] analysed non-homogenous studies that may represent a potential bias for the final conclusions. Specifically, they included studies reporting sutureless valves, stented valves, conventional surgery and different minimally invasive approaches. Conversely, our article mainly focused on propensity-matched studies comparing sutureless valves through a minimally invasive approach with TAVI, which may represent a fairer comparison between groups.
Trials aiming to demonstrate the benefit of extending TAVI to low-risk patients are currently ongoing, and we await the results. However, in light of our results, a well-designed study should perform a comparison between the novel sutureless technology, possibly through a minimally invasive approach, and the newest TAVI valves.
Limitations
The limitations of this meta-analysis deserve careful consideration. The absence of RCTs and the relatively low number of patients included in this meta-analysis are the main limitations of our study. All included studies used propensity score matching. Furthermore, the analysed data did not allow for a subanalysis on the basis of a transapical or transfemoral approach.
Despite the absence of overt biases and the use of propensity matching techniques, we cannot consider these studies equivalent to RCT.
Therefore, the results should be always carefully interpreted when they are included in systematic reviews and meta-analyses. Particular concerns arise with respect to differences between patients in different intervention groups (selection bias) and studies that do not explicitly report a protocol (reporting bias). Unlike for randomized trials, it would usually be appropriate to analyse adjusted, rather than unadjusted, effect estimates (i.e. analyses that attempt to control for confounding). To reduce the effect of treatment selection bias and potential confounding in observational studies, rigorous adjustment for significant differences in the baseline characteristics of patients should be conducted. Further, not unadjusted but adjusted estimates have to be pooled in a meta-analysis that includes observational studies. In this meta-analysis, we strictly selected and then included only adjusted ORs or HRs for all-cause mortality, using appropriate statistical methods from observational studies. Furthermore, our results may be influenced by a publication bias favouring TAVI. This risk was minimized through an exhaustive search of the available literature in our analysis. Since the statistical tests did not indicate publication bias, there is limited power to detect such bias, given the small number of studies examined.
SUPPLEMENTARY MATERIAL
Supplementary material is available at ICVTS online.
Conflict of interest: Mattia Glauber, Antonio Miceli and Matteo Ferrarini are consultants for educational activities for Sorin. Massimo Meco, Andrea Montisci, Francesco Donatelli, Silvia Cirri and Antonio Lio have no conflict of interest to declare.
REFERENCES
Open Meta-Analyst. http://www.cebm.brown.edu/open_meta (21 February 2017, date last accessed).
Author notes
Massimo Meco, AntonioMiceli and Andrea Montisci contributed equally to this work.
