


Abstract
What effect does maternal age have on the human oocyte's molecular response to in vitro oocyte maturation?
Although polyadenylated transcript abundance is similar between young and advanced maternal age (AMA) germinal vesicle (GV) oocytes, metaphase II (MII) oocytes exhibit a divergent transcriptome resulting from a differential response to in vitro oocyte maturation.
Microarray studies considering maternal age or maturation stage have shown that either of these factors will affect oocyte polyadenylated transcript abundance in human oocytes. However, studies considering both human oocyte age and multiple stages simultaneously are limited to a single study that examined transcript levels for two genes by qPCR. Thus, polyadenylated RNA sequencing (RNA-Seq) could provide novel insight into age-associated aberrations in gene expression in GV and MII oocytes.
The effect of maternal age (longitudinal analysis) on polyadenylated transcript abundance at different stages was analyzed by examining single GV and single in vitro matured MII oocytes derived from five young (YNG; < 30 years; average age 26.8; range 20–29) and five advanced maternal age (AMA; ≥40 years; average age 41.6 years; range 40–43 years) patients. Thus, a total of 10 YNG (5 GV and 5 MII) and 10 AMA (5 GV and 5 MII) oocytes were individually processed for RNA-Seq analysis.
Patients undergoing infertility treatment at the Colorado Center for Reproductive Medicine (Lone Tree, CO, USA) underwent ovarian stimulation with FSH and received hCG for final follicular maturation prior to ultrasound guided oocyte retrieval. Unused GV oocytes obtained at retrieval were donated for transcriptome analysis. Single oocytes were stored (at −80°C in PicoPure RNA Extraction Buffer; Thermo Fisher Scientific, USA) immediately upon verification of immaturity or after undergoing in vitro oocyte maturation (24 h incubation), representing GV and MII samples, respectively. After isolating RNA and generating single oocyte RNA-Seq libraries (SMARTer Ultra Low Input RNA HV kit; Clontech, USA), Illumina sequencing (100 bp paired-end reads on HiSeq 2500) and bioinformatics analysis (CLC Genomics Workbench, DESeq2, weighted gene correlation network analysis (WGCNA), Ingenuity Pathway Analysis) were performed.
A total of 12 770 genes were determined to be expressed in human oocytes (reads per kilobase per million mapped reads (RPKM) > 0.4 in at least three of five replicates for a minimum of one sample type). Differential gene expression analysis between YNG and AMA oocytes (within stage) identified 1 and 255 genes that significantly differed (adjusted P < 0.1 and log2 fold change >1) in polyadenylated transcript abundance for GV and MII oocytes, respectively. These genes included CDK1, NLRP5 and PRDX1, which have been reported to affect oocyte developmental potential. Despite the similarity in transcript abundance between GV oocytes irrespective of age, divergent expression patterns emerged during oocyte maturation. These age-specific differentially expressed genes were enriched (FDR < 0.05) for functions and pathways associated with mitochondria, cell cycle and cytoskeleton. Gene modules generated by WGCNA (based on gene expression) and patient traits related to oocyte quality (e.g. age and blastocyst development) were correlated (P < 0.05) and enriched (FDR < 0.05) for functions and pathways associated with oocyte maturation.
Raw data from this study can be accessed through GSE95477.
The human oocytes used in the current study were obtained from patients with varying causes of infertility (e.g. decreased oocyte quality and oocyte quality-independent factors), possibly affecting oocyte gene expression. Oocytes in this study were retrieved at the GV stage following hCG administration and the MII oocytes were derived by IVM of patient oocytes. Although the approach has the benefit of identifying intrinsic differences between samples, it may not be completely representative of in vivo matured oocytes.
Transcriptome profiles of YNG and AMA oocytes, particularly at the MII stage, suggest that aberrant transcript abundance may contribute to the age-associated decline in fertility.
J.M.R. was supported by an Austin Eugene Lyons Fellowship awarded by the University of California, Davis. The Eunice Kennedy Shriver National Institute of Child Health and Human Development of the National Institutes of Health (awarded to P.J.R.; R01HD070044) and the Fertility Laboratories of Colorado partly supported the research presented in this manuscript.
Introduction
Oocyte quality (the ability to support early embryo development and produce live offspring) declines with increasing maternal age resulting in reduced fertility (Navot et al., 1991). Increased aneuploidy rates exhibited by oocytes obtained from older women (and mice) is one contributing factor to diminished oocyte and embryo developmental potential, in turn, affecting pregnancy outcomes (Sandalinas et al., 2002; Mai et al., 2013; Treff et al., 2016). Although many cases of infertility are attributable to aneuploidy, other underlying contributing factors may include mitochondrial dysfunction and abnormal gene expression. Compromised mitochondrial function characteristic of older oocytes stems from various aberrations including but not limited to mtDNA damage, changes in mitochondrial gene expression and dynamics, and decreases in mitochondrial membrane potential (reviewed by (Schatten et al., 2014)). Additionally, human MII oocyte transcriptome studies have demonstrated age-related differences in transcript abundance (Grondahl et al., 2010).
Fully grown GV oocytes contain stores of necessary transcripts produced during the oocyte growth phase, which upon induction of oocyte maturation undergo coordinated translation and degradation (Su et al., 2007). Consequently, despite being transcriptionally quiescent, maturing and MII oocytes can modulate synthesis of essential proteins by controlling transcript poly(A) tail length that, in turn, affects transcript translational state. Thus, inspection of polyadenylated transcript abundance enables identification of essential biological processes for oocyte maturation and subsequent embryo development.
Using oligo(dT)-based reverse transcription, single murine oocyte RNA sequencing (RNA-Seq) was accomplished (Tang et al., 2009) and has since been implemented for human (MII) and cow (GV and MII) oocyte investigations (Xue et al., 2013; Yan et al., 2013; Reyes et al., 2015). In the current study, examination of single human GV and MII oocytes derived from patients of young (YNG) and advanced maternal age (AMA) was conducted to identify differences in transcript abundance between age groups, enabling elucidation of affected biological processes and transcripts related to aging. Maturing patient GV oocytes in vitro under identical conditions, enables identification of the intrinsic differences in the samples rather than capturing differences derived from the varying maternal environments unique to each patient. However, the study limitations included a small sample size (n = 5 oocytes per treatment) and use of oocytes derived from patients with varying causes of infertility.
Materials and Methods
Ethical approval
The study was approved by the Western Institutional Review Board (IRB#1151520). Patients undergoing infertility treatment via IVF, including the use of donor oocytes, at the Colorado Center for Reproductive Medicine (Lone Tree, CO, USA) provided informed consent that materials not used and normally discarded during the IVF cycle could be used for research.
Patient treatment
Patients underwent ovarian stimulation with FSH and received hCG for final follicular maturation. After ultrasound guided oocyte retrieval, the oocytes were partially denuded and examined to determine maturation status. Given that only MII oocytes can undergo fertilization and that in vitro matured oocytes are less likely to produce live offspring, immature GV oocytes excluded from the patient treatment cycle were used in this study. Mature oocytes from the same cohort underwent IVF and the treatment cycle results, along with corresponding patient information, were recorded (Supplementary Table SI). Oocytes from five YNG (<30 years; average age 26.8; range 20–29) and five AMA (≥40 years; average age 41.6 years; range 40–43 years) women were included in the study.
Germinal vesicle and in vitro matured MII oocyte collection
A single verified GV and a single in vitro matured MII oocyte were collected from each of the five YNG and five AMA patients, which were subsequently processed as individual oocytes for library preparation (total single oocyte libraries = 20) and transcriptome analysis as described below. Immature oocytes from each patient were visually assessed to confirm the presence of a GV in at least two oocytes. GV oocytes were either processed immediately as individual GV samples, or placed into maturation medium for 24 h (6% CO2, 5% O2, 37°C). Maturation medium was supplemented with human recombinant brain-derived neurotrophic factor (3 ng/ml; Sigma-Aldrich, USA), human recombinant FSH (0.1 IU/ml, Gonal F; EMD Serono, USA), estradiol (1 μg/ml; Sigma-Aldrich, USA), human recombinant epidermal growth factor (10 ng/ml; Sigma-Aldrich, USA), human recombinant bone morphogenetic protein 15 (100 ng/ml; R&D Systems, USA), and human serum albumin (5 mg/ml; Cooper Surgical, USA). After incubation, oocytes were examined for the presence of a polar body to confirm maturation and then processed individually as MII samples.
Individual GV and MII human oocytes were exposed to hyaluronidase (80 units/ml; Sigma-Aldrich, USA) and manipulated with a Stripper (Origio, USA) tip to remove all remaining cumulus cells, and then washed three times in Dulbecco's phosphate buffered saline with 0.01% polyvinylpyrrolidone (Sigma-Aldrich, USA). Samples were stored in PicoPure RNA extraction buffer (10 μl), heated to 42°C for 30 min, and subsequently stored at −80°C until total RNA purification as per manufacturer's protocol (Thermo Fisher Scientific, USA).
cDNA synthesis and amplification, library preparation, and sequencing
The PicoPure RNA Isolation kit was utilized to isolate total RNA from individual GV and MII oocytes as per the manufacturer's protocol (Thermo Fisher Scientific, USA), which included RNAse-free DNAse treatment (Qiagen, USA). RNA eluate (9 μl/sample) was used as input for cDNA synthesis and amplification with the SMARTer Ultra Low Input RNA HV kit (Clontech, USA) following manufacturer recommendations with 13 cycles of PCR amplification. cDNA quantity and quality were evaluated with a Qubit 1.0 fluorometer (Thermo Fisher Scientific, USA) and 2100 Bioanalyzer system (Agilent Technologies, USA), respectively.
Following cDNA fragmentation with a Covaris S2 sonicator (Duty%: 10, Intensity: 5, Burst cycle: 200, Time: 5 min, Mode: frequency sweeping; Covaris, USA), the cDNA was isolated and eluted into 10 μl with the DNA Clean and Concentrator—5 kit (Zymo Research, USA). All material isolated (3.9 ± 0.5 ng/sample) was used as input for the Thruplex DNA-seq kit (Rubicon Genomics, USA) and processed per manufacturer's recommendations, which included nine library amplification cycles. Library quantity and quality were evaluated as described above for the cDNA. Illumina paired-end 100 bp sequencing was performed on a HiSeq 2500 apparatus (Illumina, USA).
RNA-Seq data analysis
Raw reads were imported into CLC Genomics Workbench (CLC, v7.5.1; Qiagen, USA) and trimmed for the Clontech IS PCR primer (5′-AAGCAGTGGTATCAACGCAGAGTAC-3′). The remaining reads for each sample were mapped to the annotated human genome (GRCh38.82) using the RNA-Seq tool within CLC with one modification to the default settings: reads mapping as broken pairs were included in mapped read counts. CLC calculated expression values for each gene as total exon reads per kilobase of transcript per million mapped reads (RPKM). Genes with an RPKM greater than 0.4 in at least three of five replicates for a minimum of one sample type were considered expressed (Ramskold et al., 2009). Spearman's correlation coefficients of RPKM between all samples were calculated for expressed genes in R (v3.2.3; (RCoreTeam, 2015)) using the cor function and plotted with corrplot (v0.73; (Wei and Simko, 2013)). Comparison with previously published human MII oocyte data was conducted on downloaded GEO accessions GSE36552 (Yan et al., 2013) and GSE44183 (Xue et al., 2013) using our RNA-Seq analysis pipeline with the exception of trimming reads for the following sequences: 5′-ATATGGATCCGGCGCGCCGTCGAC-3′ and 5′-ATATCTCGAGGGCGCGCCGGATCC-3′. Genes exhibiting an RPKM greater than 0.4 in at least two of three replicates (for downloaded samples) or expressed in at least one MII sample type (within the current data set) were considered expressed in MII samples.
Differentially expressed genes (DEGs) were determined in R with the DESeq2 package (v1.10.1; (Love et al., 2014)) by analyzing total exon reads exported from CLC for only expressed genes. Library size factors for DESeq2 were manually calculated using total gene reads. Experimental designs for different comparisons included stage (GV and MII), age (YNG and AMA), day of library preparation (Days 1, 2 and 3), and potential interactions: overall GV vs MII (age + stage + prep + age:prep + stage:prep + age:stage), YNG GV vs. AMA GV, YNG MII vs. AMA MII, YNG GV vs. YNG MII and AMA GV vs. AMA MII (stage_age + prep + stage_age:prep). Following variance stabilizing transformation of total exon reads data using DESeq2, a heatmap was generated for all expressed genes using the heatmap3 package in R (v1.1.1; (Zhao et al., 2015)). Gene Ontology enrichment was conducted on the DEGs using Ingenuity Pathway Analysis software (IPA; Qiagen, USA). For DEGs detected between AMA and YNG MII oocytes, Gene Ontology enrichment was also examined using DAVID Bioinformatics (v6.7; (Huang da et al., 2009a,b)).
Weighted gene correlation network analysis
Variance stabilized transformed data for expressed genes from GV and MII samples were separately analyzed using the WGCNA package (Langfelder and Horvath, 2008). Each gene (node) together with the corresponding expression values from each sample comprise the node expression profile. The WGCNA package calculates pair-wise correlations between node expression profiles without considering sample types (e.g. age) that it uses to create clusters of correlated genes (modules). The following parameters were set for the blockwiseConsensusModules function within WGCNA to construct gene modules as described above: maxBlockSize = 40 000, power = 19 and 17 for GV and MII samples respectively, networkType = ‘signed’, TOMType = ‘signed’, minModuleSize = 30, mergeCutHeight = 0.45, re-assignThreshold = 1E-6. In addition, correspondence between gene modules and traits were then determined and significant cases were examined by IPA. Considered patient trait values (fertilization rate and blastocyst rate) were determined post-insemination of oocytes obtained from the same IVF treatment cycle as the oocyte samples analyzed in this study, with the exception of YNG/AMA patient categorization, patient age, and maturation percentage (Supplementary Table SI).
Statistical analysis
Genes exhibiting an adjusted P < 0.05 and log2 fold change >1 between different stages (GV vs. MII) irrespective of age, or an adjusted P < 0.1 and log2 fold change >1 between age groups (YNG vs. AMA) within stage (GV or MII) in DESeq2 were considered DEGs. Biological function and canonical pathway enrichment analysis (IPA) significance was set at a Benjamini-Hochberg multiple testing correction P-value (FDR) < 0.05. Significant correlations between gene modules and various patient traits related with oocyte and embryo developmental potential (WGCNA) were defined as a P < 0.05.
Results
Transcriptome of single human oocytes
Total RNA isolated from individual oocytes was subjected to whole transcript cDNA synthesis using an anchored oligo(dT) approach during reverse transcription yielding 22.0 ng ± 1.9 and 12.4 ng ± 1.4 for GV and MII samples, respectively. Of ~57 million total Illumina reads obtained for each sample, ~90% mapped to the human genome (Supplementary Table SII). Based on a cutoff of RPKM > 0.4, we identified 12 770 expressed genes in human oocytes. While most of the expressed genes (10 777; 84%) were detected in both GV (YNG and/or AMA) and MII (YNG and/or AMA) oocytes, some were specific to GV (1744; 14%) and MII (249; 2%) stages (Fig. 1A). High reproducibility of replicates within stage was achieved as indicated by Spearman's correlation coefficients and heatmap analysis (hierarchical clustering) using RPKM and variance stabilized transformed values, respectively, for all expressed genes (Supplementary Figs S1, S2). Overall, 458 and 3506 genes were differentially expressed as up- and down-regulated between GV and MII oocytes, respectively.
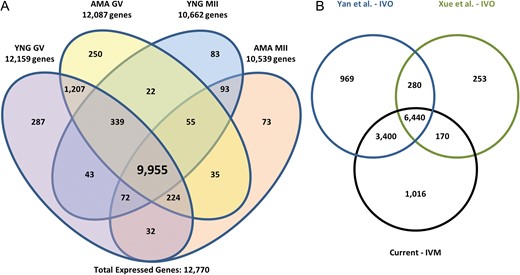
Human oocyte gene expression. (A) Number of expressed genes in advanced maternal age (AMA) and young (YNG) human oocytes at the germinal vesicle (GV) and metaphase II (MII) stages. Genes with an RPKM > 0.4 in at least three of five replicates within a sample type were considered expressed. Total expressed genes represents those expressed in at least one sample type. (B) Comparison of in vitro matured (IVM) MII oocyte expression profiles to published in vivo matured (IVO) oocyte studies. MII sample reads (three replicates/study) from GEO accessions, GSE44183 (Xue et al., 2013) and GSE36552 (Yan et al., 2013) were downloaded and processed using our RNA-Seq analysis pipeline to determine gene expression similarities between studies. Genes with an RPKM > 0.4 in at least three of five replicates for a minimum of one MII type or in at least two of three replicates from the respective downloaded samples were considered expressed.
MII-expressed genes in the current study (11 026) were compared to data from two previous reports, which included 11 089 (Yan et al., 2013) and 7143 (Xue et al., 2013) expressed genes (Fig. 1B). Most of the expressed genes in the Yan et al. (2013) (93%) and Xue et al. (2013) (89%) data sets overlapped detected genes in the current study (Fig. 1B). Expression profiles of oocytes from the different stages and ages examined demonstrates the robustness of single oocyte RNA-Seq analysis even across different studies.
Age-related differential gene expression
Differences in gene expression between YNG and AMA oocytes were examined to determine potentially affected processes in AMA oocytes that may contribute to their reduced developmental potential. Differential gene expression analysis between YNG and AMA samples within stage identified 1 and 255 genes at GV and MII stages, respectively (Fig. 2A, B). Among the DEGs within the MII stage, 46 and 209 were up- and down-regulated in AMA MII oocytes, respectively, while the single DEG in the GV stage (RP11-404K5.1) was upregulated in AMA oocytes. Potential markers of oocyte quality that significantly decreased in transcript abundance in AMA MII oocytes relative to YNG MII oocytes included CDK1, NLRP5 and PRDX1 (Table I).
Human MII oocyte expression of DEGs between advanced maternal age (AMA) and young (YNG) MII oocytes.
| Gene | AMA MII RPKMa | YNG MII RPKMa | Log2 fold change | P-valueb |
|---|---|---|---|---|
| Apoptosis | ||||
| BDNF | 0.4 ± 0.1 | 0.8 ± 0.4 | −2.57 | 1.14E-02 |
| BNIP3 | 7.2 ± 0.5 | 11.2 ± 1.4 | −1.02 | 2.18E-02 |
| CASP3 | 5.6 ± 0.7 | 10.1 ± 3.3 | −1.54 | 5.80E-04 |
| PRDX1 | 12.7 ± 2 | 23.6 ± 3.2 | −1.69 | 1.49E-03 |
| TNFAIP8 | 2 ± 0.4 | 3.1 ± 0.3 | −1.50 | 4.56E-02 |
| TP53INP1 | 2.5 ± 0.7 | 1.5 ± 0.4 | 2.38 | 5.87E-04 |
| Actin cytoskeleton | ||||
| ARPC1A | 5.2 ± 0.9 | 8.6 ± 1.9 | −1.65 | 5.04E-03 |
| ARPC5 | 2 ± 0.6 | 2.8 ± 0.9 | −1.89 | 2.15E-06 |
| CFL2 | 1.5 ± 0.2 | 2.9 ± 0.5 | −2.00 | 3.59E-03 |
| DBN1 | 0.1 ± 0.1 | 0.5 ± 0.1 | −5.06 | 7.00E-03 |
| DYNLL1 | 38 ± 4.5 | 61.8 ± 10.2 | −1.32 | 1.29E-02 |
| GSN | 0.6 ± 0.1 | 0.9 ± 0.1 | −1.32 | 1.53E-02 |
| HSPA1L | 0.9 ± 0.2 | 1.3 ± 0.4 | −1.88 | 1.11E-02 |
| MYH9 | 0.8 ± 0.1 | 0.9 ± 0.3 | −1.28 | 3.00E-02 |
| RANBP10 | 0.6 ± 0 | 0.8 ± 0.1 | −1.07 | 3.46E-02 |
| XIRP2 | 1 ± 0.5 | 0.5 ± 0.2 | 2.68 | 1.89E-02 |
| mRNA processing | ||||
| CPSF6 | 1.5 ± 0.3 | 2.9 ± 0.5 | −1.50 | 4.87E-02 |
| DDX56 | 2.5 ± 0.4 | 3.2 ± 1 | −1.28 | 3.13E-02 |
| PTBP2 | 1.6 ± 0.1 | 2.3 ± 0.5 | −1.21 | 2.37E-03 |
| SNRPA | 1.8 ± 0.3 | 3.3 ± 1.4 | −1.52 | 4.21E-02 |
| SNRPA1 | 2.4 ± 0.6 | 4.7 ± 1.2 | −2.37 | 1.11E-06 |
| SNUPN | 0.4 ± 0.1 | 1 ± 0.3 | −2.25 | 3.51E-03 |
| TYW1B | 23.6 ± 5.4 | 14.8 ± 5.5 | 4.37 | 5.04E-03 |
| Transcription | ||||
| CCDC101 | 3.3 ± 0.5 | 5 ± 1 | −1.40 | 2.91E-02 |
| DACH1 | 0.8 ± 0.2 | 0.5 ± 0.1 | 1.99 | 2.49E-02 |
| ETV6 | 2.1 ± 0.6 | 2.7 ± 0.5 | −1.44 | 1.59E-04 |
| FLII | 4.2 ± 0.5 | 2.7 ± 0.3 | 1.19 | 2.12E-02 |
| GTF2H2 | 3.8 ± 0.8 | 6.4 ± 0.9 | −1.47 | 3.13E-02 |
| LRPPRC | 2.9 ± 0.2 | 2 ± 0.2 | 1.03 | 4.24E-03 |
| MECOM | 1.7 ± 0.8 | 0.5 ± 0.4 | 14.92 | 1.18E-02 |
| MED7 | 0.4 ± 0.2 | 1 ± 0.3 | −3.03 | 2.52E-03 |
| MMS19 | 1.5 ± 0.5 | 1.6 ± 0.4 | −1.34 | 1.53E-02 |
| NME2 | 18.8 ± 2.2 | 12.3 ± 2.3 | 1.39 | 3.51E-02 |
| NR1H4 | 3.8 ± 0.9 | 1.9 ± 0.2 | 1.38 | 4.08E-02 |
| NR2E3 | 0 ± 0 | 1 ± 0.4 | −9.05 | 2.52E-03 |
| PCGF3 | 3.3 ± 0.4 | 6.6 ± 1.2 | −1.21 | 2.52E-03 |
| PHF12 | 0.8 ± 0.2 | 1 ± 0.1 | −1.23 | 1.01E-02 |
| PPRC1 | 22.1 ± 4.4 | 26.4 ± 4.2 | −1.06 | 1.27E-02 |
| SOHLH1 | 0.9 ± 0.2 | 1.1 ± 0.3 | −1.68 | 4.07E-02 |
| TAF9B | 9.7 ± 1.8 | 16.6 ± 5.3 | −1.80 | 2.52E-03 |
| TDGF1 | 1.8 ± 0.3 | 5.1 ± 1.8 | −2.14 | 1.05E-04 |
| XRCC6 | 13.5 ± 0.3 | 21.2 ± 4.4 | −1.11 | 1.40E-03 |
| YEATS4 | 101.8 ± 12.5 | 135.3 ± 6.6 | −1.00 | 1.80E-04 |
| ZNF180 | 0.8 ± 0.2 | 1.4 ± 0.3 | −2.17 | 4.41E-02 |
| ZNF212 | 1.5 ± 0.4 | 2.3 ± 0.3 | −1.74 | 1.03E-02 |
| ZNF227 | 6.7 ± 0.8 | 11.4 ± 1.1 | −1.14 | 2.52E-03 |
| ZNF23 | 1.5 ± 0.1 | 2.4 ± 0.6 | −1.20 | 4.46E-02 |
| ZNF304 | 4.3 ± 0.5 | 5.5 ± 1.3 | −1.11 | 6.24E-03 |
| ZNF433 | 0.7 ± 0.1 | 1.3 ± 0.3 | −2.21 | 9.00E-03 |
| ZNF564 | 0.7 ± 0.4 | 0.5 ± 0.2 | −1.40 | 3.51E-02 |
| ZNF565 | 1 ± 0.2 | 1.5 ± 0.3 | −1.56 | 4.43E-03 |
| ZNF586 | 3 ± 0.3 | 4.2 ± 0.8 | −1.26 | 2.52E-03 |
| ZNF721 | 21 ± 3.4 | 5.1 ± 2.2 | 2.24 | 3.76E-02 |
| ZNF727 | 2.8 ± 0.3 | 4.2 ± 0.9 | −1.42 | 4.17E-02 |
| ZNF821 | 2.6 ± 0.3 | 1.4 ± 0.2 | 1.69 | 3.48E-02 |
| Cell cycle | ||||
| CDK1 | 11.1 ± 2.8 | 21.8 ± 8.9 | −2.03 | 7.82E-03 |
| E2F1 | 4.5 ± 0.4 | 3.1 ± 0.7 | 1.24 | 1.53E-02 |
| KIF22 | 3.5 ± 0.3 | 4.9 ± 1.1 | −1.09 | 2.36E-02 |
| MEI1 | 0.8 ± 0.1 | 1.6 ± 0.3 | −1.63 | 4.29E-04 |
| NEK2 | 23.3 ± 2.4 | 34.5 ± 7 | −1.08 | 2.68E-02 |
| PSMA6 | 19 ± 5.1 | 20.7 ± 3.7 | −1.04 | 3.79E-02 |
| SKA2 | 2.3 ± 0.3 | 4.3 ± 0.9 | −1.69 | 1.99E-02 |
| TIPIN | 5.8 ± 0.6 | 8.5 ± 1.2 | −1.01 | 2.93E-02 |
| Embryo development | ||||
| NLRP5 | 64.9 ± 15.9 | 123.9 ± 32.9 | −1.63 | 9.79E-04 |
| Mitochondria | ||||
| COQ3 | 1.9 ± 0.5 | 3.5 ± 0.7 | −1.95 | 2.91E-02 |
| Ubiquitination | ||||
| FBXO3 | 0.8 ± 0.2 | 1 ± 0.2 | −1.65 | 3.87E-03 |
| Microtubule cytoskeleton | ||||
| MAP1A | 3.6 ± 0.5 | 2.1 ± 0.2 | 1.35 | 2.77E-02 |
| TUBA3E | 4.6 ± 2.3 | 0.2 ± 0.1 | 4.36 | 4.66E-02 |
MII, metaphase II; DEG, Differentially expressed gene.
Gene categorization was conducted using David Bioinformatics (v6.7) and modified by incorporating additional genes associated with functions relevant to oocyte biology.
aAverage reads per kilobase of transcript per million mapped reads ± SEM.
bDESeq2 adjusted P-value.
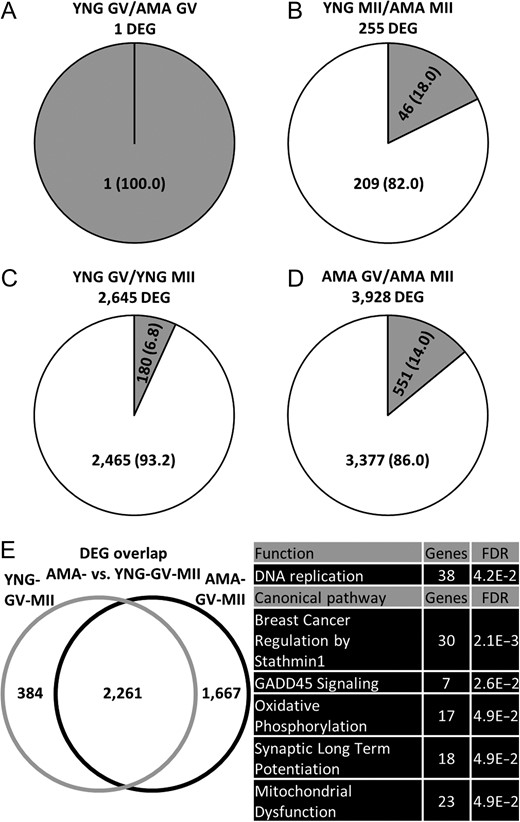
Differentially expressed genes (DEGs) identified between oocyte age groups. Number (percentage) of significantly up- (gray) and down- (white) regulated genes found between (A) young and advanced maternal age germinal vesicle (YNG GV and AMA GV) oocytes (adjusted P < 0.10 and log2 fold change > 1) (B) YNG and AMA metaphase II (YNG MII and AMA MII) oocytes (adjusted P < 0.10 and log2 fold change > 1) (C) YNG GV and YNG MII oocytes (adjusted P < 0.05 and log2 fold change > 1) and (D) AMA GV and AMA MII oocytes (adjusted P < 0.05 and log 2 fold change > 1). (E) Left: Overlap of DEGs (adjusted P < 0.05 and log2 fold change > 1) identified between YNG GV/YNG MII (YNG-GV-MII) and AMA GV/AMA MII (AMA-GV-MII) oocyte comparisons. (E) Right: Top five significantly (Benjamini-Hochberg multiple testing correction P-value, FDR < 0.05) enriched functions and canonical pathways (containing at least seven genes) within DEGs unique to the AMA-GV-MII oocyte comparison (as enriched functions and canonical pathways within DEGs unique to the YNG-GV-MII comparison contained less than seven genes). Refer to Supplementary Table SIII, SIV, and SV for all enrichment results and gene names within each category.
To ascertain differences in gene expression dynamics between maternal age groups, we compared the DEGs in YNG and AMA GV/MII pairs. Fewer DEGs were detected in YNG GV/MII (YNG-GV-MII) pairs (2645) compared to AMA GV/MII (AMA-GV-MII) pairs (3928) (Fig. 2C, D). YNG-GV-MII and AMA-GV-MII pairs had 2261 DEGs in common, while 384 and 1667 DEGs were unique to YNG-GV-MII and AMA-GV-MII, respectively (Fig. 2E). Two biological functions, metabolism of UDP-sugar and esterification of oleic acid, were significantly enriched in YNG-GV-MII-unique DEGs (Supplementary Table SIII). Among AMA-GV-MII-unique DEGs, GADD45 signaling and oxidative phosphorylation were enriched canonical pathways and DNA replication was one enriched biological function (Fig. 2E and Supplementary Table SIV, SV). Given oocytes obtained from YNG patients are generally higher in quality than those obtained from AMA patients, these identified pathways may represent impaired functions during oocyte maturation with potential consequences on developmental competence.
Gene expression networks associated with oocyte developmental capacity
WGCNA analysis was used to examine the potential correlation of oocyte gene modules with different patient traits associated with the oocyte cohort, including maternal age, age categorization (AMA vs. YNG), maturation rate, fertilization rate, and blastocyst rate (Supplementary Table SI). Two GV- and four MII-specific gene modules were identified to be significantly correlated with various patient traits related to oocyte quality and significantly enriched for canonical pathways and/or biological functions (Fig. 3A, B and Supplementary Table SI, SVI, SVII). A GV oocyte module that correlated with maternal age was significantly enriched for superpathway of inositol phosphate compounds and transport of mitochondrial membrane (Supplementary Table SVI, SVII). Another GV oocyte module (cyan) correlated negatively with maturation rate and blastocyst formation rate and was significantly enriched for functions that included cell proliferation and ubiquitination (Fig. 3A and Supplementary Table SVII).
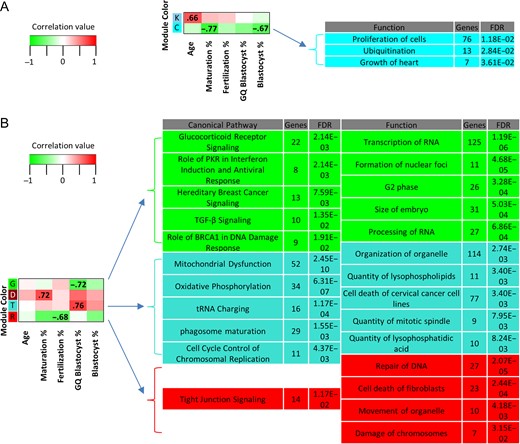
Weighted gene correlation network analysis (WGCNA) of human oocytes. WGCNA module/trait relationships with associated functions and canonical pathways for (A) germinal vesicle (GV) and (B) metaphase II (MII) human oocytes. Heatmap modules (y-axis, colors) meeting two criteria were labeled: 1. Correlation between gene module expression and trait profiles (x-axis) was significant (P < 0.05) and 2. Modules were significantly (Benjamini-Hochberg multiple testing correction P-value, FDR < 0.05) enriched for canonical pathways and/or biological functions (only top five containing ≥ 7 genes are shown; refer to Supplementary Table SVI and SVII for the complete list with gene names). Module colors (total gene number): GV—sky blue (70), K; cyan (231), C; MII—green (682), G; dark red (134), D; turquoise (2604), T; red (582), R. Positive, lack of, and negative correlations are highlighted in red, white and green, respectively. Genes comprising the modules are non-redundant.
A gene expression module significantly correlated with maturation rate in MII oocytes was enriched for the biological function swelling of colorectal cancer cell lines (Supplementary Table SVII). Another MII oocyte module, in red, was significantly correlated with fertilization percentage and enriched for tight junction signaling, organelle movement, and DNA repair (Fig. 3B and Supplementary Table SVI, SVII). Two modules were significantly correlated with good quality blastocyst rate in mature oocytes, the green and turquoise modules (Fig. 3B and Supplementary Table SVI, SVII). Mitochondrial dysfunction, oxidative phosphorylation and cell cycle control of chromosomal replication were among significant enriched canonical pathways within the turquoise module (Fig. 3B and Supplementary Table SVI). Additionally, biological functions enriched within the turquoise module include organization of organelle, transport of protein and quantity of mitotic spindle (Fig. 3B and Supplementary Table SVII). The green module was found to be enriched for various pathways and functions related to hormonal signaling and RNA processing, respectively (Fig. 3B and Supplementary Table SVI, SVII).
Discussion
The current study implements polyadenylated RNA-Seq to characterize the effect of age on the transcriptome using oocytes obtained from young and AMA women and matured in vitro. Differential gene expression analysis between young and AMA oocytes and stage-specific WGCNA identified many significant DEGs and gene module-trait correlations, respectively, that were enriched for canonical pathways and biological functions relevant to oocyte biology.
MII oocytes used in this study were in vitro matured and thus may not be representative of in vivo matured MII oocytes. However, gene expression between in vitro matured and in vivo matured oocytes is similar. The number of expressed genes in GV (YNG-12,159, AMA-12,087) and MII (YNG-10,662, AMA-10,539) oocytes in the present study is concordant with the ranges reported in prior studies examining GV and in vitro matured human oocytes: 9479-10 962 (MII-GV) (Jones et al., 2008), 8510-12,219 (MII-GV) (Wells and Patrizio, 2008), 7523-11 881 (MII only) (Reich et al., 2011). Also, the current MII oocyte results are comparable with two existing in vivo MII RNA-Seq data sets with a ~90% overlap in expressed genes relative to genes expressed in the in vivo data sets. Unlike GV stage oocytes that are transcriptionally active and can replenish degraded transcripts (Tesarik et al., 1983), maturing and MII oocytes are transcriptionally quiescent and utilize the finite transcript reserve for essential protein synthesis.
The high similarity in gene expression between YNG and AMA oocytes at the GV stage suggests that deviations in gene expression between YNG and AMA oocytes occur during maturation and may be due to underlying aberrations and increased cellular stress in AMA oocytes. Because GV oocytes are transcriptionally active, premature or increased utilization of certain transcripts could be masked by transcription, whereas after induction of oocyte maturation, any changes in transcript utilization will become evident in the transcriptome due to lack of transcriptional activity. Consequently, stress-induced utilization of essential factors for oocyte maturation and early embryo development could lead to prematurely activating and depleting mRNA stores in AMA oocytes experiencing elevated cellular stress levels. This is highlighted by the increased number of DEGs uniquely identified during oocyte maturation in AMA-GV-MII (1667) compared to YNG-GV-MII (384). Also, given that all oocytes were matured in identical in vitro conditions, the differences in transcript abundance at the MII stage are the result of intrinsic oocyte aberrations and not a consequence of their maturation environment. Thus, both insufficient levels and dysregulation (upregulation) of essential cytoplasmic factors could negatively affect fertility. Although half of AMA oocytes have been reported to exhibit aneuploidy (Kuliev et al., 2003), a much lower incidence (20%) has been observed when AMA GV were transferred into enucleated young oocytes (Krey et al., 2001), supporting the notion of altered cytoplasmic content in AMA oocytes.
Maternal age affects the oocyte transcriptome
Several oocyte-specific genes and genes involved in cell cycle, protein metabolism and cytoskeleton organization were differentially expressed between YNG and AMA MII oocytes. Among these were CDK1, NLRP5 (a.k.a. MATER), and PRDX1, which all decreased in transcript abundance in AMA oocytes. CDK1 interaction with CCNB1 forms the M-phase-promoting factor, which is a crucial regulator of meiosis during oocyte maturation and affects downstream developmental stages (Adhikari et al., 2012). Accordingly, reduced CDK1 transcript levels were reported to be associated with low quality human embryos (Yanez et al., 2016). Aged MII mouse oocytes were also found to express reduced levels of CDK1 along with another cell cycle regulator that was in common with the current findings (NEK2) (Hamatani et al., 2004; Sonn et al., 2011). In mouse, NLRP5 is required for formation of oocyte cytoplasmic lattices, structures that are involved in organelle/cytoskeleton organization, and consequently affect calcium homeostasis through their interaction with the endoplasmic reticulum (Kim et al., 2010, 2014). NLRP5 has been reported to be expressed in oocytes and influences early embryo developmental potential in mammalian species including primates (Tong et al., 2002; Wu, 2009). Decreased abundance of PRDX1, an antioxidant enzyme belonging to the peroxiredoxin family, could further contribute to the reduced fertility of AMA oocytes as oxidative stress has been reported to impact oocyte quality and be associated with maternal age (reviewed by (Combelles et al., 2009)).
Several functions enriched within DEGs unique to the AMA-GV-MII transition overlapped with enriched functions in down-regulated genes between GV and MII oocytes overall (e.g. oxidative phosphorylation, mitochondrial dysfunction, and DNA replication). The lack of enrichment of these functions in DEGs unique to the YNG-GV-MII transition may suggest their dysregulation in the AMA-GV-MII transition since the former generally exhibit higher developmental potential. Some of the DNA replication-associated genes are cell cycle regulators, suggesting that suboptimal regulation of meiotic progression may occur in AMA oocytes. Moreover, mitochondrial function and ATP production are required for proper oocyte maturation and many downstream processes (Johnson et al., 2007; Schatten et al., 2014). As such, aberrant expression of key mitochondrial components during AMA-GV-MII maturation may be partly responsible for reduced developmental potential exhibited by AMA oocytes. Mitochondrial distribution is another factor affecting organelle function and retention in the oocyte, which may be altered during the AMA-GV-MII transition, as demonstrated by enrichment of actin- and microtubule-related processes. The actin cytoskeleton (ARP-WASP complex) is involved in spindle migration to the cortex while the microtubule cytoskeleton is necessary for mitochondrial localization to the spindle (Dalton and Carroll, 2013). Thus, mitochondrial function and localization may potentially be compromised during AMA-GV-MII maturation as has been previously described (reviewed by (Schatten et al., 2014)).
Gene expression networks correlate with developmental traits
Gene modules were analyzed and correlated with multiple donor traits related to oocyte quality and developmental potential. Aside from RNA levels, other potential sources of variation contributing to the measured traits were not considered in the analysis. In GV oocytes, three of the measured traits were significantly associated with gene modules that were found to be enriched for several functions and one canonical pathway. One module (sky blue) correlated with age in GV oocytes. All of the enriched functions were seemingly associated with neuron biology, but CAMKII was identified, which has a role in MII exit and apoptosis prevention in oocytes (Hansen et al., 2006; McCoy et al., 2013). The superpathway of inositol compounds was one enriched canonical pathway which is involved in calcium signaling after fertilization (reviewed by (Carroll, 2001; Malcuit et al., 2006)). Considering that age has an effect on expression of genes involved in calcium signaling, which in turn affect CAMKII function, there is a link between oocyte biology and the enriched functions and pathways.
Genes belonging to MII modules were significantly correlated with patient traits (good quality blastocyst development, fertilization rate and maturation rate) and enriched for biological functions and canonical pathways known to contribute to completion of oocyte maturation. Among processes known to be essential for oocyte maturation is mitochondrial activity (Van Blerkom, 2011; Susor et al., 2016). Accordingly, canonical pathways associated with mitochondrial function (mitochondrial dysfunction; oxidative phosphorylation) were enriched within a module that correlated with good quality blastocyst rate (turquoise). Another module (green) correlated with good quality blastocyst development and was enriched for canonical pathways related to hormonal signaling (glucocorticoid receptor; TGF-β signaling) and biological functions associated with embryo characteristics and RNA management (size of embryo; processing of RNA). The MII oocyte WGCNA results suggest that modules (and therefore gene expression) correlate with embryo quality traits that affect fertility irrespective of maternal age. Collectively, these data suggest that age-related differences in gene expression have developmental consequences through their effects on several biological processes crucial for oocyte maturation and downstream developmental stages.
Conclusions
Young (YNG) and advanced maternal age (AMA) metaphase II (MII) oocytes exhibit divergent transcriptomes at the MII stage, probably as a consequence of differential response to in vitro oocyte maturation. Key factors affecting oocyte developmental potential were found to be differentially expressed between YNG and AMA MII oocytes. Additionally, AMA oocytes exhibited a higher number of DEGs during oocyte maturation (relative to YNG oocytes), which were enriched for various functions and pathways that play crucial roles during oocyte maturation. These findings could represent a molecular basis for the reduced developmental potential exhibited by AMA oocytes. Also, WGCNA determined that stage-specific oocyte gene expression correlated with oocyte age and several traits related to cohort oocyte and embryo quality.
Supplementary data
Supplementary data are available at Human Reproduction online.
Authors’ roles
P.J.R. and R.L.K. designed and directed the study. E.S. performed the oocyte collections and IVM studies, and wrote the corresponding sections in the materials and methods. J.L.C. processed the oocytes for sequencing and contributed to implementation of WGCNA. J.M.R. conducted the bioinformatics analysis. J.M.R., P.J.R. and R.L.K. interpreted the data and wrote the manuscript. W.B.S. participated in the oocyte retrievals and discussions of the data. All authors approved of the final manuscript.
Funding
J.M.R. was supported by the Austin Eugene Lyons Fellowship awarded by the University of California, Davis. The Eunice Kennedy Shriver National Institute of Child Health and Human Development (NICHD) of the National Institutes of Health (NIH) (awarded to P.J.R.; R01HD070044) supported some of the research presented in this manuscript. R.L.K., E.S. and part of the research presented were supported by the Fertility Laboratories of Colorado.
Conflict of interest
None declared.
