


Abstract
Purpose of the Study: The aim of this study was to investigate heterogeneity in body weight trajectories among older adults and their association with mortality risks. Design and Methods: Information on body mass index (BMI) and survival come from nine waves of the Health and Retirement Study, a 16-year survey of adults aged 51–61 at baseline (N = 9,703). We used a sex-stratified joint growth mixture-discrete time survival model to characterize BMI trajectory groups and their associated mortality. Results: Three distinct classes of BMI trajectories were identified: “stable overweight,” “obese gaining,” and “obese losing.” Relative to the stable overweight class, which comprised about 90% of the sample, the obese gaining class had approximately 50% higher mortality risk; the highest mortality was found in the obese losing category (OR > 2.7, p < .001). The results were similar for men and women. Implications: The findings highlight substantial heterogeneity in weight trajectories of older Americans, as well as large survival differentials across the classes. The direction of weight changes appears inextricably linked to the overall BMI level in terms of predicting older adults’ longevity. Weight loss is associated with particularly high mortality risk even when the typical BMI change is from obesity to overweight.
Prior studies have documented an association between body mass index (BMI) and mortality. The lowest risk of death among older adults is typically found for those with BMI considered to be in the overweight range compared with those who are underweight, obese, or in the normal weight range (Flegal, Graubard, Williamson, & Gail, 2005; Flegal, Graubard, Williamson, & Gail, 2007; Janssen, 2007; McGee, 2005; Troiano, Frongillo, Sobal, & Levitsky, 1996). However, most previous research has characterized the BMI–mortality relationship using BMI measured at only one point in time. This is a limitation for two reasons. First, observed associations between a single measure of BMI and subsequent mortality may reflect underlying diseases and health conditions that influence weight, typically causing weight loss and also increasing the risk of death (Greenberg, 2006; Robins, 2008). Reliance on a single BMI data point may thus lead researchers to invalid conclusions about the association between body weight and mortality. Second, using one-time BMI information fails to show how weight change over time predicts mortality. Body weight can change substantially over the adult life course, and weight history may provide important information about an individual’s health and mortality risks.
To overcome these limitations, recent research on BMI and mortality has begun to move away from a single, static measure of BMI and toward examining weight change over time using panel data with multiple BMI data points. Although such studies vary in sample compositions, length of follow-up, and analytic approaches, there are some consistent findings. In particular, weight loss is associated with excess mortality risk (Andres, Muller, & Sorkin, 1993; Lee et al., 2011; Myrskyla & Chang, 2009; Newman et al., 2001), whereas stable body weight tends to be associated with the lowest mortality risk (Bamia et al., 2010; Lee et al., 2011; Newman et al., 2001; Strandberg et al., 2009). Additionally, some studies have found modest weight gain associated with a comparable or decreased mortality risk relative to a stable weight trajectory (Andres et al., 1993; Myrskyla & Chang, 2009; Stevens, Juhaeri, & Cai, 2001).
The recent focus on weight change is a marked improvement over analyses of a single measure of BMI. However, prior studies have tended to use a variable-based approach that focuses on an a priori categorization of BMI level and change, rather than a person-based approach that could describe the shape of BMI trajectories that are actually observed in the population. The variable-based approach includes regression models where the mortality risk is modeled as a function of the starting or average BMI level and BMI change over time. One strategy is to control for baseline BMI, effectively treating it as a nuisance parameter. Alternatively, some researchers have created multiple categories of BMI change, such as “gaining from normal weight to overweight” or “losing weight from obese to overweight range,” to capture a sense of both level and change in weight (Lee et al., 2011; Myrskyla & Chang, 2009; Newman et al., 2001; Stevens et al., 2001; Strandberg et al., 2009). Although this approach allows for a more nuanced understanding of the overall level and change in BMI, the categories depend heavily on the chosen thresholds and thus make it difficult to draw conclusions about actual population patterns.
This study uses a unique approach to examine the association between BMI and mortality in older adults by applying person-centered modeling techniques to relate long-term trajectories of BMI observed in the population to mortality risk. The substantive goals of this study are to (a) identify typical BMI trajectories and describe their shapes, (b) determine the mortality risk associated with different BMI trajectory groups, and (c) account for baseline health information in order to explore how baseline health and smoking status influences membership in different BMI trajectory groups. We address these study aims by using a joint generalized growth mixture–discrete-time survival model to analyze nine waves of data collected over 16 years from a large, nationally representative, longitudinal study of older adults.
Data and Method
Data Source
Data are from the Health and Retirement Study (HRS) (Hodes & Suzman, 2007), a nationally representative longitudinal study of older Americans born between 1931 and 1941. The sample cohort was first interviewed in 1992 and reinterviewed every 2 years thereafter. We use data through 2008, which provides up to nine measures of BMI and mortality follow-up over 16 years of the study period. We used version J of the data set available from the RAND Corporation (RAND Corp., 2010). After excluding 51 individuals (0.5% of baseline sample) who had BMI values considered to be far outside the typical range of values (above 60 or below 15 at any interview wave), the final sample size was N = 9,703.
Measures
BMI was calculated as weight (in kilograms) divided by height squared (in meters) using baseline self-report of height and wave-specific reports of weight. All available BMI data points were used, meaning that individuals with fewer than nine waves of valid BMI data due to attrition or missing weight information were retained in the analyses.
Survival status was ascertained at every wave. The HRS conducts on-going tracking of all respondents and obtains information that indicates whether a respondent is still alive, presumed alive but not interviewed, known to be deceased, or presumed dead at each interview wave. Other than the baseline where all respondents were alive, for each wave , where
 , we used dichotomous vital-status indicators:
 if the respondent was known or presumed alive,
 if the respondent died in the 2-year interval prior to that wave, and missing if the respondent had died previously (
 ) or was lost to follow-up.
Control variables included baseline information on year of birth, self-rated health (SRH), and smoking status. Year of birth was centered on the mean year 1936. SRH was chosen as a measure of initial health following a large literature that shows SRH to be a valid and reliable indicator of population health status (Idler & Benyamini, 1997; Jylhä, Volpatob, & Guralnik, 2006; Mossey & Shapiro, 1982). SRH was measured in HRS on the standard 5-point scale from excellent, very good, good, fair, and poor, which we dichotomized as excellent to good (=0) versus fair or poor (=1) following the literature (Kawachi, Kennedy, & Glass, 1999; Villa, Wallace, Bagdasaryan, & Aranda, 2012). We treated smoking status as a three-category variable that distinguished between current smokers, past smokers, and those who never smoked (reference). There was no missingness on the year of birth and baseline SRH and smoking information among the 9,703 individuals we defined as the analytic sample.
Analytic Approach
We used a joint growth mixture–discrete-time survival analysis model (GMM-DTSA) also referred to as the discrete-time survival mixture model. This approach identified distinct classes of BMI trajectories and determined differences in mortality risk among the trajectory classes (Muthén & Masyn, 2005; Muthén & Muthén, 2000). The full model is shown schematically in Figure 1, with latent variables denoted by circles and observed variables by squares. Our GMM-DTSA consisted of a univariate latent growth curve of BMI characterized by an intercept and slope
 , a categorical latent variable for the trajectory class c, and a distal latent outcome, the hazard of mortality, denoted by h.
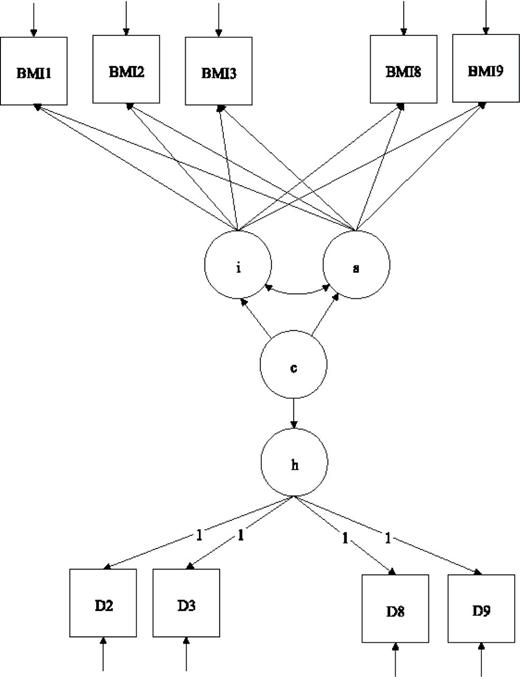
Schematic diagram of the joint growth mixture– discrete-time survival model.
Note: BMI1–BMI9 are the observed BMI values; D2–D9 are vital status indicators, coded 0 if the respondent was alive through the end of a given time interval, 1 if the respondent died in the time interval, and missing if the respondent died previously or attrited. The means of the latent growth factors for the BMI trajectories, i and s, are allowed to vary across the trajectory classes, c. The mortality hazard h is modeled as a function of the class membership via a logistic regression model.
The top part of Figure 1 shows the GMM portion of the model. The GMM captures population heterogeneity in the trajectories of a latent variable and assigns to each individual a probability of belonging to a specific trajectory via the latent categorical variable c (Jung & Wickrama, 2008; Lubke & Muthén, 2005; Muthén, 2004; Muthén & Muthén, 2006). Conceptually, the model groups individuals with similar types of BMI trajectories together and estimates the mean trajectory for each group and the variability of the trajectories within each group. The BMI trajectories are summarized by the intercept and slope, denoted by and s, respectively. In the model,
 denotes a latent categorical variable with K classes,
 where
where  is determined by the analyst. The means of the growth factors
 and
and are allowed to vary across classes, so the latent classes are identified by different patterns of BMI change over time.
The bottom part of Figure 1 shows the DTSA part of the model, which estimates the mortality hazard h (Masyn, 2009; Muthén & Masyn, 2005). The duration of the follow-up was divided into eight discrete time periods, with a nonrepeatable event for some participants (death). For each wave w (w = 2, ..., 9), a respondent was coded as alive ( ), died during the preceding period (
 ), or missing (
 ), whether the respondent had died or was lost to follow-up. The probability of death was modeled as a function of class membership c using a logistic regression:
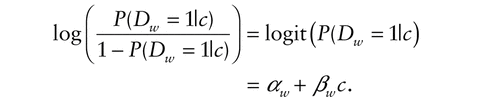
The coefficient represents the difference in the logit hazard probability of death for a given trajectory class
 , relative to an omitted trajectory class. We constrained the paths to the event indicators
 to be equal, which is equivalent to assuming that the effects of class membership are the same across time. This is referred to as a proportional-hazards model because the hazard ratios are time invariant.
An important part of the joint model pertains to the assumption under which the two processes—BMI change and survival—are linked. Although they are modeled within one estimation procedure, survival is modeled as a function of the BMI trajectory class, whereas the BMI class membership is estimated solely from the observed BMI data points. Thus, BMI class membership is used to predict survival but vital status is not used in the estimation of class membership. Accordingly, the BMI trajectory class results are nearly identical in GMM models that do not include prediction of survival as they are in the GMM-DTSA models.
We were also interested in estimating whether baseline age, health, and smoking status predicted BMI trajectory class membership. Although technically the GMM-DTSA model can accommodate predictors, the complexity of the full joint model makes it difficult to obtain model convergence and stable estimates with the inclusion of additional covariates. To simplify the model and obtain model convergence, we estimated a separate set of the GMM models that excluded the DTSA portion but adjusted for baseline covariates. For these adjusted GMM models, the class membership c was modeled as a function of observed time-invariant predictors using a multinomial logistic regression.
Several important analytic steps were done prior to estimating the full joint GMM-DTSA model. First, we selected the linear shape for the BMI trajectories. To do so, we estimated a series of one-class latent growth models, comparing linear, quadratic, and nonparametric specifications of the BMI trajectory (allowing the factor loadings for BMI at waves 3–9 to be freely estimated rather than fixed). By comparing the fit indices of the different models and the shapes of the estimated trajectories, we determined that the linear specification for the growth process provided the optimal fit to the data. BMI tends to change in a gradual manner over time, and weight fluctuations can be smoothed to fit this gradual process—which is best captured by the parsimonious linear shape. Some respondents may have experienced accelerating or decelerating BMI growth over time, but their experiences were highly variable and could not be generalized to constitute a distinct BMI trajectory class. Second, we determined the optimal number of BMI trajectory classes as three. We estimated multiple growth mixture models with two, three, four, and five classes. Following established strategies for selecting the optimal number of classes in growth mixture models (Li & Hser, 2011; Nylund, Asparouhov, & Muthen, 2007; Tofighi & Enders, 2008), we examined model fit indices, including the Bayesian Information Criterion (BIC), adjusted BIC, Lo-Mendel-Rubin p-value, BLRT p-value, and the entropy index, and also evaluated substantive considerations, such as whether a new class captured a clearly distinct trajectory and whether membership in a new class constituted a large enough portion of the sample (e.g., greater than 2%). These considerations pointed to a three-class model as the best fitting solution for the data.
Finally, after estimating the full GMM-DTSA models, we also conducted sensitivity analyses to determine the robustness and validity of the findings. In particular, we examined different specifications for the variance parameters in the model. We compared results from models that assumed error invariance in the BMI trajectory measures and those that release this assumption. We compared models with the proportional hazard assumption against those where the assumption was relaxed. In a select subset of one- and two-class growth models, we compared findings adjusted and unadjusted for complex sampling design. Finally, we explored unadjusted and adjusted GMM models where the error variances for intercept and slope were allowed to vary across classes, as opposed to fixing them to be equal in all latent classes. We found that the main conclusions reported here remained substantively unchanged across these different model specifications. All results are available on request.
Descriptive statistics were conducted with Stata 11 (StataCorp, 2009); mixture models with Mplus 6.1 (Muthén & Muthén, 2011).
Results
Table 1 summarizes key characteristics of the sample. At baseline, the sample consisted of about 48% men and 52% women; the respondents were about 56 years old on average. The initial average BMI was about 27 for both men and women, increasing slightly to a mean BMI of 28 among survivors at the end of the study. Few respondents were underweight (0.4% of men and 1.7% of women) at baseline and only 21% of men and about 24% of women were obese; most had BMIs in the overweight or normal weight categories. About 23% of men and 15% of women died during the 16 years of follow-up.
Characteristics of the HRS Cohort 1992–2008, by Sex (N = 9,703)
| Men | Women | |
|---|---|---|
| Proportion of sample at baseline | 47.5% | 52.5% |
| Mean year of birth (s.e.) | 1936.2 (0.05) | 1936.2 (0.04) |
| Mean body mass index (BMI), in kg/m2 | ||
| In 1992 | 27.2 (0.07) | 26.9 (0.09) |
| In 2008 | 28.3 (0.12) | 28.1 (0.12) |
| Categorized BMI at baseline | ||
| Underweight | 0.4% | 1.7% |
| Normal weight | 29.1% | 39.7% |
| Overweight | 49.4% | 34.1% |
| Obese | 21% | 24.5% |
| Smoking status at baseline | ||
| Never smoked | 25.7% | 46.2% |
| Former smoker | 44.8% | 28.5% |
| Current smoker | 29.6% | 25.3% |
| Self-rated health at baseline | ||
| Excellent | 22.9% | 20.8% |
| Very good | 27.7% | 28.2% |
| Good | 28.5% | 27.2% |
| Fair | 12.8% | 15.7% |
| Poor | 8.1% | 8.1% |
| Proportion died by wave 9 | 23.4% | 15.4% |
Note: Adjusted for complex sampling design.
Figure 2 shows the estimated sample trajectories from a 3-class model for men (solid lines) and a random sample of observed BMI trajectories (dotted lines). The plots visually corroborate that the linear specification fit the data well: The direction of change and linearity of the individual observed trajectories follow the estimated trajectories neatly although there is variability in the overall BMI level in each class. Results for women were similar to those for men. (The figure was omitted for parsimony but is available on request.)
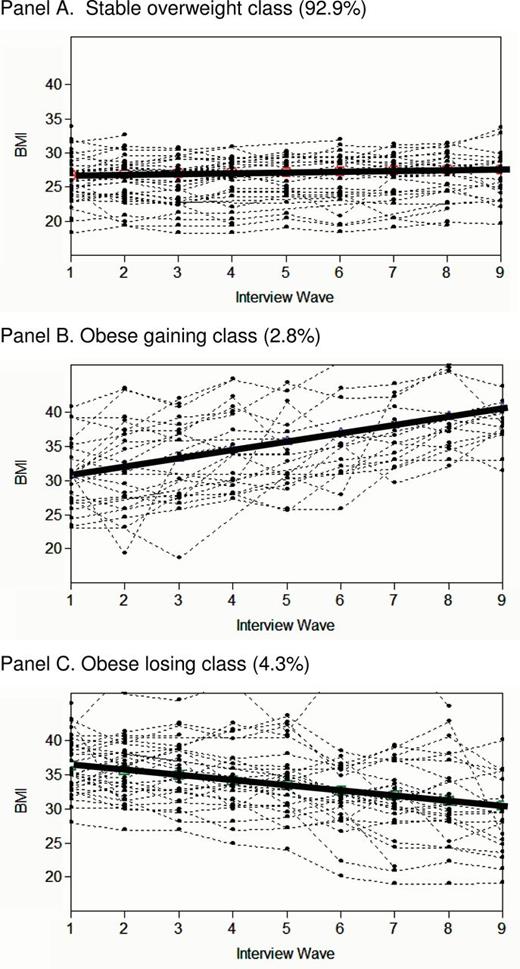
Three classes of BMI trajectories for men–estimated trajectory for each class and a random sample of observed individual trajectories. Panel A: Stable overweight class (92.9%); Panel B: Obese gaining class (2.8%); Panel C: Obese losing class (4.3%).
Note: Results for women are visually nearly indistinguishable. The estimated sample trajectories and sample proportions for both genders are summarized in Figure 3.
Figure 3 summarizes the estimated BMI trajectories from the 3-class GMM for men (Panel A) and women (Panel B). Although these models were estimated independently, the resulting trajectories and the distributions of the samples into each class were remarkably similar for the two genders. The majority of respondents, 93% of men and almost 90% of women, had a BMI trajectory that could be characterized as being stable overweight. This group experienced only a slight increase in BMI over the duration of follow-up, and their initial BMI was distributed around the low-overweight range. The remaining 7%–10% of the sample had BMIs primarily in the obese range. About 3% of men and 6% of women had a BMI trajectory described as obese gaining, which was characterized by a steady weight gain over time. The mean BMI in this class increased from just above 30 for men or 35 for women to BMIs well above 40. The last group, obese losing, comprised 4%–5% of the sample. This group was characterized by decreases of body weight, from BMIs centered around the 35–40 range to the high-overweight range among men and low-obese range among women.
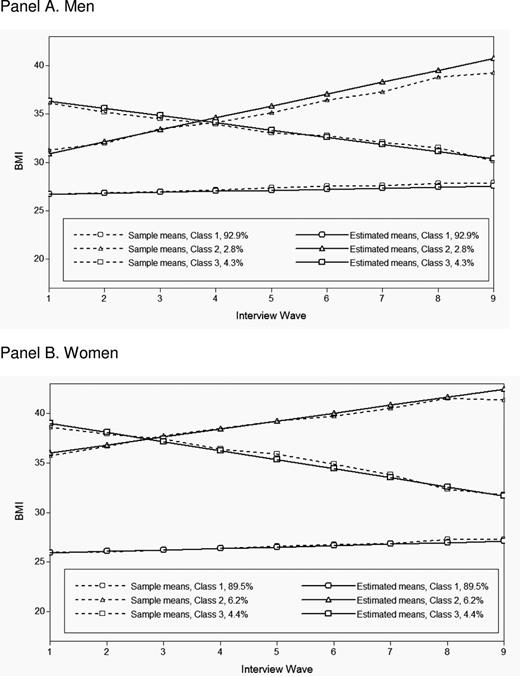
Estimated BMI trajectories from unadjusted growth mixture models, by sex. Panel A: Men; Panel B. Women.
Note: The plot shows the estimated and observed sample trajectories and the proportion of the total sample for each class estimated by the model. Data source: Health and Retirement Survey 1992–2008 (N = 4,579 men and N = 5,124 women).
We then used the joint GMM-DTSA model to estimate mortality differences across these three trajectory classes. Table 2 shows the odds ratios for the risk of dying, and associated p values, by gender. Relative to the stable overweight group, men and women in the obese gaining groups had about a 50% higher odds of dying—although among men, this difference was not statistically significant (for women, OR = 1.54, p < .001). Men and women in the obese losing groups were about 3–4 times more likely to die during follow-up, compared with those in the reference stable overweight class (for men, OR = 2.8, p < .001; for women, OR = 3.7, p < .001).
Joint GMM-DTSA Models with Three BMI Trajectory Classes, by Sex
| Stable overweight | Obese gaining | Obese losing | |
|---|---|---|---|
| Men | |||
| % in each class | 92.6% | 2.7% | 4.6% |
| Mortality hazard ratio | 1 (reference) | 1.46 (p = .129) | 2.78 (p < .001) |
| Entropy | 0.91 | ||
| Women | |||
| % in each class | 89.5% | 5.8% | 4.7% |
| Mortality hazard ratio | 1 (reference) | 1.54 (p < .001) | 3.66 (p < .001) |
| Entropy | 0.89 | ||
Note: Data source: Health and Retirement Survey 1992–2008 (N = 4,579 men and N = 5,124 women). Entropy is a summary index of model fit; values close to 1 indicate a good fit.
Finally, we estimated growth mixture models adjusted for several baseline characteristics—year of birth, dichotomized SRH, and smoking status—in order to gain insight into the reasons for the high mortality of the obese gaining and especially obese losing groups. Table 3 shows the results for men and women. In both genders, poor/fair baseline health was strongly associated with membership in the obese gaining groups relative to the stable overweight group (for men, OR = 2.4, p < .001; for women, OR = 3.2, p < .001). The effects were even stronger for the obese losing groups: men in this group had 4.6 times the odds of reporting fair/poor health (p < .001) compared with the stable overweight group; for women, the odds were 6.5 (p < .001). In terms of smoking, men and women in the obese losing class were less likely to be current smokers than those in the stable overweight class (for men, OR = 0.6, p = .03; for women, OR = 0.4, p = .002). In addition, women in the obese gaining class were more likely to be former smokers than those in the stable overweight class (OR = 1.7, p = .002).
Three-Class GMM Models Adjusted for Select Baseline Covariates, by Sex
| Stable overweight | Obese gaining | Obese losing | |
|---|---|---|---|
| Men | |||
| % in each class | 92.0% | 3.0% | 4.9% |
| OR for baseline covariates | |||
| Year of birth | 1 (reference) | 2.12 (p < .001) | 1.01 (p = .724) |
| Poor/fair SRH | 1 (reference) | 2.41 (p = .006) | 4.56 (p < .001) |
| Current smoker | 1 (reference) | 1.09 (p = .866) | 0.59 (p = .034) |
| Past smoker | 1 (reference) | 1.10 (p = .780) | 0.73 (p = .121) |
| Entropy | 0.91 | ||
| Women | |||
| % in each class | 88.4% | 6.7% | 4.9% |
| OR for baseline covariates | |||
| Year of birth | 1 (reference) | 1.09 (p = .002) | 0.97 (p = .338) |
| Poor/fair SRH | 1 (reference) | 3.22 (p < .001) | 6.55 (p < .001) |
| Current smoker | 1 (reference) | 0.95 (p = .68) | 0.41 (p = .002) |
| Past smoker | 1 (reference) | 1.72 (p = .002) | 1.37 (p = .085) |
| Entropy | 0.88 | ||
Notes: OR = odds ratio, SRH = self-rated health. The reference category for poor/fair SRH is persons with excellent to good health; reference for current and past smokers is persons who never smoked. Entropy is a summary index of model fit; values close to 1 indicate a good fit to the data. Data source: Health and Retirement Survey 1992–2008 (N = 4,579 men and N = 5,124 women).
Discussion
Using a large, nationally representative sample of older adults followed biannually over 16 years, we examined population heterogeneity in body weight trajectories and determined how the different types of trajectories predict survival. We found three distinct groups (classes) of BMI trajectories that warrant attention for their association with health and longevity. For both sexes, the majority (about 90%) of the population was characterized by a stable overweight trajectory, with a relatively steady BMI in that tended to be in the low-overweight range as the cohort aged from their mid-50s to early 70s. The remaining 10% were split into two groups, both mostly in the obese BMI range: One group—obese gaining—described weight trajectories for adults who were mostly overweight or obese in their mid-50s and continued to gain weight; the other group —obese losing—comprised adults who lost weight over time, from relatively high levels of obesity to the overweight or low-obese category. Although we characterized the three classes using their average BMI patterns, it is important to note that there was considerable variability in both initial weight and the rate of weight change over time in each class—for instance, some of the individual trajectories in the stable overweight class were in the high-normal or obese weight ranges, and some of the individual trajectories in the obese gaining/losing classes may be flatter than the class average would imply.
These three trajectory groups differed significantly in their risks of dying. For both men and women, the stable overweight group had lower mortality than the other two groups. The obese gaining class had roughly 50% higher mortality during the course of the study than the “stable overweight” reference although this sizeable difference was not statistically significant among men. The highest mortality occurred among adults in the obese losing group, who had about three times higher risks of dying, compared with the stable overweight respondents.
Our findings generally agreed with previous reports on weight changes and mortality. Specifically, our finding of lowest mortality in the stable overweight class corroborated the large body of studies that found stable body weight associated with low risks of dying (Bamia et al., 2010; Lee et al., 2011; Newman et al., 2001; Strandberg et al., 2009), as well as studies using one-time BMI that found overweight associated with the lowest mortality (Calle, Teras, & Thun, 2005; Flegal, Graubard, Williamson, & Cooper, 2011; Flegal et al., 2007; McGee, 2005). We want to emphasize this double characteristic of this optimal stable overweight trajectory, which combines overall BMI mostly in the overweight range, as well as its stability over time. In previous studies, each of these attributes has been shown to be independently associated with low mortality in older adults; our study suggests the possibility that in a large proportion of the population, these two characteristics tend to co-occur. That is, the majority of older adults tend to have relatively stable body weight over a long period of time and those with stable weight also tend to have BMIs in the low-overweight range. It may be difficult to disentangle these two attributes of this BMI class to understand whether having stable weight, being in the low-overweight BMI range, or both factors are related to longevity.
The obese losing category is particularly interesting and somewhat paradoxical: The typical weight loss occurs typically from obese body weights toward overweight, a process that may be viewed by the respondent or their medical professional as beneficial. The adults in this group started with much worse health than others, suggesting that the weight loss may have been a consequence of underlying health problems. The association between weight loss and mortality that characterized this group is consistent with prior studies (Alley et al., 2010; Bamia et al., 2010; Myrskyla & Chang, 2009; Nanri et al., 2009; Stevens et al., 2001; Strandberg et al., 2009). However, our results indicate that the typical older adult experiencing long-term weight loss does not fit the phenotype of the frail, low-BMI older adults that is usually associated with elevated mortality risk (Bales & Ritchie, 2002; Fried et al., 2001). The implication is that clinicians might view any weight loss, even when it is from obese body weights, as a potential signifier of underlying health problems.
An additional noteworthy result pertains to sex comparisons. Men and women, who were analyzed independently, produced surprisingly similar findings regarding the typical shapes of the trajectories, the proportion of the sample in each class, the mortality differences among the classes, and the association of covariates like baseline health with class membership. This similarity suggests that the process of weight change among older adults and its relationship to health and survival operates similarly among men and women. Finally, two patterns with respect to smoking are of interest: First, adults in the obese losing groups were least likely to be current smokers. This finding is somewhat counterintuitive—one might expect more former smokers who quit due to health problems in the obese losing groups, rather that never smoking in the first place. A second question arose from the greater likelihood of women in the obese gaining group to be a past smoker, compared with the stable overweight women. These puzzling associations merit further investigation.
There are several caveats to our findings. First, we are not distinguishing between intentional and unintentional weight change. The literature has a distinct niche for intentional weight change, where it appears that losing weight on purpose is associated with higher longevity among those who were initially overweight or obese (Gregg, Gerzoff, Thompson, & Williamson, 2003; Williamson et al., 1995, 2000). Weight loss in a population-level study, however, is unlikely to be driven by intentional weight changes, given the very low success of weight loss at the aggregate levels. Second, the weight and height information in HRS is self-reported. Self-reported weight, especially among older adults and those with high BMIs, tends to suffer from validity and reliability problems (Rowland, 1990)—specifically, it is likely that our BMI information is underreported and more stable than the actual respondents’ BMI. The reporting problems may result in underestimated weight gains or losses if the respondents fail to accurately report their high BMIs or weight changes. An additional potential limitation is that the two of the classes identified by the model—obese gaining and obese losing—are both somewhat small, comprising between 3% and 7% of the total sample, respectively. Simulations of mixture models regarding class sizes and correct model identification have found that models with very small class sample sizes are more likely to result in incorrect model solutions (Nylund et al., 2007; Tofighi & Enders, 2008). However, this is more of an issue with much smaller total sample size than the HRS data set we used. Substantive publications, moreover, routinely include solutions with comparably modest class proportions (Nonnemaker, Morgan-Lopez, Pais, & Finkelstein, 2009; Taylor & Lynch, 2011), suggesting that such solution is useful in various areas of substantive inquiry. And finally, it is important to keep in mind that we were studying a relatively young group within the older adult population. Age is a known modifier of the BMI-longevity association: the mortality risks associated with extra body weight attenuate with age (Flegal et al., 2005; Stevens, 2000; Stevens et al., 1998). The average respondent started the study at the age of 56 and was observed until 72. In 1992, life expectancy for a 56-year old was 22 years among men and over 26 years among women (National Center for Health Statistics, 1996). The mortality that occurs is thus relatively “premature” mortality, and the findings may not be generalizable to the mortality experience of adults in their seventies, eighties, and beyond.
This study extends existing research in two critical ways. First, our analytic approach allowed us to examine the overall level of BMI together with its patterns of change or stability over a long period of time. And second, the person-centered nature of the growth mixture models freed us from having to use an a priori categorization of the BMI into discrete levels. Instead, the wave-specific weight information was modeled as continuous indicators of a gradual weight trajectory, which better fits the substantive understanding of body weight changes over time. Our person-centered approach thus allowed the data to uncover the typical weight trajectories among older adults, determine whether there is meaningful heterogeneity in these trajectories, and assess how survival varies across these trajectory clusters.
A major implication of our findings is that the direction of weight change may combine with the overall BMI level to jointly predict health consequences among older adults. Both the obese gaining and obese losing trajectory classes comprise BMI trajectories that tend to be the low-obese BMI ranges. If we collected only one-time BMI, the obese losing group would at some point be higher, lower, or equivalent to the obese gaining group—in other words, they may be difficult to distinguish. The mortality experience of these two groups, however, differs substantially based on the direction of weight change, rather than the BMI measured at a single time point. This suggests that researchers and clinicians should try to ascertain whether their patient has generally been gaining or losing weight over time, rather than focus on short-term changes and the immediate BMI level.
Funding
This project was supported by grants from the National Center for Research Resources (5P20RR016474-12) and the National Institute of General Medical Sciences (8 P20 GM103432-12) from the National Institutes of Health, as well as the National Center for Advancing Translational Sciences and the NIH Roadmap for Medical Research through Grant 2UL1TR000423 from the Clinical and Translational Science Award (CTSA) program. The content is solely the responsibility of the authors and does not necessarily represent the official views of the NIH, NCRR, NIGMS, NCATS, or the Institute of Translational Health Sciences.
Acknowledgments
We thank Tenko Raykov for his expertise with the GMM modeling and the anonymous reviewers for their helpful comments. The authors declare no conflict of interest.
References
Author notes
Decision Editor: Rachel Pruchno, PhD

