


Abstract
The concept of personalized medicine has received widespread attention in the last decade. However, personalized medicine depends on correct diagnosis and monitoring of patients, for which personalized reference intervals for laboratory tests may be beneficial. In this study, we propose a simple model to generate personalized reference intervals based on historical, previously analyzed results, and data on analytical and within-subject biological variation.
A model using estimates of analytical and within-subject biological variation and previous test results was developed. We modeled the effect of adding an increasing number of measurement results on the estimation of the personal reference interval. We then used laboratory test results from 784 adult patients (>18 years) considered to be in a steady-state condition to calculate personalized reference intervals for 27 commonly requested clinical chemistry and hematology measurands.
Increasing the number of measurements had little impact on the total variation around the true homeostatic set point and using ≥3 previous measurement results delivered robust personalized reference intervals. The personalized reference intervals of the study participants were different from one another and, as expected, located within the common reference interval. However, in general they made up only a small proportion of the population-based reference interval.
Our study shows that, if using results from patients in steady state, only a few previous test results and reliable estimates of within-subject biological variation are required to calculate personalized reference intervals. This may be highly valuable for diagnosing patients as well as for follow-up and treatment.
Introduction
Physicians make many of their clinical decisions based on laboratory test results. However, patients’ test results cannot be applied in a medically useful way if a reliable and relevant standard to which they can be compared is lacking. Usually, physicians compare patients’ test results to reference data or cutoff limits and make decisions accordingly. Such reference data are typically population-based reference intervals (popRIs), the cut-offs of which are in many cases applied as action limits. Thus, when a patient’s test result is located within the popRI for the measurand, the test result is accepted as normal; if it is above or below, then it is considered potentially pathological. PopRIs are generally required to be obtained from well-defined reference individuals using International Federation of Clinical Chemistry and Laboratory Medicine (IFCC) criteria (1). However, popRIs are not universal and different RIs can be obtained from different populations, measurement methods, etc. It is therefore recommended that each laboratory should determine their own popRI based on the measurement methods in their laboratory (2). However, for laboratories it is time consuming, and deriving updated popRIs is expensive and, in many cases, laboratories prefer popRIs recommended by manufacturers or modified popRIs obtained from other sources. Many commonly requested measurands show marked individuality, i.e., the variation of the concentration of a measurand within the individual is small compared to the variation of the concentration of the same measurand between individuals. This means that a personal reference interval will occupy only a small range of the popRIs (2). Therefore, the data derived from population studies are less relevant, even when partitioned into subgroups, to the assessment or monitoring of test results in individuals. For clinicians, the main concern is whether the actual test result from a specific patient is indicative of disease or not. To answer this question, a personalized reference interval (prRI); i.e., a reference interval for that specific individual would be useful. The availability of a simple method for establishing prRIs would be highly beneficial to both clinicians and patients.
The present study aimed to develop a model to derive prRIs based on estimates of analytical and within-subject biological variation (CVI) and previous test results for an individual, to assess the effect of including different numbers of previous test results on the prRI and to calculate prRI for commonly requested measurands for participants in steady-state conditions.
Materials and Methods
Study Population
We included results of 27 commonly requested clinical chemistry and hematology measurands to establish prRIs for 784 (female/male = 328/456) different participants in steady-state conditions with no known disease that was related to or could impact the measurands that were included in our study. The median age of the study population was 42 years (range 18–69 years) at the time of the first included test result. All data were derived from the Acibadem Healthcare Group checkup clinic in Istanbul. In this clinic, patients are seen for a routine, general medical examination and not for a specific health problem. Practically, we searched our laboratory database for patients who had been seen at the checkup unit in the previous 15 years, this yielded 212 493 patients. Thereafter, we applied a filter so that only patients above 18 years were included (n = 209 531). We then searched the dataset separately for each measurand for participants who had had at least 10 measurements performed during the time period. For each measurand, we reviewed the laboratory and clinical data. Participants with results above the popRI and/or relevant clinical decisions limits and participants with known diseases related to the measurand in question (e.g., for glucose, patients with a diagnosis of diabetes, etc.) were excluded. For all selected participants, we included the last 10 consecutive test results included in the laboratory information system. The resulting data had been analyzed over a time period of 2–15 years (median 10 years). The analytical CV (CVA) estimates used in our study were derived from routine analyses in the laboratory of the Acibadem Healthcare Group. Since the samples were analyzed at different times during the study period, the pooled CVA estimates for the whole study period for each measurand were applied in the prRI calculations. The CVI estimates of the analytes were obtained from the European Federation of Clinical Chemistry and Laboratory Medicine (EFLM) Biological Variation (BV) Database (3). The research project was approved by the Institutional Ethical Committee.
Model of prRI
The prRI of a measurand can be described as the interval around its homeostatic set point. The magnitude of the prRI can be estimated, using estimates of CVI, CVA, and, within a given probability, the uncertainty of the homeostatic set point which is based on the number of measurement results (n).
We used a two-step algorithm to develop prRI. The steps are as follows:
Increasing the number of measurements will decrease the uncertainty around the true homeostatic set point, and D will decrease proportionally with the square root of n (2, 4).
It should be noted that Eq. (4) refers to the prediction interval for “unknown mean, known variance”, which is connected with the factor (1 + 1/n) (5).
The total variation around the set point as calculated in Eq. (4) is independent of the concentration of analytes, as it is a function of the estimates of CVA, CVI, and n.
A flow chart showing how to practically derive the prRI for an individual is given in Fig. 1.
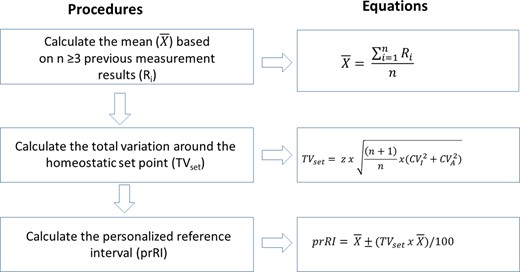
A flowchart illustrating how to practically derive the personalized reference interval (prRI) using relevant estimates of CVI, CVA, and a patient’s previous measurement results.
PopRI and Reference Range Index
RRis were calculated separately for males and females, based on prRIs derived from 3 (RRi-3) and 10 measurement (RRi-10) results, respectively, and compared with index of individuality (Eq. (2)).
Results
Theoretically, it is possible to calculate prRI for an individual using only 1 previous measurement result. However, such a prRI may be associated with large levels of uncertainty (41%) and may not be reliable enough for clinical practice. To assess the reliability of prRI related to the number of included previous results, we examined the effect of including different numbers of previous test results on the total variation around the homeostatic set point. To illustrate only the effect of an increasing n, we used a fixed CVA estimate in the calculations, set as 0.5CVI for the measurand in question. Increasing the number of included previous measurement results from 3 to 100 had little effect on the total variation around the true homeostatic set point as illustrated in Table 1 for all 27 measurands. Thus, the width of the prRI is little influenced by including more than 3 previous test results, as illustrated in Table 2 for creatinine and leukocyte counts for 2 randomly chosen study participants. This is further illustrated in Fig. 2, A–D for cholesterol and potassium, where the distribution of prRI with regard to the number of included measurements is displayed for 8 participants, 4 males and 4 females. In our database, we identified in total 784 adult patients who had at least 10 measurements performed in a steady state setting for the different measurands. The highest number of participants was available for creatinine (n = 567) and the lowest for potassium (n = 22) (Table 3). We calculated prRI for all of these participants, based on 3 and 10 previous test results. Although the prRIs of most individuals were located within the popRI, the upper and lower limits of prRI for different participants were different from each other for these analytes. We furthermore calculated the mean of the range (i.e., the upper prRI limit – lower prRI limit) for all the individual prRIs separately for males and females, based on 3 (prRI-3) and 10 (prRI-10) measurement results as shown in Table 3 for the 27 measurands. The RRis, representing the ratio of the range of prRI to the range of popRI based on 3 (RRi-3) and 10 (RRi-10) measurements, were either comparable to or lower than the corresponding IIs for most measurands (Table 3). The highest differences between RRi-3 and RRi-10 were noted for lactate dehydrogenase (LDH), aspartate aminotransferase (AST), and alanine aminotransferase (ALT) in females, with values of 0.27, 0.11, and 0.10, respectively (Table 3). Similarly, the highest differences between RRi-3 and RRi-10 were noted for LDH, ALT, and albumin in males, with values of 0.20, 0.16, and 0.12, respectively (Table 3). Chloride was the measurand with the highest RRi-10, at 0.97 and 0.96 for females and males, respectively, whereas basophil count was the measurand with the lowest RRi-10, at 0.09 for both females and males. prRIs and RRi calculated for 10 randomly chosen participants for the 27 measurands, making up in total 114 different participants, along with detailed information on age of participants, time of samplings, analytical platform, and CVA estimates are provided in Table 1 in the online Data Supplement.
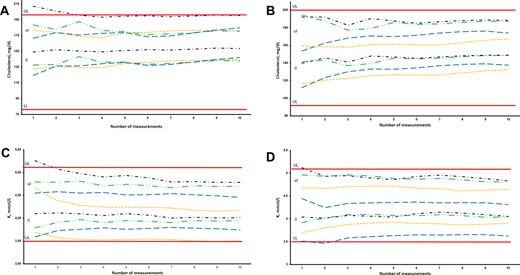
Personalized reference intervals (prRI) of 8 different individuals for a) cholesterol-male, b) cholesterol-female, c) potassium-male, and d) potassium-female, calculated from up to 10 measurements obtained from routine assessment at steady state. Continuous lines: upper limit (UL) and lower limit (LL) of population-based reference interval. Sets of lines: upper limit (ul) and lower limit (ll) of pRI.
The effect of increasing the number of measurements (from 1 to 100) on the total variation around the true homeostatic set points for the 27 measurands included in the study. To illustrate only the effect of increasing the number of measurements, the CVA is fixed and set as 0.5CVI for the measurand in question.
| Measurands | CVI | CVA | n | |||||||||||||
|---|---|---|---|---|---|---|---|---|---|---|---|---|---|---|---|---|
| 1 | 2 | 3 | 4 | 5 | 6 | 7 | 8 | 9 | 10 | 20 | 50 | 100 | ||||
| ((n + 1)/n)1/2 | ||||||||||||||||
| 1.41 | 1.22 | 1.15 | 1.12 | 1.10 | 1.08 | 1.07 | 1.06 | 1.05 | 1.05 | 1.02 | 1.01 | 1.00 | ||||
| TVset (%) | ||||||||||||||||
| Urea (mg/dL) | 13.9 | 6.95 | 43.25 | 37.45 | 35.31 | 34.19 | 33.50 | 33.03 | 32.69 | 32.43 | 32.23 | 32.07 | 31.34 | 30.88 | 30.73 | |
| Eosinophils (×109/L) | 12.3 | 6.15 | 38.27 | 33.14 | 31.25 | 30.25 | 29.64 | 29.23 | 28.93 | 28.70 | 28.52 | 28.38 | 27.73 | 27.33 | 27.19 | |
| Monocytes (×109/L) | 11.6 | 5.80 | 36.09 | 31.26 | 29.47 | 28.53 | 27.96 | 27.56 | 27.28 | 27.07 | 26.90 | 26.77 | 26.15 | 25.77 | 25.65 | |
| Basophils (×109/L) | 11.4 | 5.70 | 35.47 | 30.72 | 28.96 | 28.04 | 27.47 | 27.09 | 26.81 | 26.60 | 26.44 | 26.30 | 25.70 | 25.33 | 25.21 | |
| ALT (IU/L) | 10.4 | 5.20 | 32.36 | 28.02 | 26.42 | 25.58 | 25.06 | 24.71 | 24.46 | 24.27 | 24.12 | 24.00 | 23.45 | 23.11 | 22.99 | |
| WBC (×109/L) | 10.3 | 5.15 | 32.05 | 27.75 | 26.17 | 25.33 | 24.82 | 24.48 | 24.22 | 24.03 | 23.89 | 23.77 | 23.22 | 22.89 | 22.77 | |
| Lymphocytes (×109/L) | 10.3 | 5.15 | 32.05 | 27.75 | 26.17 | 25.33 | 24.82 | 24.48 | 24.22 | 24.03 | 23.89 | 23.77 | 23.22 | 22.89 | 22.77 | |
| AST (IU/L) | 9.5 | 4.75 | 29.56 | 25.60 | 24.13 | 23.37 | 22.89 | 22.57 | 22.34 | 22.17 | 22.03 | 21.92 | 21.42 | 21.11 | 21.00 | |
| Neutrophils (×109/L) | 9.5 | 4.75 | 29.56 | 25.60 | 24.13 | 23.37 | 22.89 | 22.57 | 22.34 | 22.17 | 22.03 | 21.92 | 21.42 | 21.11 | 21.00 | |
| GGT (IU/L) | 8.8 | 4.40 | 27.38 | 23.71 | 22.36 | 21.65 | 21.21 | 20.91 | 20.70 | 20.53 | 20.41 | 20.30 | 19.84 | 19.55 | 19.46 | |
| LDL cholesterol (mg/dL) | 8.3 | 4.15 | 25.82 | 22.36 | 21.08 | 20.42 | 20.00 | 19.72 | 19.52 | 19.37 | 19.25 | 19.15 | 18.71 | 18.44 | 18.35 | |
| HDL cholesterol (mg/dL) | 5.7 | 2.85 | 17.73 | 15.36 | 14.48 | 14.02 | 13.74 | 13.54 | 13.41 | 13.30 | 13.22 | 13.15 | 12.85 | 12.66 | 12.60 | |
| PLT (109/L) | 5.6 | 2.80 | 17.42 | 15.09 | 14.23 | 13.77 | 13.50 | 13.31 | 13.17 | 13.07 | 12.99 | 12.92 | 12.62 | 12.44 | 12.38 | |
| Cholesterol (mg/dL) | 5.3 | 2.65 | 16.49 | 14.28 | 13.46 | 13.04 | 12.77 | 12.59 | 12.47 | 12.37 | 12.29 | 12.23 | 11.95 | 11.78 | 11.72 | |
| LDH (IU/L) | 5.2 | 2.60 | 16.18 | 14.01 | 13.21 | 12.79 | 12.53 | 12.36 | 12.23 | 12.13 | 12.06 | 12.00 | 11.72 | 11.55 | 11.50 | |
| Glucose (mg/dL) | 5.0 | 2.50 | 15.56 | 13.47 | 12.70 | 12.30 | 12.05 | 11.88 | 11.76 | 11.67 | 11.60 | 11.54 | 11.27 | 11.11 | 11.05 | |
| Creatinine (mg/dL) | 4.5 | 2.25 | 14.00 | 12.12 | 11.43 | 11.07 | 10.84 | 10.69 | 10.58 | 10.50 | 10.44 | 10.38 | 10.14 | 10.00 | 9.95 | |
| K (mmol/L) | 4.1 | 2.05 | 12.76 | 11.05 | 10.42 | 10.08 | 9.88 | 9.74 | 9.64 | 9.57 | 9.51 | 9.46 | 9.24 | 9.11 | 9.06 | |
| Hgb (g/dL) | 2.7 | 1.35 | 8.40 | 7.27 | 6.86 | 6.64 | 6.51 | 6.42 | 6.35 | 6.30 | 6.26 | 6.23 | 6.09 | 6.00 | 5.97 | |
| Total protein (g/dL) | 2.6 | 1.30 | 8.09 | 7.01 | 6.60 | 6.40 | 6.27 | 6.18 | 6.11 | 6.07 | 6.03 | 6.00 | 5.86 | 5.78 | 5.75 | |
| Albumin (g/dL) | 2.6 | 1.30 | 8.09 | 7.01 | 6.60 | 6.40 | 6.27 | 6.18 | 6.11 | 6.07 | 6.03 | 6.00 | 5.86 | 5.78 | 5.75 | |
| RBC (×1012/L) | 2.6 | 1.30 | 8.09 | 7.01 | 6.60 | 6.40 | 6.27 | 6.18 | 6.11 | 6.07 | 6.03 | 6.00 | 5.86 | 5.78 | 5.75 | |
| Cl (mmol/L) | 1.5 | 0.55 | 3.42 | 2.96 | 2.79 | 2.71 | 2.65 | 2.61 | 2.59 | 2.57 | 2.55 | 2.54 | 2.48 | 2.44 | 2.43 | |
| MCHC (g/dL) | 1.0 | 0.50 | 3.11 | 2.69 | 2.54 | 2.46 | 2.41 | 2.38 | 2.35 | 2.33 | 2.32 | 2.31 | 2.25 | 2.22 | 2.21 | |
| MCV (fL) | 0.8 | 0.40 | 2.49 | 2.16 | 2.03 | 1.97 | 1.93 | 1.90 | 1.88 | 1.87 | 1.86 | 1.85 | 1.80 | 1.78 | 1.77 | |
| MCH (pg) | 0.8 | 0.40 | 2.49 | 2.16 | 2.03 | 1.97 | 1.93 | 1.90 | 1.88 | 1.87 | 1.86 | 1.85 | 1.80 | 1.78 | 1.77 | |
| Na (mmol/L) | 0.5 | 0.25 | 1.56 | 1.35 | 1.27 | 1.23 | 1.20 | 1.19 | 1.18 | 1.17 | 1.16 | 1.15 | 1.13 | 1.11 | 1.11 | |
Personalized reference intervals with results for the allowed percentage deviation (D) from and the total variation [TV(set)] around the true homeostatic set point of creatinine and leukocytes for 2 different subjects utilizing an increasing numbers of test results (n), with calculations based on (a) desirable analytical CV defined as 0.5 CVI and (b) laboratory-derived long-term CVA estimates.
| Measurands | n | Time since previous sample (months; days) | Result | Mean of n test results | Calculation based on CVA = 0.5CVI | Calculation based on laboratory CVA | ||||||
|---|---|---|---|---|---|---|---|---|---|---|---|---|
| D | TV(set) | prRI-LL | prRI-UL | D | TV(set) | prRI-LL | prRI-UL | |||||
Creatinine (popRI: 0.70–1.30 mg/dL) | 1 | – | 1.01 | 1.01 | 9.86 | 13.95 | 0.87 | 1.15 | 9.99 | 14.12 | 0.87 | 1.15 |
| 2 | 25; 2 | 0.91 | 0.96 | 6.97 | 12.08 | 0.84 | 1.08 | 7.28 | 12.61 | 0.84 | 1.08 | |
| 3 | 11; 20 | 0.97 | 0.96 | 5.69 | 11.39 | 0.85 | 1.07 | 5.77 | 11.55 | 0.85 | 1.07 | |
| 4 | 12; 25 | 1.00 | 0.97 | 4.93 | 11.03 | 0.87 | 1.08 | 5.01 | 11.20 | 0.86 | 1.08 | |
| 5 | 14; 20 | 1.05 | 0.99 | 4.41 | 10.80 | 0.88 | 1.09 | 4.43 | 10.85 | 0.88 | 1.10 | |
| 6 | 11; 7 | 0.93 | 0.98 | 4.03 | 10.65 | 0.87 | 1.08 | 4.10 | 10.85 | 0.87 | 1.08 | |
| 7 | 12; 21 | 1.08 | 0.99 | 3.73 | 10.54 | 0.89 | 1.10 | 3.77 | 10.67 | 0.89 | 1.10 | |
| 8 | 11; 15 | 0.97 | 0.99 | 3.49 | 10.46 | 0.89 | 1.09 | 3.54 | 10.62 | 0.88 | 1.10 | |
| 9 | 13; 2 | 1.08 | 1.00 | 3.29 | 10.39 | 0.90 | 1.10 | 3.33 | 10.53 | 0.89 | 1.11 | |
| 10 | 23; 6 | 0.99 | 1.00 | 3.12 | 10.34 | 0.90 | 1.10 | 3.17 | 10.50 | 0.89 | 1.10 | |
Leukocytes (popRI: 4.06–10.6 × 10⁹/L) | 1 | – | 7.60 | 7.60 | 22.57 | 31.92 | 5.17 | 10.03 | 20.54 | 29.04 | 5.39 | 9.81 |
| 2 | 12; 7 | 8.01 | 7.81 | 15.96 | 27.64 | 5.65 | 9.96 | 14.54 | 25.18 | 5.84 | 9.77 | |
| 3 | 11; 29 | 8.13 | 7.91 | 13.03 | 26.06 | 5.85 | 9.98 | 11.91 | 23.82 | 6.03 | 9.80 | |
| 4 | 11; 9 | 7.43 | 7.79 | 11.29 | 25.24 | 5.83 | 9.76 | 10.29 | 23.01 | 6.00 | 9.59 | |
| 5 | 12; 6 | 8.57 | 7.95 | 10.09 | 24.73 | 5.98 | 9.91 | 9.21 | 22.56 | 6.16 | 9.74 | |
| 6 | 11; 22 | 7.64 | 7.90 | 9.21 | 24.38 | 5.97 | 9.82 | 8.43 | 22.29 | 6.14 | 9.66 | |
| 7 | 12; 5 | 6.42 | 7.69 | 8.53 | 24.13 | 5.83 | 9.54 | 7.82 | 22.12 | 5.99 | 9.39 | |
| 8 | 9; 20 | 7.80 | 7.70 | 7.98 | 23.94 | 5.86 | 9.54 | 7.32 | 21.95 | 6.01 | 9.39 | |
| 9 | 15; 17 | 7.22 | 7.65 | 7.52 | 23.79 | 5.83 | 9.47 | 6.89 | 21.80 | 5.98 | 9.31 | |
| 10 | 11; 12 | 7.28 | 7.61 | 7.14 | 23.67 | 5.81 | 9.41 | 6.54 | 21.68 | 5.96 | 9.26 | |
n: number of measurements; popRI: population-based reference interval; D: the allowed percentage deviation from the true homeostatic set point; TV(set): total variation around true homeostatic set point; prRI: personalized reference interval; LL: lower limit; UL: upper limit; The laboratory CVA is the pooled CVA for the period (see Materials and Methods). CVA (creatinine): 2.42; CVA (WBC): 2.27%.
Mean of the range of personalized reference intervals (i.e., upper prRI limit – lower prRI limit) derived from 3 (prRI-3) and 10 (prRI-10) measurements for males (M) and females (F) with corresponding reference range indices representing the ratio of the prRI to the population RI (RRi-3 and RRi-10) and indices of individuality (II) for 27 commonly requested measurands.
| Measurands (unit) | Number of patients (F/M) | CVI | Mean range prRI-3 (F) (95% CI) | Mean range prRI-10 (F) (95% CI) | Mean range prRI-3 (M) (95% CI) | Mean range prRI-10 (M) (95% CI) | RRi-3 (prRI-3/ popRI) (F) (95% CI) | RRi-10 (prRI-10/ popRI) (F) (95% CI) | RRi-3 (prRI-3/ PopRI) (M) (95% CI) | RRi-10 (prRI-10/ PopRI) (M) (95% CI) | II |
|---|---|---|---|---|---|---|---|---|---|---|---|
Glucose (mg/dL) | 323 (173/150) | 5.0 | 21.5 (21.3–21.7) | 19.7 (19.6–19.8) | 22.1 (21.9–22.3) | 20.1 (20.0–20.2) | 0.72 (0.71–0.72) | 0.66 (0.65–0.66) | 0.74 (0.73–0.74) | 0.67 (0.67–0.67) | 0.62 |
Urea (mg/dL) | 233 (69/164) | 13.9 | 16.0 (15.4–16.6) | 15.1 (14.5–15.7) | 18.0 (17.4–18.5) | 16.8 (16.4–17.3) | 0.40 (0.38–0.42) | 0.38 (0.36–0.39) | 0.45 (0.44–0.46) | 0.42 (0.41–0.43) | 0.68 |
Creatinine (mg/dL) | 567 (228-339) | 4.5 | 0.16 (0.16–0.16) | 0.15 (0.15–0.15) | 0.22 (0.21–0.22) | 0.20 (0.20–0.20) | 0.40 (0.39–0.40) | 0.32 (0.31–0.32) | 0.43 (0.43–0.44) | 0.33 (0.33–0.34) | 0.31 |
ALT (IU/L) | 343 (163/180) | 10.4 | 8.7 (8.3–9.1) | 9.8 (9.5–10.1) | 12.1 (11.7–12.5) | 12.4 (12.0–12.7) | 0.31 (0.30–0.32) | 0.21 (0.20–0.22) | 0.40 (0.39–0.41) | 0.24 (0.24–0.25) | 0.36 |
AST (IU/L) | 340 (160/180) | 9.5 | 8.9 (8.6–9.1) | 7.8 (7.6–8.0) | 10.0 (9.7–10.2) | 8.6 (8.4–8.8) | 0.40 (0.39–0.41) | 0.29 (0.28–0.30) | 0.40 (0.39–0.41) | 0.32 (0.31–0.33) | 0.47 |
GGT (IU/L) | 264 (106/158) | 8.8 | 5.0 (4.5–5.4) | 5.8 (5.3–6.2) | 10.3 (9.6–10.9) | 10.3 (9.7–10.8) | 0.16 (0.15–0.18) | 0.11 (0.11–0.12) | 0.19 (0.18–0.21) | 0.15 (0.14–0.15) | 0.21 |
LDH (IU/L) | 41 (6/35) | 5.2 | 40.5 (36.6–44.4) | 37.1 (34.2–40.1) | 41.6 (40.0–43.2) | 37.4 (36.2–38.7) | 0.51 (0.46–0.56) | 0.24 (0.22–0.26) | 0.46 (0.44–0.48) | 0.26 (0.25–0.27) | 0.42 |
Cholesterol (mg/dL) | 36 (12/24) | 5.3 | 42.2 (39.6–44.7) | 39.8 (38.1–41.5) | 41.7 (39.9–43.5) | 38.5 (37.4–39.7) | 0.39 (0.37–0.41) | 0.37 (0.35–0.38) | 0.35 (0.34–0.37) | 0.33 (0.32–0.34) | 0.30 |
| HDL cholesterol (mg/dL) | 37 (11/26) | 5.7 | 18.0 (16.6–19.3) | 16.8 (15.6–18.0) | 14.8 (13.9–15.7) | 13.8 (13.0–14.6) | NA | NA | NA | NA | 0.23 |
| LDL cholesterol (mg/dL) | 36 (12/24) | 8.3 | 38.0 (35.6–40.4) | 35.0 (33.4–36.7) | 38.1 (35.9–40.4) | 35.5 (33.4–37.0) | 0.48 (0.45–0.50) | 0.44 (0.42–0.46) | 0.48 (0.45–0.50) | 0.44 (0.42–0.46) | 0.31 |
| Total protein (g/dL) | 55 (25/30) | 2.6 | 1.05 (1.01–1.09) | 0.92 (0.90–0.94) | 1.05 (1.03–1.08) | 0.93 (0.91–0.94) | 0.55 (0.53–0.58) | 0.51 (0.50–0.52) | 0.55 (0.54–0.57) | 0.51 (0.51–0.52) | 0.56 |
Albumin (g/dL) | 54 (25/29) | 2.6 | 0.72 (0.68–0.75) | 0.59 (0.57–060) | 0.74 (0.71–0.77) | 0.61 (0.59–0.62) | 0.48 (0.46–0.50) | 0.37 (0.36–0.38) | 0.50 (0.48–0.52) | 0.38 (0.37–0.39) | 0.50 |
Na (mmol/L) | 24 (9/15) | 0.5 | 7.8 (7.1–8.5) | 7.7 (6.4–9.0) | 8.1 (7.7–8.4) | 7.5 (7.1–7.9) | 0.87 (0.79–0.94) | 0.86 (0.72–0.99) | 0.89 (0.85–0.94) | 0.83 (0.79–0.88) | 0.45 |
K (mmol/L) | 22 (9/13) | 4.1 | 0.83 (0.81–0.86) | 0.75 (0.73–0.77) | 0.84 (0.82–0.86) | 0.75 (0.73–0.78) | 0.52 (0.51–0.54) | 0.47 (0.46–0.48) | 0.52 (0.51–0.54) | 0.47 (0.46–0.48) | 0.97 |
Cl (mmol/L) | 24 (9/15) | 1.1 | 8.7 (7.8–9.5) | 8.7 (8.3–9.1) | 8.4 (7.9–8.9) | 8.6 (8.4–8.9) | 0.97 (0.87–1.06) | 0.97 (0.92–1.01) | 0.94 (0.88–0.99) | 0.96 (0.93–0.99) | 0.84 |
RBC (×1012/L) | 314 (114/200) | 2.6 | 0.60 (0.59–0.60) | 0.54 (0.53–0.54) | 0.68 (0.68–0.69) | 0.61 (0.60–0.61) | 0.33 (0.33–0.34) | 0.38 (0.38–0.39) | 0.31 (0.31–0.31) | 0.41 (0.40–0.41) | 0.40 |
Hgb (g/dL) | 314 (114/200) | 2.7 | 1.80 (1.78–1.82) | 1.61 (1.60–1.63) | 2.06 (2.04–2.07) | 1.83 (1.82–1.85) | 0.45 (0.45–0.45) | 0.54 (0.53–0.54) | 0.46 (0.45–0.46) | 0.52 (052–0.53) | 0.46 |
MCV (fL) | 314 (114/200) | 0.8 | 5.24 (5.15–5.32) | 4.37 (4.31–4.42) | 5.15 (5.09–5.22) | 4.32 (4.28–4.35) | 0.35 (0.34–0.35) | 0.35 (0.35–0.36) | 0.34 (0.34–0.35) | 0.32 (0.31–0.32) | 0.22 |
MCH (pg) | 314 (114/200) | 0.8 | 2.17 (2.13–2.21) | 1.87 (1.84–1.89) | 2.18 (2.15–2.22) | 1.89 (1.87–1.91) | 0.24 (0.24–0.25) | 0.29 (0.29–0.30) | 0.24 (0.24–0.25) | 0.30 (0.29–0.30) | 0.18 |
MCHC (g/dL) | 314 (114/200) | 1.0 | 2.87 (2.82–2.92) | 2.47 (2.45–2.50) | 2.89 (2.85–2.92) | 2.52 (2.50–2.54) | 0.48 (0.47–0.49) | 0.49 (0.49–0.50) | 0.48 (0.48–0.49) | 0.50 (0.50–0.51) | 0.71 |
WBC (×109/L) | 329 (135/194) | 10.3 | 3.16 (3.07–3.24) | 2.86 (2.79–2.92) | 3.09 (3.03–3.16) | 2.81 (2.75–2.86) | 0.51 (0.50–0.52) | 0.44 (0.43–0.45) | 0.50 (0.49–0.51) | 0.43 (0.42–0.44) | 0.60 |
Neutrophils (×109/L) | 329 (135/194) | 9.5 | 1.70 (1.63–1.76) | 1.52 (1.47–1.57) | 1.63 (1.59–1.68) | 1.49 (1.45–1.53) | 0.34 (0.33–0.35) | 0.30 (0.29–0.31) | 0.33 (0.32–0.34) | 0.29 (0.28–0.30) | 0.45 |
Lymphocyte (×109/L) | 329 (135/194) | 10.3 | 1.17 (1.14–1.20) | 1.07 (1.04–1.10) | 1.14 (1.11–1.17) | 1.02 (0.99–1.04) | 0.51 (0.49–0.52) | 0.43 (0.42–0.45) | 0.50 (0.48–0.51) | 0.41 (0.40–0.42) | 0.43 |
Monocytes (×109/L) | 329 (135/194) | 11.6 | 0.39 (0.38–0.40) | 0.35 (0.34–0.36) | 0.41 (0.40–0.43) | 0.37 (0.36–0.38) | 0.56 (0.54–0.58) | 0.53 (0.52–0.55) | 0.59 (0.57–0.61) | 0.57 (0.55–0.58) | 0.71 |
Eosinophils (×109/L) | 329 (135/194) | 12.3 | 0.11 (0.10–0.12) | 0.10 (0.09–0.10) | 0.12 (0.11–0.13) | 0.11 (0.10–0.12) | 0.23 (0.21–0.25) | 0.18 (0.17–0.20) | 0.26 (0.24–0.28) | 0.21 (0.20–0.22) | 0.19 |
Basophils (×109/L) | 329 (135/194) | 11.4 | 0.02 (0.01–0.02) | 0.02 (0.01–0.02) | 0.02 (0.01–0.02) | 0.02 (0.01–0.02) | 0.09 (0.09–0.10) | 0.09 (0.09–0.10) | 0.09 (0.09–0.10) | 0.09 (0.09–0.10) | 0.45 |
PLT (109/L) | 314 (114/200) | 5.6 | 84.2 (81.3–87.1) | 77.3 (74.8–79.8) | 77.9 (76.1–79.7) | 70.3 (68.7–71.8) | 0.34 (0.33–0.35) | 0.27 (0.26–0.28) | 0.31 (0.30–0.32) | 0.24 (0.24–0.25) | 0.29 |
Discussion
The concept of personalized medicine has gained an ever-increasing foothold in the last decade. Individuals have unique characteristics at the molecular, physiological, and behavioral levels, which also vary due to environmental exposure (7). However, the success of personalized interventions depends on the correct diagnosis and monitoring of patients, and for these purposes the interpretation of patients’ test results must also be “personalized.” This can be achieved by comparing their test results with their own prRIs, and not with common popRIs.
We have developed an easy novel conceptual algorithm to derive person-specific RIs. This algorithm is based on estimates of CVI and CVA and consecutive test results collected over time from individuals in steady state for the measurand in question. This approach should be easy to implement in medical laboratories, as well as in laboratory information systems. We have shown that only a few previous test results are sufficient to obtain reliable prRIs (Table 1). The test results from the participants included in our study were collected over a time period of 2–15 years, but prRIs remained stable and were not affected much by the length of the sample collection (Supplemental Table 1).
The challenge here is that we do not know the exact value of the set point. To overcome this problem, we applied the equation of the “prediction interval” with unknown mean and known variances (the sum of analytical and within-subject biological variances), which is connected with a factor of (1 + 1/n) (Eq. (5)) (5). The set point can be estimated within a given probability using Eq. (I) (2). As described in this equation, we need at least 2 data points to make a statistical calculation and to deliver a relatively reliable estimate. The decisive factor is the CVI of the measurand rather than the number of measurements results (n). This is because in Eqs. (3) and (4), “n” is present in both the numerator and the denominator and therefore has limited effects on the total variation around the set point. Based on our results, we can recommend use of the model for an individual who has ≥3 previous measurements results obtained in a steady-state situation as illustrated by Table 1.
The equation of variation around the set point (Eq. (4)) is similar to that used to calculate classical RCV, i.e., RCV = 1.96 × 21/2 × ( + )1/2. Specifically, if n = 1, then RCV = TVset. The RCV evaluates the change from one measurement to the other to see if a difference between 2 consecutive measurements can be explained by biological and analytical variation. The prRI concept is similar, using a representative, long-term CVA estimate for the period in which samplings have been performed and the mean of previous results to illustrate the steady-state situation for the patient, but our results show that the prRI should be based on ≥3 previous test results.
In prRIs, the applied CVA estimates will in general not add much to the total variability since they are for most measurands <0.5 CVI. It is, however, important that the CVI estimates used to deliver prRIs are obtained from reliable and well-characterized studies with homogeneous data to ensure that the estimates, and the associated prRI, are generalizable to the population—and participant—to which they will be applied. Ideally, a CVI estimate should be calculated for each individual person. However, this is practically not easily implemented as it would require a high number of samples from each participant. The pragmatic solution is therefore to use CVI estimates delivered from high-quality studies of adequately characterized and homogenous population subgroups. The EFLM Working Group on BV and Task Group on the BV Database have developed the Biological Variation Data Critical Appraisal Checklist (BIVAC), which is used to evaluate the quality of published BV data (8). They have also developed a metaanalysis approach to deliver global BV estimates based on BIVAC compliant studies (9–11), the results of which are made available in the recently launched EFLM Biological Variation Database (3). The EFLM BV Database, freely available to users worldwide, provides high-quality BV data for many measurands (3). For other measurands included in the EFLM BV Database, the CVI estimates are based on few or only low-quality studies and adequate subgroup analysis is lacking. When using these latter estimates as basis for prRI and other BV applications, the results must be interpreted with this in mind.
As shown in Table 3, the ratios of the range of prRI to the range of popRI, the RRis, of the measurands were either comparable to or lower than the corresponding IIs, except for sodium. Individuality is commonly observed in laboratory medicine (2). As shown in the EFLM BV Database (3), the II, for the majority of the included measurands, is lower than 0.6, indicating marked individuality. This implies that popRIs are not efficient for assessing changes in patients’ test results over time and that prRI are preferable. The II is higher than 1.0 for only a few measurands such as parathyroid hormone, estradiol, and androstenedione (3). PopRIs are suitable for the assessment of measurands with a high II, particularly when it is >1.4 (2). PrRI, on the other hand, will be useful for measurands with a low II (Table 3). In our study, all the included measurands had a low II (<1.0) (Table 3).
From a practical point of view, a healthy individual could have their own prRI calculated in a steady-state situation by having samples analyzed for this purpose. To illustrate our model by using real-life data, we selected study participants who were considered to be in steady state after reviewing clinical and laboratory information and excluded any participant with results outside the popRI or clinical decision limits. As illustrated in Table 1 and Fig. 2, A–D, only a few measurements were sufficient to calculate the prRIs for all the 27 commonly requested clinical chemistry and hematology analytes included in our study.
We propose to use the prRI in combination with the popRI, particularly if we have only one or 2 data points for a measurand on which to base the prRI. Further studies are warranted to evaluate the best application of prRI. However, if an analyte is being used in clinical practice for the first time, we advise to first determine the popRI of the analyte and then calculate the prRI when more results accumulate for each person.
Limitations
Our model depends on data from a steady-state situation being available and that these data can be identified; e.g., in the laboratory information system. Criteria, such as those set out by the IFCC for reference individuals recruited to generate popRIs are principally also valid for prRIs. Therefore, the individuals must be healthy and in steady-state conditions and must not be taking any drugs that may impact the levels of the analytes. Additionally, the measurement result of the test should not be above decision limits described in national/international guidelines. If the participant is not in steady state, then the mean value of the analytes will be different and the model cannot be used. It is furthermore of importance that the measurement results included in the prRI should derive from the same analytical method, or if not, from analytical methods providing harmonized results. If results have been obtained using methods that may have systematic deviation from each other, this may create a shift in the homeostatic set point and thus cannot be used as basis for prRI. This could also limit the transferability of prRI from one laboratory to another. Furthermore, for measurands where the test results of healthy individuals are close to the limit of quantitation, CVs may not be the best representation of BV and this may limit the use of the model.
Conclusions
We consider prRI to be a step forward in advancing personalized medicine in the field of laboratory medicine (12). PrRI can be easily calculated in any healthcare service because it does not require sophisticated technologies or expensive experiments and can easily be implemented in laboratory information systems (Fig. 1). The delivery of a prRI requires reliable CVI estimates, which are easily accessible for most measurands (3), and a few measurement results of the patient in a steady state situation, which will likely be available for most patients.
Supplemental Material
Supplemental material is available at Clinical Chemistry online.
Author Declaration
A version of this paper was previously posted as a preprint on medRxiv as https://www.medrxiv.org/content/10.1101/2020.02.07.20020446v1.
Author Contributions
All authors confirmed they have contributed to the intellectual content of this paper and have met the following 4 requirements: (a) significant contributions to the conception and design, acquisition of data, or analysis and interpretation of data; (b) drafting or revising the article for intellectual content; (c) final approval of the published article; and (d) agreement to be accountable for all aspects of the article thus ensuring that questions related to the accuracy or integrity of any part of the article are appropriately investigated and resolved.
A. Coşkun, statistical analysis, administrative support; C. Cavusoglu, statistical analysis, provision of study material or patients; M. Serteser, administrative support, provision of study material or patients; M. Kilercik, statistical analysis, administrative support.
Authors' Disclosures or Potential Conflicts of Interest
No authors declared any potential conflicts of interest.
Role of Sponsor
No sponsor was declared.
References
Clinical and Laboratory Standards Institute (CLSI). Defining, Establishing, and Verifying Reference Intervals in the Clinical Laboratory; Approved Guideline—Third Edition. CLSI document EP28-A3c. Wayne, PA: Clinical and Laboratory Standards Institute;
Nonstandard Abbreviations:
- popRI
population-based reference interval;
- IFCC
International Federation of Clinical Chemistry and Laboratory Medicine
- prRI
personalized reference interval
- ALT
alanine aminotransferase
- CVI
within-subject biological variation
- CVA
analytical variation
- EFLM
European Federation of Clinical Chemistry and Laboratory Medicine
- UL
upper limit
- LL
lower limit
- BV
biological variation
- D
allowed percentage deviation from the true homeostatic set point
- CLSI
Clinical Laboratory Standards Institute
- RRi
reference range index
- II
index of individuality
- CVG
between-subject biological variation
- RCV
Reference change value
- BIVAC
Biological Variation Data Critical Appraisal Checklist
