


Abstract
The functional trait framework, an ecological tool powerful for its simplicity and ability to facilitate modeling and generalization across environmental gradients, can capture the interactions between ecological and physical processes that shape riparian ecosystems. We demonstrate that ecological-response traits that describe how a plant will respond to abiotic stressors are similar, or strongly correlated, to morphological-effect traits important for determining how a plant alters the flow of water and transport of sediment. This link allows for modeling the distribution of ecological and morphological traits on the basis of environmental conditions. Observations of the topographic response of vegetated plots to moderate flood events illustrate how plant traits can be linked to landform geometry. As such, the functional trait framework provides a modeling approach to understand the coupled dynamics of ecogeomorphic systems and inform their conservation.
Human population growth, climate change, and other anthropogenic effects have altered and impaired freshwater ecosystems (Vörösmarty et al. 2010). Conservation of freshwater systems requires an understanding of the complex, interdependent ecological and physical processes that maintain form and function (Wohl et al. 2015). Despite advances in this area (Naiman et al. 2005), capturing these dynamic processes and developing mechanistic, generalizable relationships persist as a challenging but central element of developing predictive models of ecological and geomorphic feedback loops and change.
As an alternative to modeling taxa, approaches that incorporate organisms’ functional traits in explanatory and predictive models of ecological processes have gained traction among ecologists (Funk et al. 2016). Functional traits are measurable characteristics of an individual organism that represent the relationship between environmental factors and a species (i.e., response trait) and/or between a species and ecosystem processes (i.e., effect trait). Theoretically, response and effect traits are linked (Lavorel and Garnier 2002), and empirical evidence supports this link (Suding and Goldstein 2008). As such, functional traits provide a platform for connecting environmental conditions that define resources and stressors to community dynamics, and in turn to ecosystem processes, effectively scaling up from an individual to an ecosystem. This platform has formed the foundation for mechanistic models that, for example, prescribe environmental flows for freshwater mussels (Gates et al. 2015), describe the distribution of fish assemblages on the basis of hydrologic variability (Poff and Allan 1995), and achieve functional targets for restoration (Laughlin 2014).
In riparian ecosystems, trait-based analyses are particularly powerful because steep environmental gradients and a heterogeneous distribution of resources occur as the landscape transitions from aquatic to terrestrial (Naiman et al. 2005). Water availability and the intensity and frequency of disturbance change rapidly over short distances in riparian ecosystems. As a consequence, plant life-history adaptations to fluvial disturbance and drought show sharp differences as a function of distance from and elevation above active river channels (Bornette et al. 2008), and complexes of coevolved traits exist (Díaz et al. 2016). Guilds, assemblages of plant species that are functionally similar, are therefore readily identifiable in riparian ecosystems (Merritt et al. 2010, Stromberg and Merritt 2015). Models that use guilds, rather than single species, are generalizable across sites, regions, and continents where species may differ, as well as at a site through time as changes in environmental conditions (e.g., climate-driven floods and droughts) may occur (Lytle et al. 2017).
The functional trait framework, developed and applied nearly exclusively to ecological studies, can also be applied to ecogeomorphic (also referred to as biogeomorphic) studies. Functional traits, indicative of both response and effect, may also elucidate coupled ecological and physical processes that shape the structure and function of riparian ecosystems. In river systems, plants respond to water availability and the magnitude and frequency of fluvial disturbances (Hupp and Osterkamp 1996). In turn, riparian plants alter the flow of water, the transport of sediment, and the stability of landforms, influencing geomorphic form (Gurnell 2014). O’Hare and colleagues (2016) compiled common ecological-response traits for nearly 500 species that also have a geomorphic effect to qualitatively identify typologies of species that similarly affect geomorphic processes and landform stability.
Ecogeomorphic conceptual frameworks have helped to guide the study and understanding of the coupled adjustment of landforms and vegetation communities (Corenblit et al. 2011). Bornette and colleagues (2008) proposed a model linking flood disturbances and bed-material sizes to riparian plant recruitment, establishment, and growth. The fluvial biogeomorphic succession model describes temporal variation in feedback loops in four phases (Corenblit et al. 2007). The first phase begins after a channel-resetting flood, such as when a river corridor may largely be devoid of vegetation and geomorphic processes drive channel function (geomorphic phase). Through the colonization (pioneer phase) and growth of plants, plants exert progressively greater control over physical processes (biogeomorphic phase). Eventually, as vegetation grows and landforms stabilize, ecological processes come to dominate (ecological phase), and channels become insensitive to all but the largest physical disturbance. Elaborations of this model have focused on species that strongly influence changes in river-channel and floodplain form (ecosystem engineers; e.g., Corenblit et al. 2015) and on identifying variability in plant-hydrogeomorphic feedback systems within distinct zones of river corridors (Gurnell et al. 2016). Corenblit and colleagues (2015) proposed that the traits indicative of the strategies for colonization and eventual landform stabilization by ecosystem engineers must be linked.
We build on previous work by quantitatively identifying the geomorphic impact of plants with similar life-history strategies and including all terrestrial plant growth forms found within the riparian area, from forbs and graminoids to trees, and for all stages of riparian ecosystem development, from pioneer to late-seral communities. All successful plants within the riparian corridor must be adapted to the availability of water and the strength of disturbance and do so differently over timescales ranging from a single flood occurring over hours to weeks to droughts expressed in decadal trends. These response traits (e.g., plant height and stem tissue density) have, through experimentation, been shown to influence physical processes (figure 1; Nepf 2012, Luhar and Nepf 2013). Although key species in some systems disproportionately influence morphodynamics (Gurnell 2014), a range of plants influence hydrogeomorphic processes to varying extents and must be accounted for in models striving to understand the coadjustment of plant communities, geomorphic landforms, and riverine landscape dynamics.
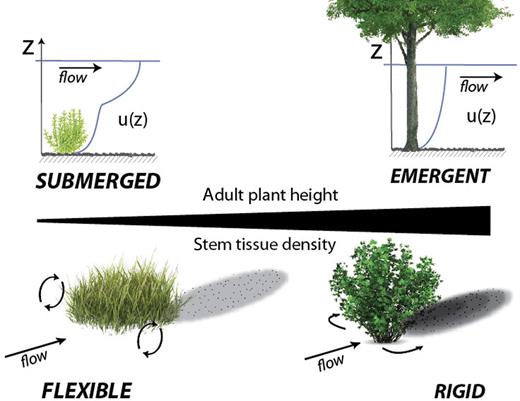
Adult plant height and stem tissue density are important for determining both a plant's response to abiotic stressors and its effect on physical processes. Plant height is generally indicative of a plant's ability to compete for resources and stem tissue density is indicative of a plant's investment into its mechanical structure and has been linked to drought tolerance. Large plant height assures emergent conditions (top right) for which, relative to submerged plants (top left), velocity profiles are simpler and mean velocities are typically lower (Nepf and Vivoni 2000). Stem tissue density is related to flexural rigidity (Niklas 1993). Rigid plants (bottom right) deflect flow in the horizontal plane, reducing mean and turbulent velocities downstream and inducing greater deposition downstream when compared with flexible plants (bottom left), which induce three-dimensional flow adjustments around the plant and result in decreased deposition downstream (Ortiz et al. 2013).
In the following, we explore the applicability of the functional trait framework to riparian ecosystems by first establishing links between response and effect traits. We review literature indicating that plant traits important for understanding a plant's ability to tolerate or resist abiotic stressors and take advantage of resources (i.e., ecological-response traits) are either directly related to or covary with traits important for understanding how a plant influences water flow, sediment transport, and landform stabilization (i.e., morphological-effect traits). Using a data set of traits measured on plants growing along rivers in Utah and northwestern Colorado, we show that ecological-response guilds, or groupings of plants based explicitly on response traits, have significant overlap with morphological-effect guilds, or groupings of plants based explicitly on effect traits. Moreover, ecological-response guilds are composed of plants that are morphologically similar. We then explore the full response–effect link in a riparian ecosystem. We connect plant community characteristics to topographic change around plants following three snowmelt flood events. Finally, we discuss how the links between ecological and physical processes represented by functional traits may be used to evaluate how these coupled systems will shift with changing environmental conditions.
This article develops and tests the hypothesis that the functional trait framework is applicable to understanding the coupled nature of riparian ecosystems in the context of investigating plants and hydrogeomorphic processes along semiarid rivers. In particular, we focus on traits that capture how plants respond to large annual and interannual flow variability. Application of the framework to other hydroclimatic settings may require a re-evaluation of the traits, but the concepts are broadly applicable.
A review of plant traits and their corresponding functions
We review the ecological function of ecological-response traits, which reflect plant adaptations to water availability and fluvial disturbance, and the geomorphic function of morphological-effect traits, which are those that influence river morphodynamics. From these reviews, we identify similarities in and correlations between traits important for ecological and geomorphic processes.
Function of ecological-response traits
Ecological-response traits are those that reflect adaptations to water availability and fluvial disturbance, the principal environmental gradients in riparian ecosystems (Merritt 2013). Ecological functions are the mechanisms by which plants take advantage of resources or avoid or endure stressors related to water availability and fluvial disturbance. Our review of ecological-response traits and functions (table 1) covers traits that (a) we identify as necessary to understand the full range of strategies for persisting in flooded, mechanically disturbed, or drought-stressed environments and (b) can be easily measured and quantified in the field and/or in the laboratory.
Ecological-response traits and functions.
| Trait | Function | Reference |
|---|---|---|
| Leaf area | Photosynthetic surface area, water loss to the atmosphere | Wright et al. 2004 |
| Specific leaf area | Photosynthetic capacity, leaf nitrogen content, adaption to submergence, leaf life-span | Niinemets 2001, Ackerly 2004, Bucci et al. 2004, Wright et al. 2004, Mommer et al. 2006, Ordonez et al. 2009 |
| Carbon isotope ratio | Water-use efficiency | O’Leary 1988 |
| Stem-tissue density | Xylem cavitation resistance, mechanical stability | Niklas 1993, Hacke et al. 2001, Lens et al. 2016 |
| Height | General competitive ability | Ryan and Yoder 1997, Keddy and Shipley 1998, Westoby 1998, Vesk 2006, Schenk and Jackson 2002 |
| Root architecture or root depth | Water and nutrient extraction, mechanical stability | Kozlowski 1984, Lynch 1995, Larcher 2003, Stromberg 2013, Holloway et al. 2017 |
| Seed mass | Reproductive strategy, establishment characteristics | Leishman and Westoby 1994, Thompson et al. 1996, Grime et al. 1997 |
Certain plant traits facilitate tolerance of dry conditions. Smaller, narrower, and thicker leaves and those of lower specific leaf area (SLA; leaf area per leaf dry mass, in square centimeters per gram) generally have a greater ability to tolerate water shortages and avoid desiccation (Wright et al. 2004). Specific leaf area has been related to water-use efficiency in plants, and low SLA values are associated with drought tolerance (Ackerly 2004). Furthermore, SLA is positively related to photosynthetic capacity, leaf longevity, nitrogen content, and leaf architecture (Ordoñez et al. 2009). Thick cell walls and low fractions of intercellular air space, characteristic of small SLA values, enable continued photosynthesis under drying conditions and the avoidance of wilting (Niinemets 2001), thus losing turgor at more negative values of leaf water potential (Bucci et al. 2004). Conversely, a high SLA allows a plant to withstand submergence by increasing underwater gas exchange (Mommer et al. 2006).
Low water availability can make a plant susceptible to xylem cavitation (Sperry et al. 1993), thereby preventing the movement of water from the soil to the leaves through xylem vessels. Stem tissue density (in grams per cubic centimeter) is positively related to drought tolerance in both woody (Hacke et al. 2001) and herbaceous (Lens et al. 2016) plants because high stem densities tend to be more resistant to xylem cavitation. High stem tissue densities also tend to support larger plants, with taller canopies (Niklas 1993). Plant height at maturity is indicative of a plant's general competitive ability (Westoby 1998), given the advantage of height in acquiring photosynthetically active radiation and accessing the most direct sunlight (Keddy and Shipley 1989). Taller plants are also presumed to have more extensive root systems, enabling them to compete for soil resources (e.g., moisture, nutrients, minerals, and trace elements; Schenk and Jackson 2002). Height can be a disadvantage in water-limited conditions, however, because it demands greater transport distances (Ryan and Yoder 1997). Plants with high water-use efficiency, defined as the ratio of carbon gained during carbon-dioxide assimilation to water loss during transpiration, are better adapted to surviving and thriving in drier conditions. The ratio between the 13C and 12C isotopes in leaves is a measure of this efficiency; larger carbon isotope ratios indicate greater drought tolerance (O’Leary 1988).
Access to soil water depends on the root system's architecture, including the maximum rooting depth and the investment in root tissue as a function of soil depth. Plants with deep taproots can often tolerate dry surface soil and atmospheric conditions because they remain connected to deep groundwater sources (Stromberg 2013). Shallow-rooted plants with dense distributions of fine roots in upper soil horizons may also be drought tolerant between precipitation events (because of moisture-storing tissue) but take full advantage of precipitation when it moistens upper soil horizons (e.g., cacti and other stem and/or leaf succulents; Lynch 1995). Many riparian species are capable of adapting their root systems to seasonal variability in water availability or spatial differences as a result of landform composition and structure through a shift in the depth and architecture of their root systems (Holloway et al. 2017). Prolonged inundation may stress plants by depriving the roots of oxygen directly and/or by resulting in biochemical transformations in the soil that render the soils toxic to plants lacking adaptations to surviving under anoxic conditions (Kozlowski 1984). In addition, inundation may hinder plant performance and survival through light attenuation and reduced gas exchange in water (Larcher 2003).
Some traits limit plant vulnerability to high-flow conditions. Various metrics of plant size, including projected frontal area, basal diameter, height, and root frontal area, are strongly and positively correlated with the force required to uproot plants; that is, larger plants are less susceptible to uprooting during high flows (Bywater-Reyes et al. 2015). Thick, furrowed bark imparts protection during flood conditions against abrasion from suspended sediment and debris and impact from floating objects, including ice. Flexible stems, and/or small area exposed to flow with the capacity to streamline, limit loss of aboveground biomass. Stiff, larger stems allow a plant to tolerate mechanical disturbance (Puijalon et al. 2011; see below for a more detailed discussion). Plants with more flexible stems typically have lower stem tissue density and smaller stem diameters, although this relationship is variable (Niklas 1993). Leaf shape may also have a functional relationship with fluvial disturbance. In high fluvial-energy environments, there is selective pressure for plants to possess narrower leaves and for those with high leaf length-to-width ratios (Stromberg and Merritt 2015).
Other traits assist plants in the avoidance or resistance of disturbance, but are difficult to capture quantitatively. For example, when damaged, some plants can resprout or reestablish vegetatively (Bellingham and Sparrow 2000). Some groups of species avoid disturbance by delaying germination or the emergence of stems until the likelihood of flooding is reduced. Other avoidance strategies include seed dormancy and the ability to form seedbanks, to complete their life cycle between floods, or to grow to a height that protects reproductive structures and photosynthetic tissue from harm (Vesk 2006).
Evolutionary trade-offs in seed morphology may impart fitness in one situation and not in another but enable occasional success in heterogeneous river systems with varying flow regimes. The mass of seeds contributes to both avoidance of disturbance and recovery from flood events (Grime et al. 1997). The production of fewer, larger seeds may facilitate the formation of a seed bank so that seeds may lie dormant until conditions are suitable for germination and seedling growth. The production of many, small, well-dispersed, short-lived seeds enhances recolonization of disturbed sites following exposure (Thompson et al. 1996). In addition, there is some evidence that seed size is positively related to establishment success where water availability is limited (Leishman and Westoby 1994).
Geomorphic function of morphological-effect traits
Morphological-effect traits are those that influence the flow of water, transport of sediment, and stabilization of landforms on the basis of their architecture. Geomorphic functions are the mechanisms by which the plant influences geomorphic process or form (table 2). Plants influence force balances—and therefore flow and sediment transport processes—in rivers. At the individual plant scale, plant size generally controls the magnitude of the drag force. The drag force (FD) linearly scales to the projected frontal area (AP) according to the drag force equation, FD= 1/2 〉 CDAPU2, where CD is the drag coefficient (itself a function of plant architecture), 〉 is the density of water, and U is the freestream approach velocity. Other measures of plant size, such as volume, biomass, height, or diameter, may also be correlated with the drag force (Sand-Jensen 2008, Whittaker et al. 2013). Plant size, specifically height, also controls whether the plant remains emergent, and therefore occupies the entire water column, or becomes submerged, and therefore occupies only a portion of the water column. Differences in submergence influence the velocity profile and the magnitude of mean and turbulent velocities, such that velocities are generally lower for emergent plants than for submerged ones, as well as the dominant direction of flow adjustments (e.g., figure 1; Nepf and Vivoni 2000). The vertical component of velocity and vertical velocity fluctuations, negligible around emergent plants, are strong for submerged canopies, resulting in decreased suspended sediment deposition downstream from submerged patches, especially compared with the enhanced sediment deposition downstream from emergent plants (Ortiz et al. 2013).
Morphological-effect traits and geomorphic function.
| Trait | Function | Reference |
|---|---|---|
| Frontal Area | Linearly scales to drag | |
| Height | Submergence condition, velocity profile, mean and turbulent velocity, depositional patterns | Nepf and Vivoni 2000 |
| Volume | Correlated to drag and flexing behavior | Whittaker et al. 2013 |
| Biomass | Correlated to drag and flexing behavior | Sand-Jensen 2008 |
| Flexibility | Pronation and streamlining, canopy height | Vargas-Luna et al. 2014 |
| Buoyancy | Resistance to bending | Luhar and Nepf 2013 |
| Leaf area | Increased drag, enhanced streamlining, alters momentum transfer | Vogel 1989, Jarvela 2002, Wilson et al. 2003, James et al. 2008, Jalonen et al. 2012, Vastila et al. 2013 |
| Branching | Streamlining | Whittaker et al 2013, Manners et al. 2015 |
| Vertical distribution of biomass | Velocity profile, pronation, dispersion, topographic signature | Lightbody and Nepf 2006, Jalonen et al. 2012, Aberle and Jarvela 2013, Manners et al. 2015, Diehl et al. 2017 |
| Root architecture | Stabilize banks, stabilize or add cohesion to sediment | Abernathy and Rutherford 2001, De Baets et al. 2007, Docker and Hubble 2009, Pollen-Bankhead and Simon 2009 |
| Density | Turbulence intensity, sediment transport, bed and vegetation drag, flow patterns | Bennet et al 2002, Chen et al. 2012, Follett and Nepf 2012, Yager and Schmeeckle 2013, Luhar and Nepf 2013 |
| Plant or patch spacing | Spatial variability of flow and sediment transport, resistance | Bennett et al. 2002, Sand-Jensen 2008, Perignon et al. 2013 |
Plant flexibility, often reported as flexural rigidity (the modulus of elasticity multiplied by the second moment of area, or (πr4)/4, where r is the radius of the stem), also influences the submergence condition (Vargas-Luna et al. 2014). The less rigid the stems of a plant, the more rapidly it will pronate, with increasing velocity and/or depth. As a result, a plant may transition from emergent to submerged, even when plant height exceeds flow depth. In some situations, the buoyancy of a plant, a function of the stem tissue density, will also influence its position within the water column (Luhar and Nepf 2013). Plant pronation is often accompanied by streamlining that reduces frontal area and changes the shape of the plant, altering the drag coefficient. These adjustments result in a decrease in drag.
Vegetative drag and the relationship between drag and velocity are also determined by foliage characteristics (Vogel 1989). Leaves greatly increase the projected frontal area (Jarvela 2002) but also have a strong tendency to streamline in the flow (Västilä et al. 2013) and alter the drag coefficient (James et al. 2008). When leaf area is as great as or greater than stem area, such as for woody seedlings, leaf area alone may predict the vegetation resistance (Jalonen et al. 2012). Submerged foliated plants, when compared with bare stems, also decrease velocities within the vegetated zone and shift peak turbulence stresses up in the flow column (Wilson et al. 2003).
A plant's architecture, the three-dimensional organization of a plant's leaves, stems, and branches, also controls hydraulic and sediment transport properties around plants and patches of plants (Lightbody and Nepf 2006). The vertical distribution of a plant's biomass is particularly important. Jalonen and colleagues (2012) found that between model plants, those whose leaves were concentrated at the top had greater resistance than those that were more evenly distributed along the stem. Manners and colleagues (2015), in contrast, showed that Populus seedlings whose foliage forms a distinct upper canopy had less of an impact on flow velocities—and therefore less resistance and topographic change (Diehl et al. 2017)—when compared with Tamarix seedlings, whose leaves are more evenly distributed. However, Populus and Tamarix seedlings also had different branching patterns: Tamarix is a shrubby plant with multiple stems growing from the ground, whereas the typical growth form for Populus is a single stem. These branching patterns influence the reconfiguration potential of a plant (Whittaker et al. 2013, Manners et al. 2015), especially because branches have different flexibilities from main stems.
At the patch- to stand-scale, architectural details of the aboveground biomass become less important than the density, spacing, and distribution of plants (Luhar and Nepf 2013). Greater plant densities generally decrease mean velocity, drag coefficients, and boundary shear stress within a patch (Bennett et al. 2002) while increasing local turbulence intensities (Follett and Nepf 2012). Spacing and the distribution of plants affect the spatial variability of flow, altering flow resistance (Sand-Jensen 2008) as a result of the erosional and depositional patterns. Small, densely spaced plants induce more uniform deposition than larger, sparsely spaced plants, which produce greater depositional variability and topographic heterogeneity (Perignon et al. 2013).
Belowground characteristics are also important for determining a plant's geomorphic function. Root architecture, including the maximum rooting depth, influences the cohesion of the channel or floodplain sediment and increases landform stability (Pollen-Bankhead and Simon 2009). Such a geomorphic function is particularly important for systems that experience floods prior to the growing season, where the aboveground biomass may be absent or not sufficient to alter hydraulics, erosion, and deposition (Gurnell 2014). Smaller diameter roots offer greater tensile strength (per unit mass; Abernathy and Rutherford 2001), and as a result, fine roots reduce erosion rates to a greater degree than large taproots (De Baets et al. 2007). However, deeper roots can add mechanical support over greater depths (Docker and Hubble 2009).
Response–effect trait linkage for riparian plants
Plant height, leaf area, and root architecture or depth appear in both lists of ecological-response (table 1) and morphological-effect traits (table 2). Stem tissue density and flexural rigidity are related, but the relationship differs between growth forms (i.e., woody versus herbaceous; Niklas 1993). Because of plant strategy trade-offs, some ecological traits are highly related to other ecological traits and may be correlated with morphological ones. In addition, physiological constraints on vascular plant geometry, including the efficient transport of water and nutrients and structural soundness, dictate that many plant traits covary with size (West et al. 1999, Price et al. 2007).
Plant height is an important component of a plant's competitive ability and not only governs access to photosynthetically active radiation from the sun but also provides an indication of the extent of the root system, which is related to nutrient and water acquisition (Stromberg 2013). Plant height also influences hydraulics and geomorphic processes. Tall plants generally have greater biomass, typically concentrated higher up on the plant, in order to capture light. Larger-diameter stems and denser stem tissue are necessary to support their height. More rigid, taller, larger-stemmed plants have a lower likelihood of submergence, with associated effects on hydraulic and sediment transport conditions. Plant height is also related to the total frontal area, or biomass, of a plant, and plant size scales to the density of individual plants in resource-limited settings (Enquist et al. 1998). Thus, height strongly influences the drag, vertical distribution of velocity, and shear stress at the plant to patch scale (figure 1).
Leaf area, important for the water and carbon balance of a plant, directly influences the frontal area and the streamlining potential especially, because a plant with larger leaves tends to have larger total leaf area (Westoby and Wright 2003). Leaf size covaries with numerous other traits. Stem tissue density, specifically for woody species, decreases as leaf area increases (Pickup et al. 2005). Stromberg and Merritt (2015) found that leaf length and wood density were inversely related along Arizona streams and that plants with lower wood density had affinities to wetter habitats and were less tolerant of drought stress. In addition, smaller leaves typically grow on narrow, frequently branched twigs, whereas larger leaves are supported by thicker twigs that branch less (Westoby and Wright 2003). Thus, leaf area also indirectly influences the geomorphic functions of a plant, including the stem's flexibility and its branching structure, further contributing to the pronation and streamlining potential of the plant.
Root architecture, including the maximum root depth, determines a plant's ability to draw alluvial water from deep water tables and in turn influences stream-bank and bar stability (Pollen-Bankhead and Simon 2009). As was previously mentioned, the size of the root system scales to the aboveground biomass, thus also indirectly influencing the hydraulic and sediment transport conditions.
The strategies available for plants to directly resist mechanical disturbance from floods have an influence on geomorphic processes. As we discussed above, plants may either tolerate or avoid high flow velocities and other flood-associated stresses (Puijalon et al. 2011). Stem tissue density is related to stem flexibility (Niklas 1993). Plants that avoid high flow velocities often do so with flexible stems and high streamlining potential that results in a reduction of drag on the plant. Tolerant plants have large, rigid stems and a tall stature and experience larger drag forces.
Application of the response–effect functional trait framework to the riparian area of semiarid rivers
The above review suggested a tight coupling between ecological and morphological traits important for (a) determining the response of plant communities to environmental conditions and (b) the effect of these communities on fluvial processes, respectively. We test this apparent link using surveys completed along the Yampa and Green Rivers in Dinosaur National Monument, Colorado and Utah, United States. Eleven ecological and morphological plant trait values were collected from 130 individual plants, comprising 34 species and 8 life-history stages for the 3 dominant woody species (Tamarix ramosissima, Salix exigua, and Populus fremontii), for a total of 39 species and life-history observations. Our sampling scheme targeted individuals (three per species, on average) that best represented the growing conditions in Dinosaur National Monument and are therefore not representative of the full range of trait values possible for a species. Because our sample sizes are small and our study is limited to two rivers, we consider our data set and associated analyses to represent a pilot study illustrating the efficacy of using plant response and effect traits in modeling riparian systems, thereby illustrating an approach with strong potential for broader applicability.
Measured traits were used to create two sets of guilds (ecological and morphological) from a hierarchical cluster analysis based on a Gower dissimilarity index (figures 2 and 3; Stromberg and Merritt 2015). Guilds were determined as groupings that were statistically significant at the p < .15 level. At this significance level, species clustered into groupings that were consistent with our professional understanding of their ecological and morphological functions.
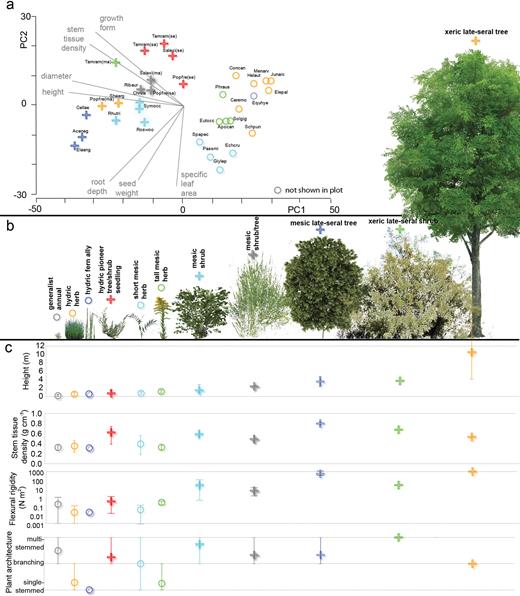
An organization of plants from the field-study area into ecological guilds. (a) The results of cluster analysis for ecological-response traits for 34 species (because eight life-history stages are included, the results include a total of 39 observations) shown on a principal coordinates plot. The guilds are shown as unique symbols: circles for herbaceous guilds, plus signs for woody ones. The species names associated with species symbols are shown in supplemental table S1. (b) Example species for each of the 11 ecological guilds, organized by habitat from left to right: Juncus bufonius, Schoenoplectus pungens, Equisetum hyemale, Tamarix ramosissima (seedling), Glycyrrhiza lepidota, Solidago gigantea, Symphoricarpos occidentalis, Salix exigua (mature), Celtis laevigata, Tamarix ramosissima (mature), and Populus fremontii (mature). (c) The trait values (average and range) for each guild. Height and stem tissue density were used to identify ecological guilds in the clustering analysis; flexural rigidity and plant architecture were used to identify morphological guilds. The online version contains color.
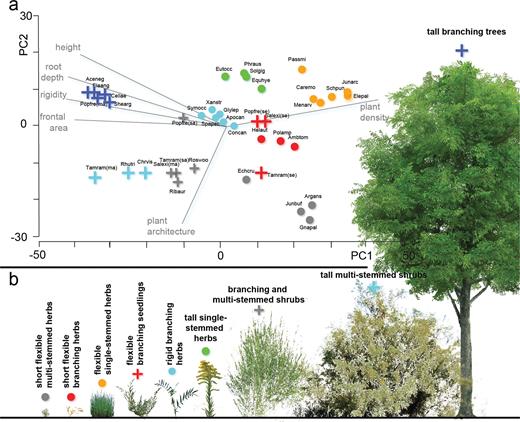
An organization of plants from the field-study area into morphological guilds. (a) The results of cluster analysis for morphological plant traits for 34 species (because eight life-history stages are included, results include a total of 39 observations) shown on a principal coordinates plot. Guilds are shown as unique symbols: circles for herbaceous guilds, plus signs for woody ones (Symphoricarpos occidentalis, a woody plant within the rigid branching herb guild, is an exception). Plant height and the traits that co-vary with height (root depth, flexural rigidity, frontal area, and plant density) describe the variability along the first axis. Species names associated with species symbols are shown in supplemental table S1. (b) Example species for each of the nine morphological guilds, organized by height from left to right: Juncus bufonius, Polygnum amphibium, Schoenoplectus pungens, Tamarix ramosissima (seedling), Glycyrrhiza lepidota, Soligao gigantea, Salix exigua (mature), Tamarix ramosissima (mature), and Populus fremontii (mature). The online version for color.
We designed our trait list to quantify, with a broad spread of values, a suite of morphological and ecological traits that could be measured in the field or laboratory or found in the literature. The traits chosen were the minimum number necessary to identify the range of flow and sediment-transport impacts, as well as the range of life-history strategies for plants in a semiarid riparian environment. Morphological traits included height, maximum plant density, frontal area, flexural rigidity, plant architecture, and root depth. Ecological traits included growth form (woody or herbaceous), height, diameter, stem tissue density, specific leaf area, seed weight, and root depth (see supplemental material).
The cluster analysis identified 11 ecological guilds (figure 2), comprising 5 herbaceous guilds spanning a mesic (moderate-moisture) to hydric (high-moisture) gradient and 6 woody guilds also representing plants that grow in habitats ranging from hydric to xeric (low-moisture) conditions. For the gradient represented by our data, plant height and general habitat type (i.e., hydric, mesic, or xeric) are coupled; shorter guilds are hydric and taller ones xeric. As such, plant height generally increases along the gradient of water availability (figure 2b). Stem tissue density and height also show a general trend, in which shorter plants have smaller densities than taller ones (figure 2c). Greater variability in stem tissue density, a potential measure of drought tolerance, indicates that tall xeric plants may also have other strategies that allow growth in drier areas of the channel. For example, the xeric late-seral shrub guild has deep roots and a small specific leaf area (figure 2).
We also infer a trend in the tolerance or resistance of plants to fluvial disturbance on the basis of trait averages within ecological guilds. Average stem tissue density increases with height, although not consistently. The flexural rigidity of ecological guilds, a more robust measure of stem flexibility, does have a strong relationship with plant size and moisture availability, as does frontal area (not shown; figure 2c). Plant architecture, although variable within most ecological guilds, does tend to favor single-stemmed morphologies for smaller, herbaceous plants and multistemmed morphologies for larger, woody plants (figure 2c). Single-stemmed plants have greater potential for a more streamlined, drag-reducing profile in the flow than do multistemmed ones. As such, plants that tolerate drier conditions are taller and more rigid, resulting in both greater exposure to and ability to withstand fluvial disturbance, whereas hydric plants are short and flexible, with a greater potential to streamline in the flow in a manner that minimizes their exposure to fluvial disturbance.
The cluster analysis identified nine morphological guilds (figure 3). Most of the variability among guilds is described by plant size attributes and the traits that covary with size (root depth, frontal area, plant density, and flexural rigidity; figure 3a). Plant architecture further differentiates guilds depending on their branching structure. In addition, species clustered according to growth form (five herbaceous and four woody), even though we did not include this variable in the cluster analysis. As such, a key finding is that growth form, an ecologically relevant trait, is related to important morphological properties.
Guild analyses based separately on morphological and ecological guilds suggest significant overlap in ecological and morphological properties. A comparison between ecological and morphological guilds, as well as of the species’ trait values within each guild, indicates that ecological guilds are composed of morphologically similar species. Morphological traits are grouped in a significant way within ecological guilds. Flexural rigidity is distinct for 69% of the guild comparisons. In other words, the range of flexural rigidity values for the species within an ecological guild does not overlap those species values within another ecological guild. Similarly, frontal area is distinct for 74% of ecological guild comparisons. Overlap in species membership in ecological and morphological guilds further supports these observations. Sixty-nine percent of the 39 observations overlap with at least one other species in both types of guilds, and the two groupings have a Cohen's kappa value of 0.63 (where a value of 1 represents perfect agreement and a value of 0 no agreement; Cohen 1968). As such, our data set and the accompanying analyses confirm a strong link between response and effect traits.
Topographic response as a function of ecological guilds on a semiarid river
Because ecological guilds are composed of plants that are morphologically similar, the geomorphic impact of plants may show a spatial signature as a result of the distribution of abiotic stressors. Of course, these abiotic stressors are also important for geomorphic processes. Here, we attempt to isolate the impact of ecological guilds on the plot-scale topographic response to floods. We use data drawn from annual plant (species and cover within 1-meter-square plots) and topographic surveys in our study area as part of the National Park Service's monitoring program (Scott et al. 2012). These surveys are collected each year following the recession of the snowmelt flood. The data used to evaluate plot-scale topographic responses are from two reaches on the Yampa River and one on the middle Green River during three moderate snowmelt flood events, in 2013, 2014, and 2015, all of which had return periods between 2 and 5 years. The Yampa River retains its wild hydrology and sediment supply, whereas the middle Green River's hydrology and sediment supply are altered by Flaming Gorge Dam but also receive natural flood pulses from the Yampa River (Grams and Schmidt 2005).
To link the topographic response to biota, we first subtracted the continuous topographic surface (created from survey data) following the flood event from the surface created from survey data collected to prior the flood event (figure 4). These topographic-change maps were then paired with vegetation surveys collected prior to the flood event. Seven of the 11 ecological guilds were present in our surveys. We focus on the six that are present during the annual snowmelt flood and therefore affect the topographic response (hydric herb, hydric pioneer tree or shrub seedling, short mesic herb, tall mesic herb, mesic shrub or tree, and xeric late-seral shrub).
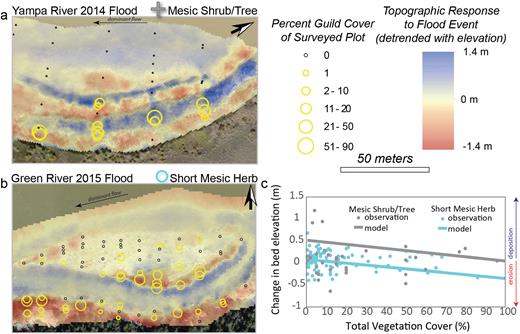
The biotically driven topographic responses to individual snowmelt flood events: (a) Erosional and depositional patterns on the Yampa River in response to the 2014 flood. Greater coverage of the mesic shrub or tree guild corresponds to bands of deposition. (b) Erosional and depositional patterns on the middle Green River in response to the 2015 flood. Greater coverage of the short mesic herb guild corresponds to erosional areas. (c) The relationships between guilds and the topographic changes shown in (a) and (b) are supported by the model. The observations in (c) are for the unique guild and include all three reaches and three flood events. The model fit is derived from the model output for the biotic response only (i.e., not taking into account elevation above base flow or flood event). The online version for color.
The distribution of ecological guilds corresponds to zones of erosion or deposition (figure 4), suggesting a relationship between plants and geomorphic change. For example, deposition occurred along a floodplain bench where there was a relatively dense stand of the mesic shrub or tree guild (figure 3) during the 2014 flood on the Yampa. Conversely, erosion occurred preferentially where the short mesic herb guild was growing in dense clumps on the middle Green during the 2015 flood.
To support these observations and isolate and quantify the impact of plant guilds on geomorphic change, we used the linear model, topo = elev + flood + elev∗flood + prop_guild + cover + prop_guild∗cover, which represents both abiotic (elev, flood, and elev∗flood) and biotic (prop_guild, cover, and prop_guild∗cover) factors important for determining the topographic response of a geomorphic surface to a flood event. The response variable topo is the change in bed elevation (in meters). Elevation above the base-flow channel (elev) was used as a simple proxy for geomorphically and hydraulically important variables (e.g., shear stress and inundation duration). The relationship between the elevation above the base-flow channel and the topographic response was identified separately for each year and each site (flood, a categorical variable). The prop_guild term is the proportion (between 0 and 1) of the vegetation within a plot constituting each ecological guild. A unique value of prop_guild was included in the model for each of the six guilds. The total surveyed vegetation cover of a plot, cover, is a value between 0 and 100. The interaction between the two explanatory variables (prop_guild∗cover) suggests that the total vegetation cover has a differential impact on the topographic response depending on the proportion of each guild. The resulting model may be used to identify the impact of a guild while accounting for the co-occurrence of guilds.
Although the relationship between plant guilds and the topographic response shows considerable scatter, our model captures trends in the data (e.g., figure 4c; see also the supplemental material). In the following discussion, we isolate the biotic factors within the model to explore the geomorphic signature of ecological guilds and refer to this response as biotically driven. Consistent with the above observations, the model indicates that plots composed exclusively of short mesic herbs experience erosion, especially where vegetation cover is high, and plots composed exclusively of mesic shrubs or trees experience deposition (figure 4c). Moreover, the model suggests a relationship between morphologic plant traits (average value for the guild) and the topographic response. For moderately vegetated surfaces (25% cover; the maximum surveyed vegetation cover for most guilds), the more rigid the plant, the greater the deposition (figure 5). With increasing vegetation coverage, some guilds experience increasing deposition, whereas others experience decreasing deposition (increasing erosion; e.g., figure 4c). Although guild-specific relationships between cover and topographic change are significant within the model (except for late-seral xeric shrub; see supplemental material), the magnitude and direction of these trends do not scale to morphologic properties (i.e., herbaceous versus woody or rigidity).
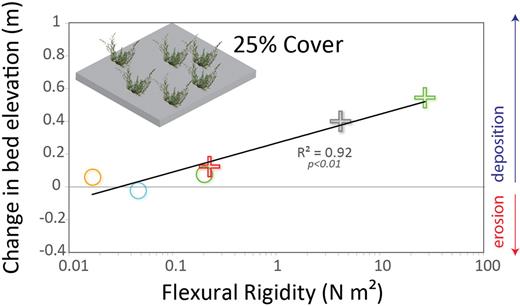
The change in bed elevation in response to a single flood event, determined from the linear model, as a function of the flexural rigidity of each guild. The ecological guild symbols match those in figure 2. A strong positive relationship exists between flexural rigidity and the topographic response for moderate vegetation coverage (25%).
As we discussed above, flexible plants pronate more during floods than rigid plants, increasing the likelihood of submergence while reducing the area of the plant exposed to the flow and as a result, drag and resistance. Our finding that more upright plants induce greater deposition is consistent with the current understanding of plant–hydraulic–sediment interactions, including observations that reduced sedimentation occurs in the vicinity of submerged plants compared with that near emergent plants (Ortiz et al. 2013).
Plants and patches of plants create spatially variable hydraulics and sediment concentrations and, as a result, zones of erosion and deposition (Folkard 2011). Suspended-sediment concentrations may be higher in zones closest to the channel and/or upstream of vegetated areas. Plant-induced changes in flow velocity and turbulence characteristics can cause sediment to drop out of suspension, resulting in deposition (e.g., in the wake area immediately downstream of vegetation) or flow acceleration and erosion (e.g., lateral to patches of plants; Zong and Nepf 2010, Manners et al. 2015). Plant effects on local sediment concentrations—and therefore erosion and deposition—may be particularly prominent where sediment supplies are limited (Manners et al. 2015), as for typical flood events along the confined rivers of the Colorado Plateau (Topping et al. 2000), which includes the Yampa and Green Rivers in Dinosaur National Monument.
Morphologic variables accounted for in our model (i.e., flexural rigidity that is differentiated within the guilds and cover) describe some of the observed topographic variability. Unexplained variability is likely attributable not only to abiotic factors that are not included in the model (e.g., suspended sediment concentrations) but also to the scale over which we measured the topographic response. We measured the topographic response at the plot scale (1 meter square), but the topographic signature of vegetation occurs at multiple scales (see Folkard 2011 for a review of the issue of scale). Erosion and deposition may occur multiple plant lengths away from a plant (Follett and Nepf 2012). The topographic response also depends on the location of the plot relative to other plants and the main channel. Changes in bed elevation within a plot may be more influenced by upstream vegetation, a variable not accounted for in our model. than by vegetation within the plot.
In addition to sediment supply, other abiotic factors dictate the topographic response of a landform to a flood event. We used elevation above base flow to account for the abiotic background signal, and although this variable describes substantial variability (see supplemental material), other factors vary from plot to plot. Variables specific to the flood event, such as inundation duration and peak-flood velocity, may be more appropriate for normalizing the topographic response and accounting for unique abiotic conditions affecting ecological guilds. Complete removal of the abiotic signature, however, is impractical. Variable flow rates and sediment supplies mediate the influence of plants on geomorphic processes (Diehl et al. 2017), creating complex interactions and feedback systems.
Plant–geomorphic interactions over space and time
Ecological-response traits that describe how a plant will respond to abiotic stressors are similar or strongly correlated to morphological-effect traits that have been identified as important for a plant's geomorphic impact. As a result, assemblages of species grouped on the basis of similarities in ecological-response traits (i.e., ecological guilds) are morphologically similar. As such, the link between environmental conditions and the likely presence of ecological guilds informs the distribution of plants with consistent morphologies. In addition, our results suggest that groupings of plants with consistent morphologies produce a unique topographic signature. Application of the functional trait framework to riparian ecosystems will therefore elucidate interactions and feedback loops between ecological and physical processes. The use of traits or guilds also allows for generalization across space and time and from system to system. Current limitations in the broad applicability of the framework to predictions of coupled riparian ecosystem processes are discussed below.
Figure 6 depicts a hypothetical distribution of ecological guilds as a function of a gradient in water availability, from high to low (A to A΄). With distance and elevation above the base-flow channel, hydric herbaceous plants and woody seedlings transition to mesic and then xeric shrubs and trees (figure 6c). Concurrently, the flexural rigidity of riparian plants, and by association height and frontal area, increases from the channel edge toward the floodplain.
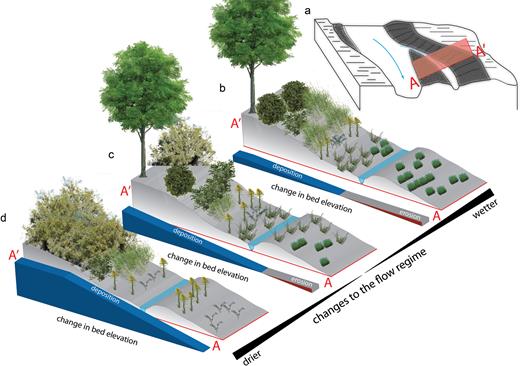
For ecological guilds that respond to water availability and fluvial disturbance gradients, our analyses indicate that the distribution of morphological traits—and therefore the plot-scale biotically controlled topographic response—can be predicted on the basis of these abiotic gradients. For a hypothetical section (a), where a steep gradient in water availability (high to low, A to A΄) exists, ecological guilds trend from hydric to mesic to xeric (c). The flexural rigidity of the ecological guilds increases from A to A΄. From our observations for three flood events, deposition increased with increasing flexural rigidity (see figure 5). With a shift in flow attributes, the distribution of ecological guilds, morphological plant traits, and the topographic response change; (b) changes that may result from a drier flow regime and (d) changes that may result from a wetter flow regime. In b–d, changes in bed elevation are indicative of an increased likelihood of either aggradation (plant-induced sediment deposition) or degradation (plant-induced sediment erosion).
The distribution of plant guilds will shift if river flow regimes change (figure 6b, 6d). The specific combination of changes in flow attributes will influence the distribution of plant guilds, but several types of changes can be anticipated. For example, wetter climate conditions, which could increase the magnitude and duration of floods and/or increase base flows, would result in the expansion of hydric plants and shift mesic plants further onshore, concurrently resulting in the general reduction of the flexural rigidity of plants (figure 6b). Conversely, in a drier climate with smaller floods and/or depleted base flows, xeric and mesic plants would be expected to encroach offshore, increasing the flexural rigidity of plants in this zone (figure 6d).
The topographic signature depends on morphologic traits but also on flood characteristics, including magnitude, duration, and sediment supply, and the total coverage of vegetation. Figure 6 depicts the biotically driven topographic response (i.e., isolating the impact of plants) of moderate (approximately 25%) coverage of plant guilds to moderately sized floods (return periods of 2–5 years) on a sediment supply-limited river, informed by our observations. Plant guilds occupying zones closest to the channel, with high moisture availability, have morphologic properties that minimize sediment deposition potential, whereas plant guilds occupying zones with lower moisture availability have properties that enhance deposition (figure 6c). These biotically driven depositional and erosional patterns shift when changes to the flow regime shift the distribution of guilds (figure 6c, 6d).
Here, we have focused on ecological and physical processes along semiarid rivers. Observations of geomorphic processes were made for moderately sized floods with natural and moderately affected sediment supplies. The ecological-response traits discussed here represent the range of strategies available to resist or tolerate abiotic stressors in a semiarid climatic setting. Although extension of the response–effect framework to other hydroclimatic settings may diminish the importance of some traits (e.g., stem tissue density may not be as important where drought is not a common stressor), the strong link between ecological and morphological traits is likely to remain, according to our evaluation of the interrelated nature of many traits. Therefore, we suggest that the response–effect framework can provide insights into the distribution of geomorphically important plant traits across a diversity of hydroclimatic settings and taxonomies and may be extended to nonstationary environmental conditions.
Efforts to link morphologic trait distributions with landforms and geomorphic processes across a broader array of settings and time spans, with varying ecosystems, flood characteristics, and sediment supplies, should account for several considerations. As fluxes of sediment and water mediate the impact of plants on fluvial processes, the spatial signature of the topographic response of plant guilds will vary. In addition, quantifying effects traits in complex assemblages of vegetation is challenging; our understanding of how multiple morphological traits influence fluvial processes is limited and predominately derived from laboratory studies that control for environmental conditions and other morphologic traits. These studies often focus on a single trait (e.g., flexibility; Jarvela 2002). Although some field studies have isolated relationships between morphologic plant properties and topographic response (Perignon et al. 2013), the manner in which a wide range of morphologic properties, as are represented by our ecological guilds, interacts to alter the surrounding topography remains unclear.
A robust modeling approach that captures the coupled ecological and physical response to a shift in environmental conditions is critical to the conservation of freshwater ecosystems. Here, we demonstrated that the functional trait framework, traditionally an ecological tool powerful for its simplicity and ability to model and generalize across large environmental gradients, has the potential to capture this coupled ecosystem response (Merritt et al. 2010). The framework captures the response of plant community dynamics and their corresponding morphological traits, which are important in influencing physical processes and shifts in environmental factors and landscape evolution. Additional work on the impact of plants, discharge regime, and sediment supplies on geomorphic processes is needed to make the important link between plant morphological traits and geomorphic process and form, especially at the field scale, at which large trait diversity exists.
Acknowledgments
We thank Julian Scott and Chris Harris for their support in the field and laboratory. Most topographic and vegetation survey data were provided by the National Park Service (NPS), Northern Colorado Plateau Inventory and Monitoring Network. We are grateful for the hard work of the staff and volunteers of the NPS. In particular, we would like to thank Dustin Perkins of the NPS and Chris Holmquist-Johnson of the USGS. We thank the three anonymous reviewers for comments that greatly improved the manuscript. Funding was provided by the National Science Foundation (no. SEES-1415418).
Supplemental material
Supplementary data are available at BIOSCI online.
