


Abstract
Taxus species are well-known for paclitaxel, which exhibits antitumor activities and is used for treating various cancers. Although most Taxus species are widespread in many areas, few studies have characterized the variation in metabolism among different Taxus species. Using an integrated approach involving ‘tandem mass tag’ labeling and liquid chromatography–tandem mass spectrometry (HPLC–MS), proteomes of T. media and T. mairei were investigated and 4078 proteins were quantified. Screening and classification of differentially expressed proteins revealed many metabolism-associated proteins. In detail, four enzymes involved in the flavonoid biosynthesis pathway were predominantly expressed in T. mairei. Four enzymes associated with supplying precursors for paclitaxel biosynthesis and three cytochrome P450 taxoid oxygenases were preferentially expressed in T. media compared with T. mairei. Furthermore, variations in taxoid contents between T. media and T. mairei were determined using HPLC–MS analysis. Variations in flavonoid contents between T. media and T. mairei were determined by HPLC analysis. A number of differentially expressed proteins may provide an explanation for the variation in metabolisms of different Taxus species.
Introduction
The natural product Taxol (generic name paclitaxel), the most successful anti-cancer drug so far, was first extracted from the bark of the Pacific yew (Taxus brevifolia) trees decades ago (Wani et al. 1971). Since the 1990s, Taxol has been widely used for treatment of various cancers, such as ovarian cancer and metastatic breast cancer (Wani and Horwitz 2014). With the increasing incidence of cancer, the market value of Taxol has risen sharply. However, limited natural resources of Taxus species also limit production of paclitaxel directly from yew trees, and this is now a challenging problem (Li et al. 2012; Shen et al. 2016a).
Full functionalized diterpenoid paclitaxel is one of hundreds of identified taxoids of Taxus species, all of which contain a unique taxane skeleton (Itokawa and Lee 2003). Previous studies revealed an intricate metabolic pathway for paclitaxel biosynthesis. In detail, the diterpenoid taxane core is derived by the 2-C-methyl-d-erythritol phosphate (MEP) pathway, which supplies isopentenyl diphosphate and dimethylallyl diphosphate as C5 isoprenoid precursors (Eisenreich et al. 1996). Formation of the taxane skeleton is catalyzed by taxadiene synthase, which cyclizes the geranylgeranyl skeleton to taxa-4(20),11(12)-diene (Harrison et al. 1966). For functionalized taxoids, a series of hydroxylation steps on the taxane core were suggested by Stojanović (Stojanović 1995). As a part of typical plant secondary metabolism, cytochrome P450-mediated oxygenation plays an essential role in these hydroxylation steps (Jennewein et al. 2001). More than half of these distinct enzymatic steps of the pathway are catalyzed by cytochrome P450 oxygenases, including the taxoid 2α-, 5α-, 7β-, 9α-, 10β-, 13α- and 14β-hydroxylases (Chau and Croteau 2004; Chau et al. 2004; Croteau et al. 2006).
Taxol is now largely produced by semi-synthetic means from its precursors, such as baccatin III, which are more readily available from various Taxus species (Croteau et al. 2006). In addition, 10-deacetylbaccatin III (10-DAB III) is also used as a precursor to convert to taxotere, a chemically modified analog with more efficient anti-cancer activity than paclitaxel (Guenard et al. 1993). Thus far, increasing numbers of taxoids have been isolated from the needles, bark, stems and roots of different Taxus species, and some have shown significant clinical effects (Shi et al. 1999). In addition to taxoids, other bio-active substances, such as flavones and essential oils, have been identified in T. mairei and T. baccata (Krauze-Baranowska 2004; Stefanovic et al. 2016). As a large category of plant secondary metabolites, flavonoids have broad-spectrum pharmacological activities, such as anti-oxidative, -fertility and -inflammatory effects, and have been isolated from various Taxus species (Feng et al. 2013; Park et al. 2006; Yu et al. 2016).
The mainstay of protein expression quantification is identification of the separated components using mass spectrometry (MS)-based peptide mass fingerprinting and tandem mass spectrometry (MS/MS)-based peptide sequencing techniques (Mann and Wilm 1994; Yates et al. 1993). A novel MS/MS-based analysis strategy using isotopomer labels, referred to as ‘tandem mass tags’ (TMTs), for the accurate quantification of proteins has been recently developed (Thompson et al. 2003). The newly developed tags and methods can be used to determine the relative abundances of peptides from different sample groups with high ease and accuracy (Zhang and Elias 2017). So far, very few proteomic data have been published for Taxus species. Ten years ago, a proteomic approach was used to study the responses of T. cuspidata cells to different microenvironments (Cheng and Yuan 2006). A proteomic analysis of T. mairei provided a deeper understanding of diversity in the acid-rain tolerance of forest tree species (Hu et al. 2014). Recently, comparative proteomic analyses of T. chinensis leaves revealed that a short-term high dose of UV-A radiation could stimulate the plant stress defense system and paclitaxel production (Zheng et al. 2016).
Paclitaxel exists in all Taxus species, and accumulation of taxoids can vary greatly between species. Taxus media, a hybrid Taxus species, is one of the major sources for industrial production of Taxol, due to its high paclitaxel content (Kai et al. 2005; Shen et al. 2016a). Taxus mairei, another important member of the Taxaceae family, is widely distributed in southeast China (Yang et al. 2016). For several Taxus species, including T. brevifolia, T. baccata, T. media and T. cuspidata, barks always gave the highest average yield of taxol (Vidensek et al. 1990). However, forestry workers always cut the twigs, not the bark, for taxane isolation in production practice. Trees could continue to grow and be used in the next year. Thus, the twigs rather than other parts were used in our study. To get a comprehensive understanding of the differences in expression of the proteins involved in metabolism between Taxus species, comparative proteomic analyses of T. media and T. mairei were performed.
Results
Quantitative proteome analysis and quality validation of MS data
An integrated approach involving TMT labeling and liquid chromatography–tandem mass spectrometry (LC–MS/MS) was used to quantify the dynamic changes in the whole proteomes of different Taxus species. General work flow is indicated in Fig. 1a. Pairwise Pearson’s correlation coefficients of all six samples (three replicates × two species) showed high repeatability of our experiment (Fig. 1b). After quality validation, a number of peptides were obtained using the MS data. The distribution of mass errors was near zero, with most mass errors <0.02 Da, indicating that mass accuracy of the MS data fitted the requirements (Fig. 1c). Most peptides were 7–19 amino acid residues long, which agreed with the known tryptic peptide properties, suggesting that sample preparation reached the required standards (Fig. 1d).
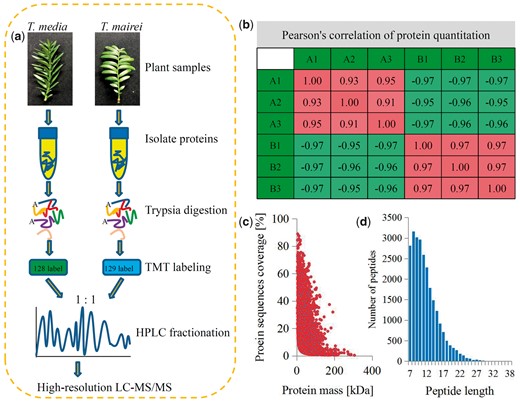
Experimental strategy for quantitative proteome analysis and QC validation of MS data. (a) Proteins were extracted from three biological replicates for each Taxus sample. Proteins were trypsin-digested and analyzed by HPLC–MS/MS. (b) Pearson’s correlation of protein quantitation. (c) Mass delta of all identified peptides. (d) Length distribution of all identified peptides.
Using basic HPLC fractionation and LC–MS/MS data, 4834 protein groups were identified, from which 4078 proteins were quantified. The bioinformatic analyses of protein annotation, functional classification, functional enrichment, cluster analyses and subcellular localization are listed in Table S1.
Identification of differentially expressed proteins between T. media and T. mairei
In our study, 1226 proteins were identified as differentially expressed proteins (DEPs) (minimum fold change of ± 1.5 or greater and P <0.05), including 661 up-regulated and 565 down-regulated proteins, between T. media and T. mairei (Table S2). Among the DEPs, a methyltransferase-like, a DEAD-box ATP-dependent RNA helicase and an RNA-binding protein-like protein were predominantly expressed in T. mairei (>20-fold), and a 50S ribosomal protein, L15, a malate dehydrogenase family protein, a 17.6-kDa class I heat shock protein 3, dnaK-type molecular chaperone, an 1-aminocyclopropane-1-carboxylic acid oxidase, a peroxidase 12 and a beta-d-xylosidase were predominantly expressed in T. media (>20-fold).
Furthermore, the Gene Ontology (GO) terms representing all identified proteins and DEPs were classified into three categories: Cellular Component, Molecular Function and Biological Process. In detail, 42.2% of the identified proteins (2039) and 47.6% of the DEPs (584) were annotated as ‘catalytic activity’; 39.8% of the identified proteins (1923) and 43.6% of the DEPs (535) as ‘metabolic processes’; 37.8% of the identified proteins (1829) and 31.1% of the DEPs (381) as ‘binding proteins’; and 24.5% of the identified proteins (1182) and 26.0% of the DEPs (318) as ‘proteins related to single-organism process’ (Fig. 2a). The DEPs, including highly expressed proteins in T. mairei and T. media, were also classified according to their subcellular locations. For the highly expressed proteins in T. mairei, a total of 15 subcellular components were identified, including the peroxisome (35%), cytosol (32%), vacuolar membrane (17%), mitochondria (5%) and plasma membrane (4%) (Fig. 2b). The same subcellular components were also identified for the highly expressed proteins in T. media, including the chloroplast (36%), cytosol (34%), nucleus (14%), extracellular matrix (8.13%) and mitochondria (4%) (Fig. 2c).
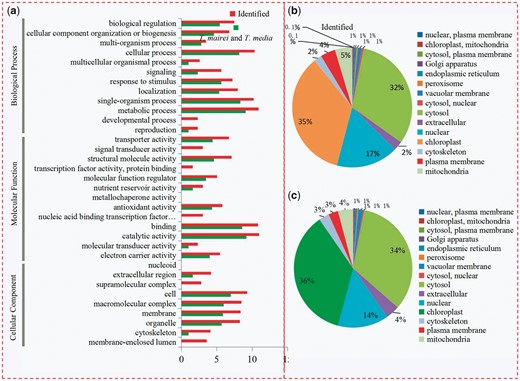
Classification of all identified proteins and DEPs. (a) GO analysis of all identified proteins and DEPs. All proteins were classified by GO terms based on their cellular component, molecular function and biological process. Subcellular locations of identified proteins (b) and DEPs (c).
Enrichment analysis of DEPs between T. media and T. mairei
A total of 346 DEPs (28.2%) could be assigned to at least one GO term. For the predominantly expressed proteins in T. mairei, the significantly enriched ‘Biological Process’ GO terms were mainly associated with ‘response to stress’ (24 DEPs), ‘defense response’ (nine DEPs) and ‘cell wall organization’ (nine DEPs). The top three significantly enriched ‘Molecular Function’ GO terms were ‘hydrolase activity, hydrolyzing O-glycosyl compounds’ (28 DEPs), ‘hydrolase activity, acting on glycosyl bonds’ (28 DEPs) and ‘heme binding’ (23 DEPs). Within the ‘Cellular Component’ GO terms, ‘Golgi apparatus’ (four DEPs), ‘external encapsulating structure’ (four DEPs) and ‘cell wall’ (four DEPs) were mostly abundant (Fig. 3a).
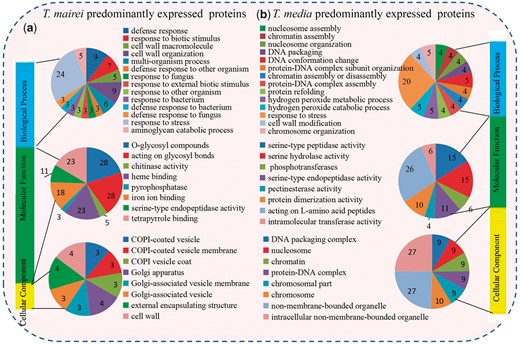
GO enrichment analysis of DEPs. (a) Distribution of T. mairei predominantly expressed proteins with GO annotation. Different color blocks represent different terms, including cellular component, molecular function and biological process. Number of DEPs in each second-level term is shown in a pie chart. (b) Distribution of T. media predominantly expressed proteins with GO annotation. Different color blocks represent different terms, including cellular component, molecular function and biological process. Number of DEPs in each second-level term is shown in a pie chart.
For T. media predominantly expressed proteins, the significantly enriched ‘Biological Process’ GO terms were related to ‘response to stress’ (20 DEPs), ‘DNA conformation change’ (five DEPs) and ‘hydrogen peroxide metabolic process’ (five DEPs). Within the ‘Molecular Function’ category, the most highly represented terms were ‘peptidase activity’ (26 DEPs), ‘serine hydrolase activity’ (15 DEPs) and ‘serine-type peptidase activity’ (15 DEPs). The enriched terms within the ‘Molecular Function’ category were ‘intracellular non-membrane bounded organelle’ (27 DEPs), ‘non-membrane bounded organelle’ (27 DEPs) and ‘chromosome’ (10 DEPs) (Fig. 3b).
In addition, 199 DEPs were classified into various KEGG pathways, of which 23 metabolic pathways were significantly enriched (P < 0.05) (Fig. S1a). Interestingly, a large number of the DEPs were enriched in five fatty acid metabolism-related pathways, including ‘Fatty acid degradation’ (P = 0.0026), ‘α-Linolenic acid metabolism’ (P = 0.0129), ‘Fatty acid biosynthesis’ (P = 0.0237), ‘Fatty acid metabolism’ (P = 0.0286) and ‘Biosynthesis of unsaturated fatty acids’ (P = 0.0362). In total, 19 DEPs, including 13 T. mairei and six T. media predominantly expressed proteins, were associated with the fatty acid metabolism pathway. The fatty acid degradation pathway consisted of 12 T. mairei and seven T. media predominantly expressed proteins. For the α-linolenic acid metabolism pathway, there were 14 DEPs, including nine T. mairei and five T. media predominantly expressed proteins. For the biosynthesis of unsaturated fatty acids pathway, there were six T. mairei and two T. media predominantly expressed proteins. Lastly, eight T. mairei and six T. media predominantly expressed proteins were associated with fatty acid biosynthesis (Fig. S1b–f).
Protein–protein interaction networks for DEPs between T. media and T. mairei
Protein–protein interaction (PPI) network analysis can be used to generate hypotheses about the relationship between DEPs and predict the biological function of unknown proteins. The PPI network for the DEPs between T. media and T. mairei was examined to understand the dynamic changes in metabolic pathways. In total, 595 DEPs were identified as network nodes (Table S3). Furthermore, three enriched interaction clusters were identified in the PPI network. In total, 16 ‘ribosome’-related, nine ‘starch and sucrose metabolism’-related and 11 ‘longevity regulating pathway’-related proteins were enriched (Fig. 4).
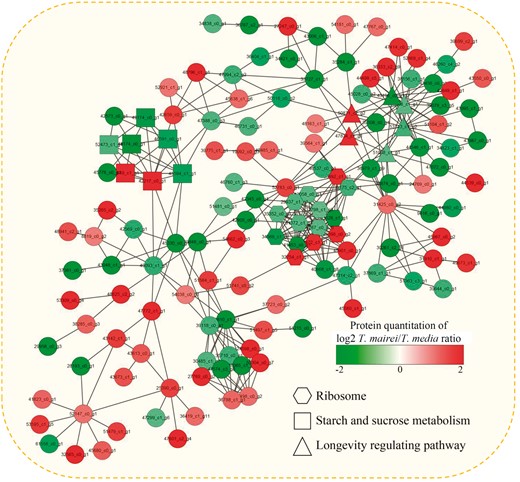
Interaction network of the DEPs analyzed by Cytoscape software (version 3.0.1). Color bar indicates protein quantitation of the log2 T. mairei/T. media ratio.
DEPs related to the flavonoid biosynthesis pathway
KEGG results showed that ‘Phenylpropanoid biosynthesis’ was the most significantly enriched pathway within the DEPs between T. media and T. mairei (Fig. S1a). The flavonoid biosynthesis pathway has been well documented in various plant species, which provided an opportunity to identify flavonoid biosynthesis-related proteins in Taxus. In total, eight flavonoid biosynthesis-related proteins were identified. Among these, four were predominantly expressed in T. mairei: a phenylalanine ammonia-lyase (PAL), a chalcone-flavonone isomerase (CHI), a flavanone-3-hydroxylase (F3H) and a flavonoid 3′-monooxygenase (F3'M) (Fig. 5).
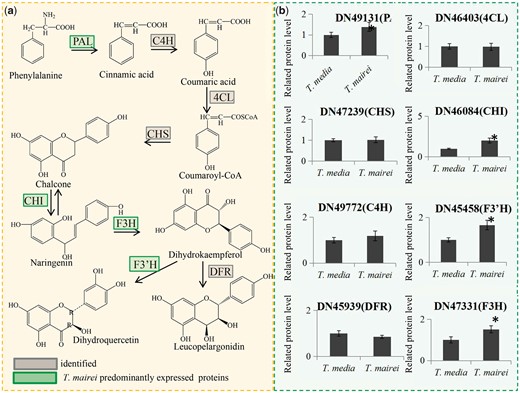
DEPs related to the flavonoid biosynthesis pathway. (a) Schematic representation of the proteins involved in the flavonoid biosynthesis pathway. Green color indicates T. mairei predominantly expressed proteins. PAL, phenylalanine ammonia-lyase; 4CL, 4-coumarate-CoA ligase; CHS, chalcone synthase; CHI, chalcone-flavonone isomerase; C4H, cinnamate-4-hydroxylase; F3H, flavanone-3-hydroxylase; DFR, dihydro-flavonol reductase; F3′H, flavonoid 3'-monooxygenase. (b) Relative expression levels of proteins related to flavonoid biosynthesis. *Significant differences in expression level.
DEPs related to precursor supply in the paclitaxel biosynthesis pathway
Our proteomic data identified most of the enzymes involved in the key steps of the MEP and mevalonate (MVA) pathways, which are involved in supplying precursors for paclitaxel biosynthesis (Croteau et al. 2006). In the MVA pathway, an acetyl-CoA C-acetyltransferase, an MVA kinase and a phospho-MVA kinase were identified. However, there were no significant differences in expression levels of these three proteins. In the MEP pathway, two 1-deoxy-d-xylulose 5-phosphate synthases (DXSs) were identified, and one was substantially more abundant in T. media than in T. mairei. In addition to DXS, one unique enzyme in each step of the MEP pathway was identified. Interestingly, three important enzymes were preferentially expressed in T. media compared with T. mairei: a 1-deoxy-d-xylulose 5-phosphate reductoisomerase (DXR), a 4-(cytidine 5′-diphospho)-2-C-methyl-d-erythritol kinase (CMK) and a geranylgeranyl pyrophosphate synthase (GGPPS) (Fig. 6).
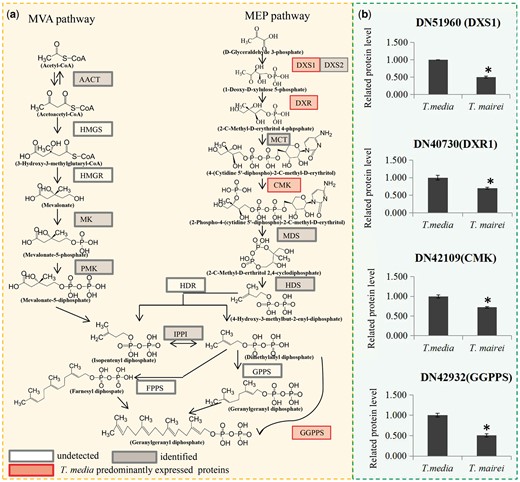
DEPs related to precursor supply for Taxol biosynthesis. Overview of the MVA and MEP pathways in Taxus species. Red boxes indicate T. media predominantly expressed proteins. White boxes indicate undetected proteins. Grey boxes indicate identified proteins. AACT, acetyl-CoA C-acetyltransferase; HMGS, 3-hydroxy-3-methylglutaryl-CoA synthase; HMGR, 3-hydroxy-3-methylglutaryl-CoA reductase, MK, MVA kinase, PMK, phospho-MVA kinase; MPDC, diphospho-MVA decarboxylase; DXS, 1-deoxy-d-xylulose 5-phosphate synthase; DXR, 1-deoxy-d-xylulose 5-phosphate reductoisomerase; MCT, 2-C-methyl-d-erythritol 4-phosphate cytidylyltransferase; CMK, 4-(cytidine 5-diphospho)-2-C-methyl-d-erythritol kinase; MDS, 2-C-methyl-d-erythritol 2,4-cyclodiphosphate synthase; HDS, 4-hydroxy-3-methylbut-2-enyl-diphosphate synthase; HDR, 4-hydroxy-3-methylbut-2-enyl diphosphate reductase; IPPI, isopentenyl diphosphate-isomerase; GPPS, geranyl diphosphate synthase; FPPS, farnesyl diphosphate synthase; GGPPS, geranylgeranyl diphosphate synthase. (b) Relative expression levels of proteins related to precursor supply for Taxol biosynthesis. *Significant differences in expression level.
Differential expression of cytochrome P450 taxoid oxygenase
Together with six well-reported P450 monooxygenases, the peptide sequences of 51 candidate proteins closely related to cytochrome P450 were screened and used to construct a phylogenetic tree. All of these P450 proteins were classed into six major groups: Clans 71, 72, 74, 85, 86 and 97. The largest group was Clan 71, which contained 15 P450 members, Clan 72 had 12 members, and Clan 97 was the smallest, with only three members (Fig. 7a). Interestingly, all six well-reported P450 monooxygenases—CYP725A1 (GenBank accession number AF318211), CYP725A2 (AY056019), CYP725A3 (AY188177), T2OH (AY518383), T5OH (AY364469) and T7OH (AY307951)—were grouped into Clan 85. A close homolog (DN35279) of CYP725A1 was identified in our study (Fig. 7b). Sequence alignment showed high sequence similarity between DN35279 and AF318211, which was isolated from T. cuspidata (Schoendorf et al. 2001). Another five proteins were also grouped into Clan 85: DN50697, DN53235, DN44305, DN48820 and DN50442. Among the Clan 85 proteins, four were quantified in our study. Three P450 proteins were preferentially expressed in T. media compared with T. mairei (Fig. 7c).
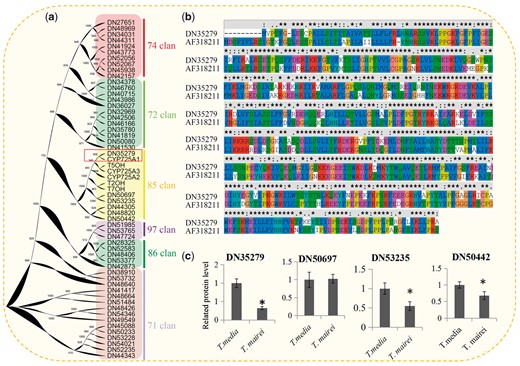
Identification and analysis of the cytochrome P450 taxoid oxygenases. (a) Phylogenetic tree of 51 P450 candidates with full-length sequences. Background colors indicated different P450 clans. (b) Pairwise multiple sequence alignment of DN35279 and CYP725A1 (GenBank accession number AF318211). (c) Relative expression levels of four cytochrome P450 taxoid oxygenases. *Significant differences in expression level.
Variation in taxoid contents between T. media and T. mairei
Dried twigs from T. mairei contained 0.09 mg/g paclitaxel and those from T. media contained 0.46 mg/g. The average content of paclitaxel in T. media was 5.1-fold that in T. mairei (Fig. 8a). In addition to paclitaxel, T. media contained significantly more 10-deacetylpaclitaxel (10-DAP) than T. mairei, with an average content 2.1-fold greater than that in T. mairei (Fig. 8b); however the difference between these two species was not significant (Fig. 8c).
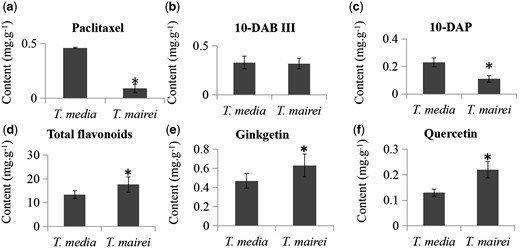
Variation in metabolite contents between T. media and T. mairei. (a) Contents of paclitaxel (a) and two intermediates, 10-DAB III (b) and 10-DAP (c), were quantified by HPLC–MS/MS. The total (d) and individual contents of two flavonoids, ginkgetin (e) and quercetin (f), were quantified by HPLC. *Significant differences in contents.
Variation in flavonoid contents between T. media and T. mairei
The total and individual contents of two flavonoids, quercetin and ginkgetin, were also determined. Contents of total flavonoids were significantly higher in T. mairei (17.64 mg/g) than T. media (13.43 mg/g) (Fig. 8d); similarly, there were higher contents of the individual flavonoids quercetin and ginkgetin in T. mairei (Fig. 8e, f).
Discussion
Genetic factors contribute to the overall phytochemical profile of higher plants. Large variation in taxane content between different Taxus species and cultivars has been reported (Bala et al. 1999, Das et al. 1998, van Rozendaal et al. 2000). However, the mechanisms responsible for interspecific differences in accumulation of taxoids and other metabolites among various Taxus species remain largely unknown. LC–MS/MS is a powerful technique that has been used in quantitative proteomic research in recent years (Alexandersson et al. 2013).
Functional annotation analysis identified many metabolism-associated proteins. MS analysis readily captures relatively abundant proteins, such as chloroplast proteins in plants (Shen et al. 2016a). When discarding chloroplast proteins, data indicated a large proportion of cytosol-located DEPs, which might be potential enzymes in catabolic processes. Thus, identification of DEPs provides an opportunity to perform a more comprehensive analysis of the distinct metabolisms of T. media and T. mairei.
Plants have developed highly sophisticated and efficient strategies to cope with and adapt to different types of abiotic and biotic stresses (Perez-Clemente et al. 2013). GO analysis revealed that many T. mairei predominantly expressed proteins could be assigned to terms associated with environmental responses, such as ‘defense response’, ‘response to biotic stimulus’, ‘response to fungus’ and ‘response to stress’ (Fig. 3a). This suggested that T. mairei may have greater adaptability in changeable environments than T. media. Plants are considered to synthesize secondary metabolites to adapt to environmental stresses (Pusztahelyi et al. 2015).
Flavonoids act as antioxidants in vivo and are responsive to almost all abiotic and biotic stresses (Zhang et al. 2011, Agati et al. 2012). Severe environmental stresses can activate the biosynthesis and metabolism of flavonols (Hatier and Gould 2008, Xu et al. 2009, Xu et al. 2012). Flavonoids are important secondary metabolites that are regulated by the phenylpropanoid pathway in plants (Buer et al. 2008). Conversion of the amino acid phenylalanine to trans-cinnamic acid, catalyzed by PAL (E.C. 4.3.1.5), is the entry step for the channeling of carbon from primary metabolism into phenylpropanoid secondary metabolism in plants (Hyun et al. 2011). Our data showed that PAL was preferentially expressed in T. mairei compared with T. media, indicating a more abundant precursor supply for flavonoid biosynthesis in T. mairei. Additionally, CHI catalyzes the isomerization of naringenin chalcone to naringenin, which is the earliest flavonoid-core-containing intermediate. Naringenin can be hydroxylated by F3H to form dihydrokaempferol, and this can be further hydroxylated by flavonoid3'-hydroxylase (F3'H) to form dihydroquercetin (Feng et al. 2013; Jiang et al. 2015; Lepiniec et al. 2006). Interestingly, CHI, F3H and F3′H were all predominantly expressed in T. mairei, suggesting higher accumulation of flavonoids in T. mairei than T. media. In particular, high accumulations of flavonoids in T. mairei, confirmed by our HPLC analysis, have been suggested to function as antioxidants to regulate plant growth and adapt to complicated environments (Falcone Ferreyra et al. 2012).
Biosynthesis of taxoids involves numerous steps from the universal diterpenoid progenitor geranylgeranyl diphosphate derived by the plastidial MEP pathway for isoprenoid precursor supply (Croteau et al. 2006). The first step of the MEP pathway is production of 1-deoxy-d-xylulose 5-phosphate by d-glyceraldehyde 3-phosphate and pyruvate, which is catalyzed by DXS (Estevez et al. 2000). Then, the intramolecular rearrangement and reduction of DXP to MEP is catalyzed by DXR (Vranova et al. 2013). DXR and DXS have both been implicated as limiting enzymes for the plastidic terpenoid biosynthesis pathway (Estevez et al. 2001). Ketchum et al. (1999) reported that the substantial up-regulation of precursor supply might be required for the induction of taxoid biosynthesis in the source Taxus cells. Another important enzyme, GGPPS, was isolated and partially characterized from cell cultures of both T. canadensis and T. baccata (Hefner et al. 1998, Laskaris et al. 2000). Although GGPPS is probably not the rate-limiting enzyme in either the constitutive or the induced biosynthesis of taxoids, it may play a regulatory role in taxoid production (Hefner et al. 1998, Laskaris et al. 1999). In our study, DXS1, DXR and GGPPS were predominantly expressed in T. media compared with T. mairei, suggesting a more abundant precursor supply for taxoid biosynthesis in T. media. This presumption was confirmed by our HPLC–MS/MS data, which showed that the contents of 10-DAP and paclitaxel were higher in T. media than in T. mairei.
Hydroxylations of the taxane core were mainly performed by different cytochrome P450 oxygenases. Several studies led to the cloning of a number of corresponding cDNAs from T. brevifolia and T. cuspidata, such as the taxoid 2α-, 5α-, 7β-, 10β-, 13α- and 14β-hydroxylases (Jennewein et al. 2001, Jennewein et al. 2004, Kaspera and Croteau 2006). Interestingly, all of the well-reported P450 genes involved in hydroxylation of the paclitaxel pathway were classed into Clan 85, indicating a high similarity among these P450 oxygenases. In our study, a close homolog (DN35279) of CYP725A1 was identified, suggesting that DN35279 may function as a taxane 10-β-hydroxylase (Schoendorf et al. 2001). Most of the Clan 85 proteins involved in paclitaxel biosynthesis were more highly expressed in T. media, except for DN50697. A number of predominantly expressed candidate enzymes in T. media may provide an explanation for the variation in taxoid contents of different Taxus species.
Proteomes of T. media and T. mairei were investigated using an integrated approach involving TMT labeling and LC–MS/MS, and 4834 protein groups were identified, among which 4078 were quantified. Screening and classification of the DEPs showed a large number of metabolism-associated proteins. Four enzymes involved in the flavonoid biosynthesis pathway were predominantly expressed in T. mairei. Four enzymes associated with the supply of precursors for paclitaxel biosynthesis and three cytochrome P450 taxoid oxygenases were preferentially expressed in T. media compared with T. mairei. Furthermore, variations in taxoid contents between T. media and T. mairei were determined using HPLC–MS/MS analysis, and variations in flavonoid contents between the two species were determined using HPLC analysis. A number of predominantly expressed enzymes may explain the variations in metabolisms among different Taxus species.
Materials and Methods
Plant materials and protein isolation
Cultivated 3-year-old T. media and T. mairei plants were grown in a greenhouse at Hangzhou Normal University, Hangzhou, China, with a light/dark cycle of 12/12 h and 60%–70% relative humidity at temperature of 25 ±1°C. All plants were watered once a week. Twig samples were collected and ground in liquid nitrogen. Then, the cell powder was transferred to a centrifuge tube and sonicated on ice three times using a high-intensity ultrasonic processor (Scientz, Ninbo, China) in lysis buffer: 8 M urea, 2 mM EDTA, 10 mM dithiothreitol (DTT) and 1% protease inhibitor cocktail. The precipitate was removed by centrifugation at 20,000×g at 4°C for 15 min. Finally, the soluble protein was precipitated with 15% pre-cooled TCA buffer for 2 h at −20°C. The supernatant was discarded and the remaining precipitate was washed with cold acetone. The protein was redissolved in buffer (8 M urea, 100 mM Tetraethylammonium Bromide, pH 8.0) and quantified with a 2-D Quant kit (GE Healthcare, Beijing, China) according to the manufacturer’s instructions.
Trypsin digestion and TMT labeling
The protein sample was firstly reduced with 10 mM DTT for 1 h at 37°C and alkylated with 20 mM iodoacetamide for 45 min at 25°C in darkness. For trypsin digestion, the protein solution was diluted by adding 100 mM TEAB to urea at a concentration <2 M. Finally, trypsin was added at a 1:50 trypsin:protein mass ratio for the first digestion overnight and a 1:100 trypsin:protein mass ratio for a second digestion for 4 h. Approximately 200 μg of protein for each sample was digested with trypsin for further experiments.
After trypsin digestion, protein samples were desalted using a Strata X C18 SPE column (Phenomenex, Guangzhou, China) and then vacuum-dried. Peptide was reconstituted in 0.5 M TEAB and processed according to the manufacturer’s protocol for the 6-plex TMT kit (Thermo-Scientific, Shanghai, China). Briefly, 1 unit of TMT reagent, defined as the amount of reagent required to label 100 μg of protein, was thawed and reconstituted in 24 μl of acetonitrile (ACN). The peptide mixtures were then incubated for 2 h at room temperature and pooled, desalted and dried by vacuum centrifugation.
HPLC fractionation
The sample was then fractionated by high-pH reverse-phase HPLC using an Agilent 300Extend C18 column (Agilent, Santa Clara, CA, USA) (5 μm particles, 4.6 mm internal diameter). The wavelength used for detection of peptides was 250 nm. Briefly, the peptides were first separated into 80 fractions over 80 min using a gradient of 2–60% ACN in 10 mM ammonium bicarbonate (pH 10). Then, the peptides were combined into 18 fractions and dried by vacuum centrifugation.
LC–MS/MS analysis
Peptide samples were dissolved in 0.1% formic acid (FA) then loaded onto an Acclaim PepMap 100 reversed-phase pre-column (Thermo-Scientific, Shanghai, China). Then, peptides were separated using an Acclaim PepMap RSLC reversed-phase analytical column (Thermo-Scientific, Shanghai, China). The gradient comprised an increase from 8% to 26% solvent B (0.1% FA in 98% ACN) over 22 min, 26% to 40% in 12 min and climbing to 80% in 3 min then remaining at 80% for the last 3 min, all at a constant flow rate of 400 nl/min on an EASY-nLC 1000 Ultra Performance Liquid Chromatography (UPLC) system (Thermo Scientific, Beijing, China). The resulting peptides were analyzed using a Q Exactive™ Plus Hybrid Quadrupole-Orbitrap mass spectrometer (Thermo-Scientific, Shanghai, China).
The peptides were subjected to a nanospray ionization source followed by MS/MS in the Q Exactive™ Plus coupled online to the UPLC (Thermo-Scientific, Shanghai, China). Intact peptides were detected in the Orbitrap at a resolution of 70,000. Peptides were selected for MS/MS using the normalized collision energy (NCE) setting of 30; ion fragments were detected in the Orbitrap at a resolution of 17,500. A data-dependent procedure that alternated between one MS scan and 20 MS/MS scans was applied for the top 20 precursor ions above a threshold ion count of 1E4 in the MS survey scan with 30.0 s dynamic exclusion. The electrospray voltage applied was 2.0 kV. Automatic gain control was used to prevent overfilling of the Orbitrap; 5E4 ions were accumulated for generation of MS/MS spectra. For MS scans, the m/z scan range was 350–1800. Fixed first mass was set as 100 m/z.
Database search
The MS/MS data were processed and searched against published transcriptomes (SRP013978 and SRP096539) concatenated with a reverse decoy database using MaxQuant with the integrated Andromeda search engine (v.1.5.2.8). Trypsin/P was specified as the cleavage enzyme, allowing up to two missing cleavages, five modifications per peptide and five charges. The mass error was set to 0.02 Da for the precursor ions and fragment ions. Carbamido-methylation on Cys was specified as a fixed modification and oxidation on Met was specified as a variable modification. False discovery rate (FDR) thresholds for protein, peptide and modification site identification were specified at 1%. Minimum peptide length was set at 7. TMT-6-plex was selected as the quantification method. All the other parameters in MaxQuant were set to default values.
The quantitative value of the unique peptide was calculated according to the ratio of the ion signal intensity in the secondary spectrum. Then, the mean value of all unique peptides that related to each protein was used to quantify to protein expression.
Methods of protein annotation
The GO annotation proteome was derived from the UniProt-GOA database (http://www.ebi.ac.uk/GOA/). Firstly, the identified protein ID was converted to the UniProt ID. Then, the identified protein was mapped to the GO database by the protein UniProt ID. Un-annotated proteins were annotated by InterProScan using the protein sequence alignment method. Then all annotated proteins were classified into three categories: Biological Process, Cellular Component and Molecular Function.
The Kyoto Encyclopedia of Genes and Genomes (KEGG) database was used to annotate the protein pathway (http://www.genome.jp/kegg/). Firstly, the KEGG online service tool KAAS was used to annotate the protein’s KEGG description. Then, all annotated proteins were mapped on the KEGG pathway using KEGG online service tools KEGG mapper (Shen et al. 2016b).
We used wolfpsort, an updated version of PSORT/PSORT II for the prediction of eukaryotic sequences, to predict subcellular localization (http://www.genscript.com/wolf-psort.html).
Functional descriptions of identified protein domains were annotated by InterProScan (a sequence analysis application) based on a protein sequence alignment method. InterPro (http://www.ebi.ac.uk/interpro/) is a database that integrates diverse information about protein families, domains and functional sites, and is freely available to the public via Web-based interfaces and services (Shen et al. 2017).
Analysis of functional enrichment
PPI network analysis
All identified proteins were searched against the STRING database version 10.0 (http://string-db.org/) for PPIs. Only interactions between proteins belonging to the searched data set were selected, thereby excluding external candidates. STRING defines a metric ‘confidence score’ to define interaction confidence; we fetched all interactions with a confidence score <0.7 (high confidence). Interaction network form STRING was visualized in Cytoscape. A graph-theoretical clustering algorithm, molecular complex detection (MCODE), was utilized to analyze densely connected regions.
Phylogenetic tree building
The predicted full-length protein sequences of P450 were used for multiple sequence alignments. The alignments were performed using ClustalW with default parameters and were visualized subsequently using GeneDoc software (http://www.nrbsc.org/gfx/genedoc/). An unrooted phylogenetic tree was constructed using MEGA6.1 (http://www.megasoftware.net/) employing the neighbor-joining method (Shen et al. 2015).
Chemicals and reagents
Paclitaxel (≥99%; CAS No. 33069-62-4) and 10-deacetylbaccatin III (10-DAB III; ≥98%; CAS No. 32981-86-5) were obtained from Aladdin Biochemical Technology (Shanghai, China). 10-DAP (98%; CAS No. 78432-77-6) was purchased from J & K Scientific (Beijing, China). HPLC-grade methanol and FA were purchased from Merck (Kenilworth, NJ, USA). Quercetin, amentoflavone and ginkgetin were purchased from Yuanye Bio-Technology (Shanghai, China).
Preparation of crude extracts for taxoid samples
Fresh twigs were cut from T. media and T. mairei. They were dried at 40 °C and powdered. The powder was passed through a 0.42-mm filter. For extraction, 2.0 g of fine powder was mixed with 30 ml of 100% methanol and then the mixture was sonicated for 60 min. After centrifugation at 5,000×g for 5 min, the supernatant was transferred to a new tube. Before HPLC–MS/MS analysis, the samples were filtered through 0.22-μm membrane filters. Then, crude extracts of T. media and T. mairei were diluted at ratios of 1:10 and 1:2, respectively.
HPLC–MS/MS analysis for taxoids
Quantifications of paclitaxel, 10-DAB III and 10-DAP were carried out by HPLC–MS/MS analyses. A Thermo Dionex UltiMate 3000 series HPLC system equipped with a Finnigan TSQ Quantum Discovery triple quadrupole mass spectrometer (Thermo Fisher Scientific, Waltham, MA, USA) was used for taxoid detection. Separation of 10-DAB III, 10-DAP and paclitaxel was achieved on a Phenomenex Kinetex C18 column (100 × 4.6 mm, 2.6 μm particle size; Phenomenex, Torrance, CA, USA). The mobile phase consisted of 35% (v/v) 2 mM ammonium formate–0.1% FA aqueous solution and 65% (v/v) methanol. The column oven was maintained at 30 °C. The flow rate was set at 0.2 ml/min and the injection volume was 5 μl. The positive electrospray ionization mode was employed. The capillary temperature was set at 270 °C and ion spray voltage at 3000 V. Nitrogen was used as both the auxiliary gas and sheath gas. The collision gas was high-purity argon. Multiple reaction monitoring was applied for the determination. The transition m/z 567.2→445.3 was used for 10-DAB III quantification and the transitions m/z 567.2→385.2 and 567.2→427.3 were utilized for confirmation. The transitions m/z 829.4→286.1 and 829.4→122.0 were measured for 10-DAP quantification and confirmation, respectively. The transition m/z 876.4→308.1 was used for paclitaxel quantification and the transitions m/z 876.4→531.2 and 876.4→591.4 were utilized for confirmation. Xcalibur 2.2 software (Thermo Scientific, Shanghai, China) was used for data acquisition and processing.
Determination of flavonoid content
A total of 200.0 mg/l of rutin standard solution was prepared by dissolving the rutin reference material in 70% ethanol. Standard rutin was purchased from the National Institute for the Control of Pharmaceutical and Biological Products (ID: 100080-200707). Fresh twigs were dried at 40°C for 3 d and crushed. Extraction and HPLC analysis of flavonoids of the samples were carried out as previously described (Tohge et al. 2005). Briefly, frozen samples were extracted with 30 µl of extraction buffer (methanol:acetate:H2O = 9:1:10) per mg dry sample at 37°C for 30 min. The supernatant was filtered with a 0.25-µm filter membrane after centrifugation at 14,000×g. Then, 1 ml of supernatant was applied to a Waters HPLC e2695 series. HPLC was carried out with an XBridge C18 (Φ 4.6 mm × 250 mm) at a flow rate of 0.5 ml/min. The elution gradient consisted of solvents A [CH3CN-H2O-TFA (10:90:0.1)] and B [CH3CN-H2O-TFA (90:10:0.1)] and the elution profile was 0 min 100% A, 30 min 70% A, 32 min 0% A, 33 min 0% A, 35 min 100% A, using linear gradients between the time points. Flavonoids were detected at 360 nm.
A series of standard solutions in the range of 0.001–0.05 mg/ml for amentoflavone, 0.002–0.10 mg/ml for quercetin and 0.002–0.20 mg/ml for ginkgetin were prepared in methanol (n =6). For amentoflavone, quercetin and ginkgetin, respectively, the results provided linear calibration curves of y =39x − 0.01, R2 =0.99; y = 79x− 0.12, R2 =0.99; and y =39x− 0.01, R2 =0.99. The yields were quantified using the calibration curves.
Statistical analyses
Statistical analyses were performed using SPSS software version 19.0 (SPSS Inc., Chicago, IL, USA), and one-way analysis of variance was used to compare taxoid content differences between the two Taxus species. Expression analysis was performed for three biological repeats, and the figures show the average values; *** indicates P < 0.001 ** indicates P < 0.01 and * indicates P < 0.05.
Funding
Our work was funded by the National Key Research and Development Project (2016YFC0503100), Zhejiang Provincial Natural Science Foundation of China under Grant No. LQ14C060001 and the National Natural Science Foundation of China (31401935 and 31601343).
Abbreviations
- ACN
acetonitrile
- CHI
chalcone-flavonone isomerase
- CMK
4-(cytidine 53 5′-diphospho)-2-C-methyl-D-erythritol kinase
- DEPs
differentially expressed proteins
- 10-DAB
10-deacetylbaccatin III
- DTT
dithiothreitol
- DXS
1-deoxy-D-xylulose 5-phosphate synthase
- DXR
1-deoxy-D-xylulose 5-phosphate reductoisomerase
- FA
formic acid
- FDR
False discovery rate
- GO
Gene Ontology
- HPLC
high performance liquid chromatography
- IAA
iodoacetamide
- KEGG
Kyoto Encyclopedia of Genes and Genomes
- LC-MS/MS
Liquid Chromatography-tandem mass spectrometry
- MEP
2-C-methyl-D-erythritol phosphate
- MS
mass spectrometry
- MS/MS
tandem mass spectrometry
- PPI
Protein-protein interaction
- MCODE
molecular complex detection
- PAL
phenylalanine ammonia-lyase
- F3H
flavanone-3-hydroxylase
- F3M
flavonoid 3'-monooxygenase
- MVA
mevalonate
- GGPPS
geranylgeranyl pyrophosphate synthase
- TMTs
tandem mass tags
- UPLC
Ultra Performance Liquid Chromatography
Acknowledgements
We are grateful to Kaidong Liu (Life Science and Technology School, Lingnan Normal University) for reading this manuscript. We are also grateful to the PTM Biolabs company for technical support.
Disclosures
The authors have no conflicts of interest to declare.
