


Abstract
Age-related macular degeneration (AMD) is the leading cause of blindness in the developed world and complement factor H (CFH) polymorphism has been found to associated with the AMD. We performed a meta-analysis to estimate the magnitude of the gene effect and the possible mode of action. A meta-analysis of eight studies assessing association between the CFH Y402H polymorphism and AMD was performed. Data extraction and study quality assessment were performed in duplicate, and heterogeneity and publication bias were explored. There was strong evidence for association between CFH and AMD, with those having CC and TC genotypes being roughly six and 2.5 times more likely to have AMD than patients with TT genotype, suggesting a co-dominant, multiplicative genetic model. The population attributable risk for the CC/TC genotype is 58.9%, i.e. the CFH polymorphism is involved in over half of all AMD. This meta-analysis summarizes the strong evidence for an association between CFH and AMD and indicates a multiplicative model with each C allele increasing the odds of AMD by ∼2.5-fold. This result is at least as important at the population level as ApoE4 and Alzheimer's disease, playing a role in almost 60% of AMD at the population level.
INTRODUCTION
Age-related macular degeneration (AMD) is the leading cause of blindness in the developed world (1–4), accounting for half of all new cases of registered blindness (5).With an ageing population, the burden of AMD is set to grow, with almost 30% of those older than 75 years showing early signs of disease (6–8). The pathological hallmark of the disease is drusen, deposits of protein and lipid, in the retinal pigment epithelium (RPE). This maculopathy progresses to degeneration in two forms: geographic atrophy in which there is loss of RPE and photoreceptors and neovascular AMD in which there is choroidal neovascularization and hemorrhages.
Little is known about the pathogenesis of AMD. Smoking is the only established risk factor, although other cardiovascular disease risk factors may also play a role (9). There also appears to be evidence for some genetic component through studies of (i) familial aggregation (10–13), (ii) segregation analysis (14,15), (iii) twin studies (11,16,17) and (iv) several linkage studies (4,18–23) culminating in a meta-analysis (24).
Although several monogenic forms of macular dystrophy have been described and their genes identified (reviewed in 15,25), these have not shed light on sporadic AMD.
Six independent linkage studies have found, among other signals, strong LOD scores for chromosome 1q31 (19,20,22,23,26,27). A particularly strong candidate gene in this region is complement factor H (CFH). The complement cascade is involved in innate immunity and inflammation. CFH is a serum glycoprotein that controls the function of the alternative complement pathway and acts as a cofactor with factor I, also known as C3b inactivator, to regulate the activity of C3 convertases; hence, CFH has an anti-inflammatory role (28). The Y402H polymorphism (OMIM no. 134370.0008) is defined by a substitution of tyrosine to histidine at codon 402 of the CFH gene, a region of the protein that binds heparin and C-reactive protein. It has been hypothesized that this amino acid change decreases the affinity for these ligands and compromises the anti-inflammatory effect of CFH (29,30). Indeed, inflammation has been implicated in the pathogenesis of AMD (28), e.g. via increased C-reactive protein levels (31), and immunohistochemical staining of complement proteins in drusen (32,33). Although recent reviews have addressed the association between the CFH and AMD (34), these have not included formal meta-analytic methods and neither the magnitude of the genetic association nor the genetic mode of action have been reported.
We therefore systematically pooled the results of all available population-based association studies between CFH Y402H and AMD with the following objectives: first, to estimate prevalence of the risk allele; secondly, to ascertain if there is a genetic effect on AMD susceptibility, and if so to estimate the magnitude of that gene effect and the possible genetic mode of action (35,36).
RESULTS
Twenty-six studies were identified by our search strategy, of which eight studies (37–44) were eligible for inclusion in the review. Two of these (37,41) did not have genotype information, but authors kindly provided supplementary information. Eighteen studies were ineligible for the following reasons: 11 were reviews, two did not have AMD as the outcome, one was an animal study, one was not in English, one used a family-based design, one did not measure CFH polymorphisms and one used spouse controls rather than population controls. Characteristics of the eight included studies are described in Table 1. All studies were case–control designs with subjects of European ancestry; mean age ranged from 72.7 to 80.0 years; percent males ranged from 37.8 to 54.2%. The quality of studies ranged from 4 to 9, out of a best possible score of 12.
General characteristic of studies included in the review
| Authors | Year | Study design | Mean age | % Male | Quality score | Cases | Controls |
|---|---|---|---|---|---|---|---|
| Conley (37) | 2005 | Case–control | 73.1 | 41.7 | 6 | AMD with extensive/coalescent drusen, pigmentary changes and/or presence of the end stage (geographic atrophy, neovascularization) | Controls without AMD or small number of hard drusen (<15 µm) |
| Edwards (38) | 2005 | Case–control | 72.7 | 54.2 | 7 | AMD with extensive drusen, pigmentary abnormality, atrophy or neovascularization | Patients who have no more than four small hard drusen without family history |
| Hageman (39) | 2005 | Age-matched case–control | 73.9 | 4 | AMD with stages 1a, 1b, 2a, 2b, 3, 4 (geographic atrophy, neovascularization) using fundus photograph by one author | Patients with stage 0 and without family history of AMD | |
| Klein (40) | 2005 | Case–control | 80.0 | 47.4 | 4 | AMD with neovascularization, or geographic atrophy by photographic assessment | Controls had either no or only small drusen (<63 µm) |
| Magnusson (41) | 2005 | Case–control | 5 | AMD with advanced (neovascularization, geographic atrophy) and early stages by photograph | Controls with normal eye examination | ||
| Rivera (44) | 2005 | Case–control | 74.8 | 37.8 | 4 | AMD with early or late stage (geographic atrophy, neovascularization) using fundus photograph | Controls were free from AMD examined by ophthalmoscopy |
| Souied (42) | 2005 | Case–control | 74.4 | 40.0 | 9 | AMD with neovascularization with/without family history of AMD | Controls without AMD by fundus photograph |
| Zareparsi (43) | 2005 | Case–control | 77.8 | 37.8 | 5 | AMD with late stage (neovascularization or geographic atrophy) and large macular drusen | Patients who did not have evidence of AMD by ophthalmic examination |
Allele frequency
Data from control groups were used for pooling allele prevalence (Table 2). All studies (37–43), except one (44), observed Hardy–Weinberg equilibrium (HWE) and were included in pooling. There was evidence of heterogeneity of allele frequencies among studies (χ2=14.629, d.f.=6, P=0.023, I2=59.4%). The pooled prevalence for the risk allele C was 34.9% [95% confidence interval (CI): 32.4, 37.5]. Including the one study not in HWE yielded a similar result, i.e. 35.6% (95% CI: 33.6, 37.6).
Estimation of the pooled prevalence of the CFH Y402H allele
| Authors | HWE | N | T | C | ||
|---|---|---|---|---|---|---|
| P-value | Frequency | % Allele | Frequency | % Allele | ||
| Conley (37) | 0.179 | 216 | 148 | 68.5 | 68 | 31.5 |
| Edwards (38) | 0.528 | 380 | 245 | 64.5 | 135 | 35.5 |
| Hageman (39) | 0.184 | 806 | 531 | 65.9 | 275 | 34.1 |
| Klein (40) | 0.760 | 96 | 59 | 61.5 | 37 | 38.5 |
| Magnusson (41) | 0.441 | 2530 | 1553 | 61.4 | 977 | 38.6 |
| Rivera (44)a | 0.031 | 1892 | 1185 | 62.6 | 707 | 37.4 |
| Souied (42) | 0.215 | 182 | 127 | 69.8 | 55 | 30.2 |
| Zareparsi (43) | 0.105 | 550 | 364 | 66.2 | 186 | 33.8 |
| Pooled prevalence (%) | 65.1 (95% CI: 62.5, 67.6) | 34.9 (95% CI: 32.4, 37.5) | ||||
aNot included in pooling, disequilibrium coefficient=−0.02.
Gene effect
Seven studies were included in assessing the association between CFH Y402H gene and AMD (37–43). The CFH Y402H genotype frequencies between case and control groups are described in Table 3. The genotype effects for CC and TC versus TT genotypes (OR1 and OR2, respectively) were estimated for each study.
Genotype frequencies of CFH Y402H polymorphism between AMD and control groups
| Authors | AMD | Control | CC/TT | TC/TT | ||||||||
|---|---|---|---|---|---|---|---|---|---|---|---|---|
| N | Genotype | N | Genotype | OR | (95% CI) | OR | (95% CI) | |||||
| TT | TC | CC | TT | TC | CC | |||||||
| Conley (37) | 168 | 22 | 81 | 65 | 108 | 54 | 40 | 14 | 11.40 | 5.32, 24.39 | 4.97 | 2.66, 9.27 |
| Edwards (38) | 395 | 85 | 186 | 124 | 190 | 81 | 83 | 26 | 4.54 | 2.70, 7.65 | 2.14 | 1.43, 3.18 |
| Hageman (39) | 952 | 192 | 454 | 306 | 403 | 181 | 169 | 53 | 5.44 | 3.82, 7.76 | 2.53 | 1.93, 3.31 |
| Klein (40) | 95 | 14 | 39 | 42 | 48 | 17 | 25 | 6 | 8.50 | 2.80, 25.79 | 1.89 | 0.80, 4.51 |
| Magnusson (41) | 1330 | 264 | 644 | 422 | 1265 | 470 | 613 | 182 | 4.13 | 3.28, 5.20 | 1.87 | 1.55, 2.25 |
| Rivera (44)a | 1166 | 199 | 530 | 437 | 946 | 355 | 475 | 116 | 6.72 | 5.14, 8.79 | 1.99 | 1.61, 2.46 |
| Souied (42) | 141 | 30 | 63 | 48 | 91 | 47 | 33 | 11 | 6.84 | 3.07, 15.21 | 2.99 | 1.61, 5.57 |
| Zareparsi (43) | 616 | 86 | 311 | 219 | 275 | 114 | 136 | 25 | 11.61 | 7.05, 19.14 | 3.03 | 2.15, 4.23 |
| Pooled OR | 6.32 | 4.25, 9.48 | 2.50 | 1.96, 3.30 | ||||||||
| λ (95% CI) | 0.50 (0.34, 0.71) | |||||||||||
aNot included in pooling.
There was evidence of heterogeneity for both OR1 (χ2=19.34, d.f.=6, P=0.004) and OR2 (χ2=14.52, d.f.=6, P=0.024). Logistic regression with a random effects model indicated a significant overall gene effect [likelihood ratio (LR) test=239.41, d.f.=2, P<0.001]. Multivariate meta-analysis was applied and the pooled OR1 and OR2 were 6.32 (95% CI: 4.25, 9.48) and 2.50 (95% CI: 1.96, 3.30), respectively. This means that patients who had CC and TC genotypes were roughly six and 2.5 times more likely to have AMD than patients with TT genotype. The estimated λ was 0.50 (95% CI: 0.34, 0.71), which suggests a co-dominant mode of action. There was no evidence of publication bias for either OR1 or OR2 (Egger test, P 0.076 and 0.152, respectively). The cumulative meta-analysis showed that both OR1 and OR2 were very high in the first study but have not varied much after the second study (Figure 1).
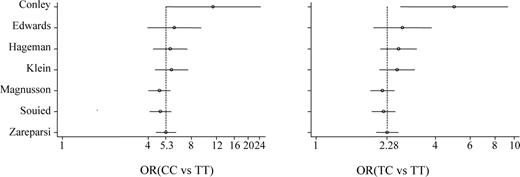
Cumulative meta-analysis for OR1 and OR2.
Sensitivity analysis was performed by including the study not in HWE and similar results were found, i.e. the pooled OR1, OR2 and λ were 6.34 (95% CI: 4. 58, 8.79), 2.38 (95% CI: 1.96, 3.02) and 0.47 (95% CI: 0.35, 0.64), respectively. Analysis taking into account the Hardy–Weinberg disequilibrium (HWD) coefficient F was again largely similar: OR1 of 5.73 (95% CI: 4.40, 7.95), OR2 of 2.57 (95% CI: 2.17, 3.24) and λ of 0.54 (0.42, 0.71).
Meta-regression was used to explore the cause of heterogeneity and it was found that mean age was associated with ln OR1 (coefficient=0.12, P=0.025). The mean age for six studies ranged from 72 to 80 with a median of 74 years. We therefore did a subgroup analysis with mean age<74 and mean age ≥ 74 years. There was no heterogeneity among these two subgroups for OR1 (χ2=3.97, d.f.=2, P=0.137 for age<74 years; χ2=1.29, d.f.=2, P=0.526 for age≥74 years). The pooled OR1 for these two subgroups were 5.99 (95% CI: 3.92, 9.15) and 9.80 (95% CI: 6.60, 14.56), respectively. There was a decrease in heterogeneity among these two subgroups for OR2 (χ2=5.11, d.f.=2, P=0.078 for age<74; χ2=0.99, d.f.=2, P=0.608 for age≥74). The pooled OR2 were 2.78 (95% CI: 1.90, 4.04) and 2.87 (95% CI: 2.16, 3.82) for age<74 and age≥74, respectively.
DISCUSSION
Our meta-analysis summarizes the evidence to date regarding the association between CFH Y402H and AMD, representing a pooled total of 3697 cases and 2380 controls. The results indicate a strong association and a co-dominant mode of action, with no evidence of publication bias. CT heterozygotes carry a roughly 2.5-fold increased risk of AMD, and CC homozygote variants carry just over a 6-fold increase in risk compared with TT homozygotes. In addition, sensitivity analyses by including the one study not observing HWE or the one study (45) where controls were spouses showed similar and consistent results. These numbers indicate a co-dominant model, i.e. there is an incremental increase in risk with each copy of the risk allele. The point estimates indicate a multiplicative mode of action, i.e. 2.5×2.5=6.25, but an additive model cannot be ruled out given the wide CIs, i.e. 2.5+2.5=5.0.
These results are robust given our careful methodology. We pooled only population-based studies making no assumptions about genetic models (46). We avoided multiple comparisons by doing one overall test of the genetic association (36) and checked and adjusted for HWD before pooling. The pooled odds ratios clearly fit a multiplicative model, and the λ parameter clearly indicates a co-dominant model with tight CI.
There is heterogeneity in the pooled estimate of OR1 and OR2; this appears to be due to an increasing genetic effect with age, although it may also represent variation with early- and late-stage AMD. Another possible source of heterogeneity is the type of AMD: neovascular or geographic atrophy. Unfortunately, it was not possible to tease out this association because the breakdown of the two types was not consistently reported. Previous individual studies have reported an equally strong association between CFH and both types, e.g. Magnusson et al. (41), although others find a stronger associations with neovascular AMD (30,45).
It is also unclear whether the risk effect is due solely or entirely to the CFH Y402H variant. Hageman et al. (39) detected 26 SNPs in the CFH locus, 17 in the coding region and nine in the non-coding region. There was a strong linkage disequilibrium between the C allele of Y402H and three other downstream SNPs, IVS10 (T allele), Q672Q (A allele) and D936E (G allele). This creates a haplotype, H1, with the C allele at Y402H, which accounts for 50% of AMD cases and 29% of controls; the other four common haplotypes all have the T allele at Y402H.
The C allele is reasonably common, with an allele frequency of 35%. This means that the effect at the population level could be quite important. The proportion of CC and TC genotypes in control population is 59.5% and the pooled OR for these two genotypes is 3.40. The population attributable risk (PAR) for the combined genotypes CC and TC is 58.9%, i.e. the CFH polymorphism is involved in (or in other words, the CFH allele contributes to) over half of all AMD, slightly higher than previous estimates (28). In order to provide some context for the strength of this association, we compare this PAR with that of a well-accepted genetic association, i.e. ApoE and Alzheimers' disease. Previous meta-analysis of ApoE and Alzheimer's disease in European ancestry subjects showed an OR for the combined E4E4 and E3E4 versus E3E3 genotypes of 4.05, and the proportion of E4E4 and E3E4 in control population was 23.1% (48), giving an estimated PAR of 41.3%.
In summary, this meta-analysis summarizes the strong evidence for an association between CFH and AMD and indicates a potentially multiplicative model with each C allele, increasing the odds of AMD by ∼2.5-fold. This result is at least as important at the population level as ApoE4 and Alzheimer's disease, playing a role in almost 60% of AMD at the population level.
MATERIALS AND METHODS
Search strategy
MEDLINE (from January 1966 to February 17, 2006) was searched using the PubMed search engine. The search strategy was (‘macular degeneration’) AND (‘complementary factor H’ OR CFH'). Results were limited to English language papers.
Inclusion criteria
Any human population-based association study, regardless of sample size, was included if it met the following criteria The reference lists of the retrieved articles were also reviewed to identify publications on the same topic. Where there were multiple publications from the same study group, the most complete and recent results were used.
Determined association between CFH Y402H polymorphism and AMD. The alleles and genotypes for this polymorphism were T and C, and TT, TC and CC, respectively.
The outcome was AMD and there were at least two comparison groups, e.g. AMD versus control (non-AMD) groups. For those studies where AMD was graded (i.e. drusen, pigment abnormalities in RPE, geographic atrophy and choroidal neovascularization), these grading were collapsed into only one AMD group.
Data extraction
Data were extracted independently and in duplicate by two reviewers (H.P. and M.M.) using a standardized data extraction form. Covariables such as mean age, gender and ethnicity were also extracted for each study. Any disagreement was adjudicated by a third author (T.A.).
Quality score assessment
The quality of studies was independently assessed by two reviewers (H.P. and M.M.) using a quality assessment score developed for genetic association studies. These scores were based on both traditional epidemiological considerations and genetic issues. Total scores ranged from 0 (worst) to 12 (best). Any disagreement was adjudicated by a third author (T.A.).
Statistical analysis
HWE was assessed in the control group of each study using an exact test. Disequilibrium coefficient was also estimated. The analyses were performed as follows: Two approaches for handling HWD were taken: First, sensitivity analyses were performed by including and excluding studies not in HWE. Secondly, we included all studies regardless of HWE and instead adjusted for the degree of disequilibrium using the inbreeding coefficient (F), as described by Trikalinos et al. (53). Briefly, the inbreeding coefficient (F) was estimated for each study using data in the control group. Predicted genotype frequencies were estimated (54) and were used instead of the observed frequencies in the summary analysis of magnitude and genetic model.
Pooled allele prevalence. This was estimated separately according to ethnicity (49) using the random effects model if heterogeneity among studies was present and the fixed effects model if heterogeneity was absent. Data in control groups only were used for this analysis.
Overall test of genetic association. The Q test for heterogeneity was performed separately for two odds ratios (ORs), i.e. CC versus TT (OR1) and TC versus TT (OR2). If there was heterogeneity on at least one of these ORs, the cause of heterogeneity was explored by fitting a covariable (e.g. age, gender) in a meta-regression model (50–52). Logistic regression analysis was used to determine the overall gene effect by fitting the genotypes into the logit model. An LR test was then applied to assess whether the gene effect was significant.
Magnitude and genetic model. Once a gene effect was confirmed, the per-genotype analysis was used to ascertain the genetic model. The genotype effects were estimated using the model-free approach (46), in which no assumptions about genetic models are required. The OR1 and OR2 were estimated using multivariate meta-analysis with Bayesian methods. The log ORs were modeled accounting for both between and within study variations. A parameter λ, consisting of the ratio of log OR2 versus log OR1, was calculated, which reflected the genetic mode of action, as defined previously. Briefly, if λ=0 then a recessive model is suggested; if λ=1 then a dominant model is suggested; if λ=0.5 then a co-dominant model and if λ is greater than 1 or less than 0, then a homozygous or heterosis model is likely.
Publication bias was assessed using the Egger test (55,56). Cumulative meta-analysis was also performed (56). In addition, PAR for having CC/TC genotypes was determined (57,58). Analyses were performed using STATA version 9.0 (59) and WinBugs 1.4 (60), with normal vague prior distributions for estimation of parameters (i.e. λ and odds ratio). The models were run for a burn-in of 10 000 iterations, followed by 50 000 iterations for parameter estimates. A P-value less than 0.05 was considered statistically significant, except for tests of heterogeneity where a level of 0.10 was used.
Addendum
While this manuscript was under review, a population-based association study by Despriet et al. (47) was published. This large prospective cohort study finds virtually identical results to this meta-analysis in that the allele frequency is 36.2% compared with 34.9% in our review, a PAR of 54% is calculated compared with 59% in our review and the odds ratios for the CT and CC genotypes and incident late AMD are found to be 2.5 and 7.6, respectively, compared with 2.5 and 6.3 in our review.
ACKNOWLEDGEMENTS
Our thanks to Michael Gorin, Johanna Jakobsdottir and Daniel Weeks for providing additional data.
Conflict of Interest statement. All authors declare that there was no conflict of interest.
