


Abstract
Aims Important changes in cardiovascular and all-cause mortality rates are occurring in Western and Eastern Europe, each with their own dynamics. Differences in trends will be analysed and possible causes are discussed.
Methods and results Mortality data for cardiovascular and all-cause mortality rates from different countries were obtained from WHO and were analysed for the period 1970–2000. The annual changes in cause-specific mortality rates were calculated using linear and polynomial regression models. Mortality rates declined almost linearly for ischaemic heart disease, stroke, and total cardiovascular diseases between 1970 and 2000 in Western Europe. In both men and women, the decline for these diseases varied between 50 and 65% or ∼2%/year in this period. In contrast, in Eastern Europe cardiovascular mortality rates reached a maximum in the period 1990–94, followed by a decline of ∼3%/year in Poland, 2%/year in Hungary, and 5%/year in the Baltic states. The changes in cardiovascular mortality rates were reflected in all-cause mortality rates in both Western and Eastern Europe.
Conclusion Over the past 30 years, mortality rates in cardiovascular diseases increased or decreased very rapidly. The causes are complex but changes in diet appear to play a major role. The more recent declines in Western Europe also reflect improvements in modern cardiovascular treatment.
This paper was guest edited by Prof. Annika Rosengren, Sahlgrenska University Hospital at Östra, Göteborg University (Östra Sjukhuset), Sweden
Introduction
Since 1970, substantial decreases occurred in age-specific mortality rates from cardiovascular diseases in Western European countries, whereas a continuous increase was noted in Eastern European countries up to the early 1990s.1 The first report on a decrease in age-specific mortality rates from cardiovascular diseases in Eastern Europe was from Poland, in which a decrease from ischaemic heart disease (IHD) of >20% was reported for middle-aged men and women in the period 1991–94.2
This decrease occurred after the collapse of the Soviet Union around 1990 and had great consequences for the political, social, and economic developments in the former communist states in Eastern Europe, including the occurrence of mass diseases such as cardiovascular diseases.
This report describes the evolution of mortality rates from cardiovascular diseases and all-cause mortality in Western and Eastern European countries over a 30-year period from 1970 to 2000. The changes in cardiovascular and all-cause mortality are interpreted in the light of the available evidence on changes in environmental risk factors and cardiovascular medical care in Western and Eastern Europe.
Methods
Data on mortality rates of 5-year age-classes between the ages of 0 and 84 years3 were provided by WHO (World Health Organization). Data used in this study covered the age range 45–74 years, because mortality rates below age 45 are very low and the age-structure is very different among men and women in European countries for persons above age 74. Mortality rates were expressed as rate per 100 000 per year. Age-standardization was performed by the direct method using the WHO European population as standard.
Three versions of the International Classification of Diseases (ICD) were used: the 8th revision (ICD-8) from 1970, the ICD-9 from about 1980, and the ICD-10 from about 1995.4 The different classifications are not a major problem, because the present study is focused on broad classes: IHD, stroke, total cardiovascular (TCV), and all-cause mortality. IHD was defined as ICD-10 codes I20–I25, stroke as ICD-10 codes I60–I69, and TCV diseases as ICD-10 codes I00–I99.4
The evolution of mortality was evaluated for each country from 1970 to 2000. For Western Europe, data are available for nearly all countries, with the exception of Belgium, where because of the regionalization of the country, official data are only available until 1997 (except all-cause mortality until 2000). For Eastern Europe, continuous mortality data are only available since 1970 for Poland and Hungary. For most of the other countries in Eastern Europe, data are only available since 1985. Combined mortality trends are presented for 17 countries from Western Europe and also for two countries with a large difference in absolute mortality rates for cardiovascular diseases and diverse trend patterns, namely Finland and Spain.
For Eastern Europe, it has been previously shown that absolute rates for cardiovascular mortality of Estonia, Latvia, and Lithuania (ELL) are similar.5 The number of inhabitants in ELL is small, and as a consequence, the mortality data have been combined. It has been previously shown that these countries are quite representative for the changes occurring in Eastern Europe.4,6 The former Soviet Union and the Czech Republic were excluded due to the break-up of these countries in the early 1990s.
Average mortality rates were calculated for all countries of Western Europe (with the exception of countries with very small populations such as Iceland, Luxembourg, Malta, and Cyprus) and for ELL. To calculate the mean, the mortality rate per 100 000 per year of these two groups, age-, and country-specific mortality rates were combined and unadjusted for population size. This gives equal importance to the determinants of mortality in each country. For this reason, countries with very small populations were not included in Western Europe.
To reduce random variation in annual mortality rates in the trend figures, rates were averaged for 3 years with the exception of the first and final years, for which the rates were based on 2 years. Thereafter, the percentage annual change of the cause-specific mortality rates for the age group 45–74 since 1970 was calculated using a linear regression model. The annual mortality rates were regressed on calendar year, and from the regression coefficient, the annual percentage change in mortality rate and its standard error were obtained. Two-sided P-values were considered statistically significant if P<0.05.
The linearity assumption for the annual percentage change was tested by visual inspection and by calculating the R2 for different models. For Western European countries, with the exception of IHD mortality in Spain, very high R2 values were obtained >0.9. Whenever the R2 values were less than 0.9, as was the case for the Eastern European countries, the time period was split and the annual percentage change was calculated for the two periods. Peak value years were chosen for each country as the year of the highest mortality in men for all-cause mortality. The highest rates for all-cause mortality in men were observed in 1991 in Poland, in 1993 in Hungary, and in 1994 in the three Baltic states. The same procedure was used for IHD mortality rates in Spain. The highest rates were achieved in 1975. In addition, second-degree polynomial equations were calculated. The years (0–30 or 0–15), depending on the country considered, were the independent variables for both the linear and polynomial equations.
Results
Since 1970, a continuous decrease in IHD mortality rates occurred in men from Western Europe (Figure 1A and Table 1). In the period 1970–2000, IHD mortality declined, on average, to ∼50% corresponding to an annual decline of 1.8%/year. In Finland, a decrease of >60% in both genders was observed. In Spain, in the period 1970–75, an increase of 41% for men and of 35% for women (for both genders P<0.001) was followed by a decrease in the following 25 years (−33% for men and −47% for women, for both P<0.0001). In Poland and Hungary, increases in IHD mortality were observed between 1970 and the early 1990s of ∼80 and 35%, respectively, but thereafter, decreases of ∼2%/year were noted. Similarly, in the Baltic states, an increase of ∼3%/year between 1985 and 1994 was followed by a dramatic decrease of ∼6%/year. In women, similar trends were observed. In Western Europe, a decline of ∼55% in IHD mortality was noted between 1970 and 2000 (Figure 1B and Table 1). Again, the largest decline was observed in Finland. In the Eastern European countries, an increase in IHD mortality was noted between 1970 and the early 1990s, but thereafter, a decrease took place especially in the Baltic states.
Stroke mortality declined continuously in men in Western Europe since 1970. Between 1970 and 2000, the decrease was on average 60% (Figure 2A and Table 1). In Poland, stroke mortality increased continuously between 1970 and 2000. In Hungary and the Baltic states, stroke mortality increased until the early 1990s and decreased thereafter. The current stroke mortality rates are four times higher in Hungary and the Baltic states when compared with Spain. In addition, the stroke mortality rates in women from Western Europe declined by >65% between 1970 and 2000 (Figure 2B and Table 1). In Poland, stroke mortality rates increased continuously, but the strongest increase was observed between 1991 and 2000. In Hungary, the stroke mortality rates did not show a clear trend till 1993 and thereafter declined by >2%/year. In the Baltic states, stroke mortality rates declined between 1993 and 2000 by ∼30%.
Since 1970, a continuous decrease in TCV mortality rates was observed in men in Western Europe (Figure 3A and Table 1). In the period 1970–2000, TCV mortality decreased on average ∼50% corresponding to an average annual decline of ∼1.8%/year. Larger declines of ∼60% were observed in Finland and Spain. In Hungary and Poland, increases in TCV mortality rates were observed till the 1990s and thereafter decreases of ∼3%/year. In the Baltic states, the TCV mortality rates declined by ∼5%/year since 1994.
In women, different trends were observed (Figure 3B and Table 1). In Western Europe, a very large decline in TCV mortality rates of ∼60% or 2%/year was observed between 1970 and 2000. Declines of >70% were observed in women from Finland and Spain. In women from Poland, a small increase in TCV mortality rates was observed between 1970 and 1991 but a small decrease in women from Hungary. In these countries, a decline of ∼3%/year was observed since the early 1990s. In the Baltic states, average TCV mortality decreased by ∼5%/year since 1994.
Between 1970 and 2000, all-cause mortality rates in Western Europe decreased by ∼40% in men (Figure 4A and Table 1). The average annual decline was ∼1.3%/year. A larger decline was observed in Finland with 1.7%/year. In Hungary and Poland, increases in all-cause mortality rates were observed till the 1990s. Thereafter, decreases of >1.5%/year were noted in these countries. In the Baltic states, an increase of ∼4%/year in the period 1985–94 was followed by a decline of a similar magnitude in the following 6 years.
Trends were different in women, especially in Eastern Europe (Figure 4B and Table 1). Like in men in Western Europe, a continuous decrease in all-cause mortality rates of ∼1.4%/year was found in women. A larger decline was observed in Spain of 2%/year. In both Hungary and Poland, all-cause mortality rates were relatively stable in women, from 1970 till the early 1990s. Thereafter, decreases of ∼2%/year were observed. The most dramatic changes occurred in women in the three Baltic states, in which a 1.6%/year increase was noted in the period 1985–94 and a 4%/year decrease in the following years.
In Table 2, the results of the polynomial analysis are presented. The regression coefficients of the quadratic polynomial term are negative and highly significant for the four causes of death in the different Eastern European countries. For Western Europe, this was the case for men for IHD, TCV, and all-cause mortality, but not for stroke mortality. For Western European women, the quadratic polynomial term was only negative for IHD mortality.
Discussion
Important and rapid changes in cardiovascular and all-cause mortality rates are occurring in Europe. Between 1970 and 1990, these changes had opposite directions in Western and Eastern Europe, leading to an increase in the gradient in the rates for cardiovascular and all-cause mortality.1,6 In 1990, the ratio for the highest vs. the lowest regions in Europe amounted to 4.5 for cardiovascular and 1.8 for all-cause mortality.1 However, during the 1990s, the cardiovascular and all-cause mortality rates also started to decrease in Eastern European countries. This decline started approximately 25 years later than in Western European countries.
One of the most remarkable findings is not only the recent decline in mortality in Eastern Europe but also the rate of the decline. Both the linear and the polynomial analyses showed that the rate of decline in the Eastern European countries in the 1990s was much stronger than the rate of decline in Western Europe in the 1970s. An other interesting result is that in Western Europe, the quadratic terms in the polynomial equations for cardiovascular and all-cause mortality are negative for men and positive for women. This may be explained by differential trends in smoking behaviour in men and women. Similar trends have been observed in the USA, probably for the same reason.7
The high mortality rates in Eastern Europe have been a matter of much speculation,8,9 but few studies on the causes of these high mortality rates and their rapid changes have been carried out. Cross-cultural research, e.g. the Seven Countries Study, has shown that differences in mortality rates in IHD and all-cause mortality can be explained by differences in the prevalence of smokers and in diet such as a high saturated fat intake and a low intake of antioxidants, e.g. flavonoids and vitamin C.10,11 Other socio-environmental factors may also play a role. In the case of Eastern Europe, a high alcohol consumption and high levels of violence have been postulated as major causes, but remain controversial.12,13 For example, the high mortality rates in the age class 75–84 in Eastern Europe6 point to other causes, such as the consequences of poverty,14 because violence and alcohol excesses are improbable as major causes of death in this age class, especially in women.
One of the reasons for the high mortality rates in Eastern Europe before 1990 was likely the high intake of saturated fat. In the period 1977–90, the European Union exported 1 822 643 t of butter at strongly subsidized prices to the former communist European States (Comecon). A total of 2 712 191 t of meat and meat products was also exported during the same period.15 These quantities cannot in themselves explain the high cardiovascular and all-cause mortality rates in the former Comecon countries but could play a crucial role, because they were consumed on top of a diet already high in saturated fat.
Evidence for a major role of diet in explaining changes in IHD mortality rates within Eastern European countries comes independently from several countries. In Poland, the ratio of vegetable to animal fat increased from 0.29 in 1990 to 0.52 in 19942 and to 0.61 in 2000.16 Similar changes were observed for the ratio of polyunsaturated to saturated fat. Between 1990 and 1999, the intake of saturated fat declined by 7% and that of polyunsaturated fat increased by 57%. The P/S ratio increased by 70%. The increase in the intake of polyunsaturated fat was due to a higher intake of rapeseed and soy oil. Thus, the increase concerned both the intake of omega-3 and omega-6 fatty acids. These changes were related to the decline in coronary heart disease mortality in Poland.17 The change in type of fat consumption was due to lower subsidies for animal fat products and an increased availability and demand for vegetable fat. The per capita fruit supply increased from 33.1 kg/year in 1990 to 40.2 kg/year in 1994 and to 52.2 kg/year in 2000. During the same period, the supply of vegetables remained unchanged.16 Between 1990 and 2000, the per capita alcohol consumption increased from 116 to 138 kcal/day.
The most impressive changes in IHD mortality rates were observed in the Baltic states. Between 1994 and 2000, the IHD mortality rates decreased, on average, by 6%/year. In this period, the ratio for the availability of vegetable vs. animal fat increased from 0.21 to 0.61 and the per capita consumption of fruit increased by 68%.16 Surveys carried out in Estonia and Lithuania in 1994 and 1998 confirmed the changes in fat consumption in these countries. The percentage users of vegetable cooking oil increased from 64 to 82% in Estonia and from 41 to 81% in Lithuania.18 In the same period, no major changes were observed in these countries in the prevalence of smoking, consumption of strong alcoholic beverages, and leisure time physical activity.18 This is further supported by recent data from Lithuania showing that the proportion of persons using vegetable oil for cooking had more than tripled between 1994 and 2002. More than half of the population replaced butter by low-fat margarine as spread.19 The prevalence of smokers remained stable during that period in men, but doubled in women to 12%. The prevalence of beer drinking increased considerably and the consumption of strong alcohol remained stable.20 These data suggest that changes in dietary habits offer the most plausible explanation for the decline in IHD mortality rates since 1994.
In contrast to Eastern Europe, the IHD mortality in Finland decreased by >50% in the period 1972–92.21 This decline could largely be explained by changes in three major risk factors such as a decrease in the percentage of smokers and a decrease in average serum cholesterol and blood pressure levels. The changes in the latter two risk factors could, to a large extent, be ascribed to improvements in dietary habits (e.g. decrease in saturated fatty acid intake by changing from butter to polyunsaturated fatty acid rich margarines, changing from whole-fat to low-fat milk, changing from boiled to filtered coffee, increasing fruit and vegetable consumption, and reducing salt intake).22 The changes in these three risk factors predicted a decrease in IHD mortality of 44% in men and 49% in women. This is approximately 80 and 70% of the observed decline in men and women.
Between 1981 and 2000, IHD mortality decreased by >50% in England and Wales.23 Almost 60% of the decrease was attributable to reduction in major risk factors, particularly smoking, and ∼40% to the combined effects of modern cardiological treatments. An analysis of the decline in IHD mortality in the USA showed that 63% of the decline in the period 1968–76 could be ascribed to lowering of risk factors and 31% to medical interventions.24 A similar analysis of the decline in the period 1980–90 ascribed 25% of the decline to primary prevention, 29% to secondary prevention through risk factor lowering in patients, and 43% to improvements in treatment of cardiac patients.25 However, revascularization only accounted for 4–5% of the IHD mortality decline.23,26,27
The results from Finland and the USA show that in the 1970s, ∼70% of the decline in IHD mortality could be ascribed to risk factor reduction. In the period 1980–90 in the USA and between 1981 and 2000 in the UK, ∼60% of the decrease could be attributed to risk factor reduction and 40% to the combined effect of modern cardiovascular treatments. These results suggest that in recent years, the effect of modern cardiovascular treatment on the decline in IHD mortality in the USA and UK became considerable.
The most likely explanation for the recent impressive decline in IHD mortality in Eastern European countries is changes in environmental factors. This was made plausible for Poland, Estonia, and Lithuania.2,18 The changes in fatty acid composition of the diet (less saturated and more polyunsaturated fat) and more antioxidants through an increase in fruit consumption are most prominent in this context. A survey of the European Society of Cardiology showed that around 1995, the use of, for example, percutaneous coronary interventions and coronary artery by-pass surgery was very low in Poland and in the Baltic states.28 This again suggests that the recent declines in these Eastern European countries are primarily the result of reductions in environmental risk factors.
In spite of the recent decline, the IHD mortality rates are still more than twice as high as in Eastern European countries, for example, Hungary and the Baltic states, when compared with Western European countries. In men, high smoking rates in combination with a diet high in saturated fat and low in fruits and vegetables may be responsible for these differences.2,18 However, this cannot be the only explanation for the high IHD mortality rates among Eastern European women because their smoking rates are low,18,29,30 but they have a high prevalence of obesity.31 In combination with an atherogenic diet and physical inactivity,18 this could be an explanation for the much higher IHD mortality rates in Eastern European when compared with Western European women.
In conclusion, this report shows that both cardiovascular and all-cause mortality rates change rapidly. In Western European countries, these mortality rates have been declining since the 1970s and are followed by declines in several Eastern European countries in the 1990s. Evidence is accumulating that the early declines in cardiovascular mortality (especially IHD) are, to a large extent, due to changes in diet and lifestyle factors. The more recent declines in Western Europe and the USA are also due to improvements in modern cardiovascular treatment. This illustrates the large potential for further declines in Eastern European countries.
Acknowledgements
The authors thank Mrs Christine Lauwereys for her excellent data management.
Conflict of interest: none declared.
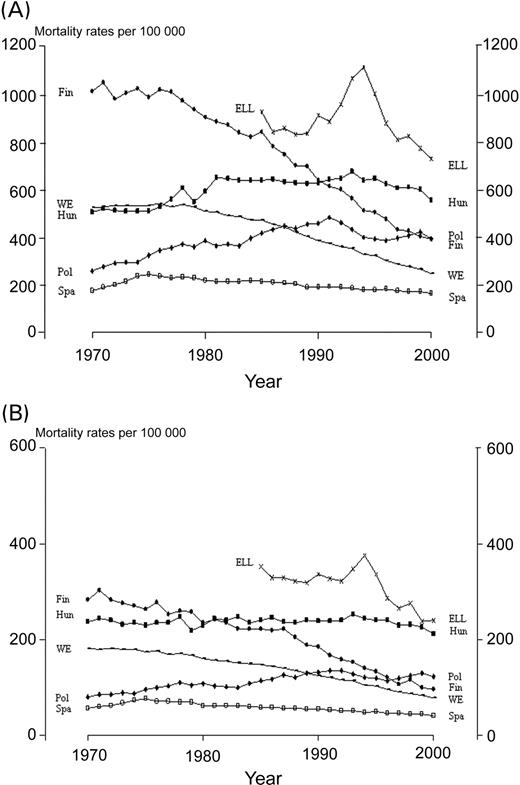
Figure 1 Time trends in IHD mortality in 1970–2000 (A) for men aged 45–74 years and (B) for women aged 45–74 years. WE, Western Europe (Austria, Belgium, Denmark, England and Wales, Finland, France, Germany, Greece, Ireland, Italy, The Netherlands, Norway, Portugal, Scotland, Spain, Switzerland, Sweden).
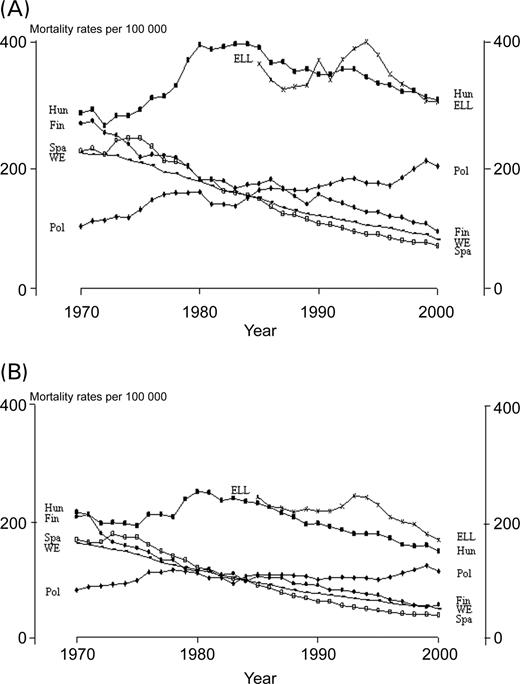
Figure 2 Time trends in stroke mortality in 1970–2000 (A) for men aged 45–74 years and (B) for women aged 45–74 years.
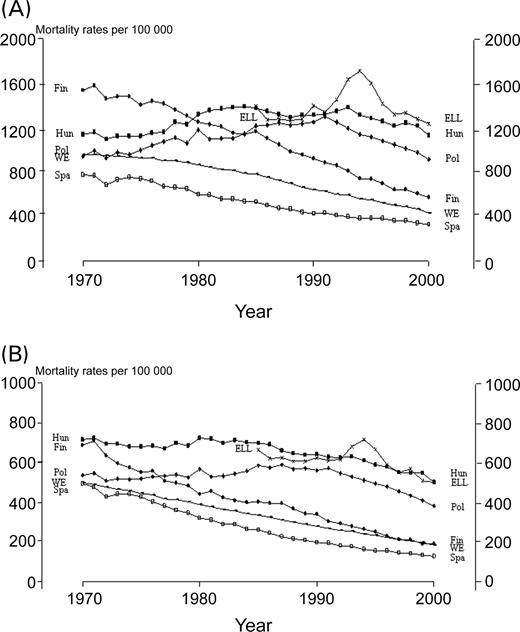
Figure 3 Time trends in TCV mortality in 1970–2000 (A) for men aged 45–74 years and (B) for women aged 45–74 years.
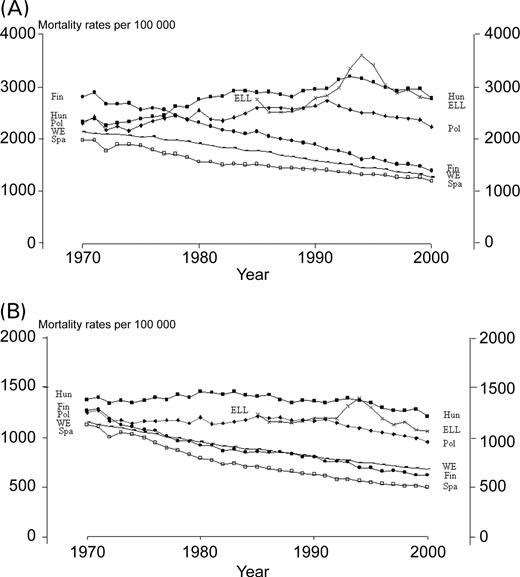
Figure 4 Time trends in all-cause mortality in 1970–2000 (A) for men aged 45–74 years and (B) for women aged 45–74 years.
Age-adjusted annual percentage changes in cardiovascular and all-cause mortality rates (100 000 per year), in persons aged 45–74 years
| Country | Gender | Period | n | IHD (P-value) | Stroke (P-value) | TCV (P-value) | All-cause mortality (P-value) |
|---|---|---|---|---|---|---|---|
| WE | M | 1970–2000 | 31 | −1.75 (<0.0001) | −2.23 (<0.0001) | −1.82 (<0.0001) | −1.34 (<0.0001) |
| W | 1970–2000 | 31 | −1.85 (<0.0001) | −2.47 (<0.0001) | −2.14 (<0.0001) | −1.39 (<0.0001) | |
| Finland | M | 1970–2000 | 31 | −2.12 (<0.0001) | −2.13 (<0.0001) | −2.13 (<0.0001) | −1.70 (<0.0001) |
| W | 1970–2000 | 31 | −2.18 (<0.0001) | −2.54 (<0.0001) | −2.48 (<0.0001) | −1.69 (<0.0001) | |
| Spain | M | 1970–2000 | 31 | −0.75 (<0.0001) | −2.61 (<0.0001) | −2.05 (<0.0001) | −1.27 (<0.0001) |
| W | 1970–2000 | 31 | −1.22 (<0.0001) | −2.97 (<0.0001) | −2.68 (<0.0001) | −1.97 (<0.0001) | |
| Poland | M | 1970–1991 | 22 | 3.61 (<0.0001) | 2.46 (<0.0001) | 1.79 (<0.0001) | 0.95 (<0.0001) |
| M | 1991–2000 | 10 | −1.71 (0.0219) | 2.10 (0.0278) | −3.22 (<0.0001) | −1.77 (<0.0001) | |
| W | 1970–1991 | 22 | 2.87 (<0.0001) | 0.75 (0.0225) | 0.56 (<0.0001) | −0.09 (0.3598) | |
| W | 1991–2000 | 10 | −0.89 (0.1934) | 1.88 (0.0213) | −3.62 (<0.0001) | −2.03 (<0.0001) | |
| M | 1970–2000 | 31 | 1.56 (<0.0001) | 2.37 (<0.0001) | 0.36 (0.0932) | 0.29 (0.0189) | |
| W | 1970–2000 | 31 | 1.73 (<0.0001) | 0.56 (0.0031) | −0.45 (0.0118) | −0.49 (<0.0001) | |
| Hungary | M | 1970–1993 | 24 | 1.47 (<0.0001) | 1.39 (0.0004) | 1.06 (<0.0001) | 1.66 (<0.0001) |
| M | 1993–2000 | 8 | −2.06 (0.0003) | −1.93 (<0.0001) | −2.11 (0.0005) | −1.60 (0.0005) | |
| W | 1970–1993 | 24 | 0.13 (0.1288) | −0.22 (0.4350) | −0.44 (<0.0001) | −0.01 (0.9606) | |
| W | 1993–2000 | 8 | −1.94 (0.0002) | −2.41 (0.0003) | −2.59 (<0.0001) | −1.71 (0.0004) | |
| M | 1970–2000 | 31 | 0.73 (<0.0001) | 0.37 (0.1404) | 0.36 (0.0211) | 1.10 (<0.0001) | |
| W | 1970–2000 | 31 | −0.05 (0.5008) | −0.84 (0.0002) | −0.77 (<0.0001) | −0.26 (0.0005) | |
| ELL | M | 1985–1994 | 10 | 3.00 (0.0127) | 1.84 (0.0341) | 3.33 (0.0086) | 4.27 (0.0027) |
| M | 1994–2000 | 7 | −5.59 (0.0017) | −4.23 (0.0003) | −4.59 (0.0023) | −3.78 (0.0045) | |
| W | 1985–1994 | 10 | 0.57 (0.3622) | 0.40 (0.4888) | 0.87 (0.2138) | 1.56 (0.0362) | |
| W | 1994–2000 | 7 | −6.07 (0.0022) | −4.87 (<0.0001) | −5.04 (0.0013) | −3.78 (0.0024) | |
| M | 1985–2000 | 16 | −0.43 (0.4943) | −0.39 (0.3991) | 0.27 (0.6592) | 1.20 (0.0660) | |
| W | 1985–2000 | 16 | −1.64 (0.0022) | −1.29 (0.0033) | −1.01 (0.0293) | −0.23 (0.5615) |
WE, Austria, Belgium, Denmark, Finland, France, Germany, Greece, Ireland, Italy, The Netherlands, Norway, Portugal, Scotland, Spain, Sweden, Switzerland, and England and Wales; M, men; W, women. All-cause peak values (men and women): Poland 1991; Hungary 1993; ELL 1994. The same peak years were used for all disease groups.
Age-adjusted annual second-degree polynomial changes with period in all-cause and cardiovascular mortality rates per 100 000 during the period 1970–2000 (ELL 1985–2000) in men and women aged 45–74 years
| Country | Cause | Gender | Intercept | B (P-value) | B2 (P-value) | R2 |
|---|---|---|---|---|---|---|
| WE | IHD | M | 513 | 0.14 (0.8600) | −0.33 (<0.0001) | 0.989 |
| W | 175 | −1.29 (<0.0001) | −0.07 (<0.0001) | 0.997 | ||
| Stroke | M | 211 | −5.79 (<0.0001) | 0.04 (<0.0001) | 0.994 | |
| W | 157 | −5.43 (<0.0001) | 0.06 (<0.0001) | 0.998 | ||
| TCV | M | 924 | −8.83 (<0.0001) | −0.29 (<0.0001) | 0.993 | |
| W | 469 | −11.06 (<0.0001) | 0.04 (<0.0001) | 0.999 | ||
| All-cause mortality | M | 2036 | −21.73 (<0.0001) | −0.20 (<0.0001) | 0.997 | |
| W | 1086 | −19.69 (<0.0001) | 0.16 (<0.0001) | 0.999 | ||
| Finland | IHD | M | 1002 | −9.53 (<0.0001) | −0.44 (<0.0001) | 0.986 |
| W | 276 | −2.76 (<0.0001) | −0.12 (<0.0001) | 0.984 | ||
| Stroke | M | 244 | −7.48 (<0.0001) | 0.08 (0.0002) | 0.973 | |
| W | 185 | −7.88 (<0.0001) | 0.12 (<0.0001) | 0.963 | ||
| TCV | M | 1484 | −25.75 (<0.0001) | −0.22 (0.0023) | 0.993 | |
| W | 631 | −20.52 (<0.0001) | 0.18 (0.0004) | 0.984 | ||
| All-cause mortality | M | 2693 | −50.52 (<0.0001) | 0.18 (0.0901) | 0.991 | |
| W | 1172 | −30.49 (<0.0001) | 0.39 (<0.0001) | 0.974 | ||
| Spain | IHD | M | 195 | 2.83 (0.0050) | −0.15 (<0.0001) | 0.716 |
| F | 63 | 0.29 (0.3270) | −0.04 (0.0004) | 0.838 | ||
| Stroke | M | 232 | −7.30 (<0.0001) | 0.05 (0.1323) | 0.955 | |
| W | 177 | −6.98 (<0.0001) | 0.07 (0.0029) | 0.971 | ||
| TCV | M | 755 | −19.58 (<0.0001) | 0.15 (0.0079) | 0.978 | |
| W | 467 | −18.47 (<0.0001) | 0.23 (<0.0001) | 0.994 | ||
| All-cause mortality | M | 1867 | −36.93 (<0.0001) | 0.47 (<0.0001) | 0.968 | |
| W | 1068 | −34.68 (<0.0001) | 0.50 (<0.0001) | 0.989 | ||
| Poland | IHD | M | 235 | 17.01 (<0.0001) | −0.41 (<0.0001) | 0.867 |
| F | 75 | 3.42 (<0.0001) | −0.07 (0.0004) | 0.836 | ||
| Stroke | M | 102 | 3.02 (0.0009) | −0.02 (0.4902) | 0.833 | |
| F | 86 | 1.34 (0.0318) | −0.03 (0.1551) | 0.317 | ||
| TCV | M | 813 | 39.34 (<0.0001) | −1.19 (<0.0001) | 0.756 | |
| F | 456 | 12.08 (<0.0001) | −0.48 (<0.0001) | 0.733 | ||
| All-cause mortality | M | 2033 | 42.67 (<0.0001) | −1.21 (<0.0001) | 0.576 | |
| F | 1107 | 5.74 (0.0643) | −0.38 (0.0004) | 0.719 | ||
| Hungary | IHD | M | 448 | 17.11 (<0.0001) | −0.45 (<0.0001) | 0.826 |
| F | 222 | 1.17 (0.0532) | −0.04 (0.0302) | 0.170 | ||
| Stroke | M | 235 | 13.41 (<0.0001) | −0.41 (<0.0001) | 0.758 | |
| F | 184 | 5.00 (<0.0001) | −0.23 (<0.0001) | 0.785 | ||
| TCV | M | 993 | 32.41 (<0.0001) | −0.95 (<0.0001) | 0.763 | |
| F | 645 | 4.34 (0.0019) | −0.32 (<0.0001) | 0.922 | ||
| All-cause mortality | M | 2043 | 65.84 (<0.0001) | −1.37 (<0.0001) | 0.882 | |
| F | 1274 | 11.63 (<0.0001) | −0.51 (<0.0001) | 0.789 | ||
| ELL | IHD | M | 766 | 44.07 (0.0181) | −3.19 (0.0094) | 0.436 |
| F | 310 | 7.60 (0.1124) | −0.88 (0.0091) | 0.710 | ||
| Stroke | M | 298 | 11.64 (0.0220) | −0.86 (0.0104) | 0.438 | |
| F | 208 | 4.32 (0.1036) | −0.48 (0.0096) | 0.691 | ||
| TCV | M | 1141 | 65.88 (0.0165) | −4.16 (0.0180) | 0.369 | |
| F | 569 | 14.35 (0.1017) | −1.37 (0.0214) | 0.539 | ||
| All-cause mortality | M | 2228 | 149.96 (0.0087) | −7.99 (0.0239) | 0.482 | |
| F | 1063 | 32.03 (0.0410) | −2.31 (0.0245) | 0.349 |
B, regression coefficient of period; R2, determination coefficient.
References
Sans S, Kesteloot H, Kromhout D on behalf of the Task Force of the European Society of Cardiology on Cardiovascular Mortality and Morbidity Statistics in Europe. The burden of cardiovascular diseases mortality in Europe.
Zatonski WA, McMichael AJ, Powles JW. Ecological study of reasons for sharp decline in mortality from ischaemic heart disease in Poland since 1991.
World Health Organization (WHO). World Health Statistics Annual, WHO, Geneva (1955–1997). Since 1998 downloadable via Internet.
WHO.
Kesteloot H. Changes in all-cause and cardiovascular mortality rates in Eastern Europe: a missed opportunity.
Kesteloot H, Sans S, Kromhout D. Evolution of all-cause and cardiovascular mortality in the age-group 75–84 y in Europe in the period 1970–1996. A comparison with worldwide changes.
Kesteloot H. Evolution of all-cause mortality rates in the United States of America, anno 1900–1999.
Andreev E, Nolte E, Shkolnikov V, Varavikova E, McKee M. The evolving pattern of avoidable mortality in Russia.
Notzon F, Komarov Y, Ermakov S, Sempos C, Marks J, Sempos E. Causes of declining life expectancy in Russia.
Hertog MGL, Kromhout D, Aravanis C, Blackburn H, Buzina R, Fidanza F, Giampaoli S, Jansen A, Menotti A, Nedeljkovic S, Pekkarinen M, Simic BS, Toshima H, Feskens EJM, Hollman PCH, Katan MB. Flavonoid intake and long-term risk of coronary heart disease and cancer in the Seven Countries Study.
Kromhout D, Bloemberg B, Feskens E, Menotti A, Nissinen A for the Seven Countries Study Group. Saturated fat, vitamin C and smoking predict long-term all cause mortality rates in the Seven Countries Study.
Chenet L, McKee M, Leon D, Shkolnikov V, Vassin S. Alcohol and cardiovascular mortality in Moscow; new evidence of a causal association.
McKee M, Shkolnikov V, Leon D. Alcohol is implicated in the fluctuations in cardiovascular disease in Russia since the 1980s.
Marmot M, Bobak M. International comparators and poverty and health in Europe.
Food and Agricultural Organisation of the United Nations. Food balance sheets Millennium Edition, Rome,
Zatonski WA, Willett W. Changes in dietary fat and declining coronary heart disease mortality in Poland: a population based study.
Puska P, Helasoja V, Prättälä R, Kasmel A, Klumbiene J. Health behaviour in Estonia, Finland and Lithuania 1994–1998. Standardized comparison.
Kriaucionieme V, Vaisvalavicius V, Petkkeviciene J. Trends in food habits and prevalence of obesity among urban and rural Lithuanian population over a period of transition. (Abstract).
Petkeviciene J, Klumbiane J. Urban–rural differences in smoking and alcohol consumption in Lithuania. (Abstract).
Vartiainen E, Puska P, Pekkanen J, Tuomilehto J, Jousilahti P. Changes in risk factors explain changes in mortality from ischaemic heart disease in Finland.
Pietinen P, Vartiainen E, Seppänen R, Aro A, Puska P. Changes in diet in Finland from 1972 to 1992: impact on coronary heart disease risk.
Unal B, Critchley JA, Capewell S. Explaining the decline in coronary heart disease mortality in England and Wales between 1981 and 2000.
Goldman L, Cook EF. The decline in ischemic heart disease mortality rates. An analysis of the comparative effects of medical interventions and changes in lifestyle.
Hunink MG, Goldman L, Tosteson AN, Mittelman MA, Goldman PA, Williams LW, Tsevat J, Weinstein MC. The recent decline in mortality from coronary heart disease 1980–1990. The effect of secular trends in risk factors and treatment.
Capewell S, Morrison CE, McMurray SS. Contribution of modern cardiovascular treatment and risk factor changes to the decline in coronary heart disease mortality in Scotland between 1975 and 1994.
Dolinszny KM, Luepker RV, Burke GL, Pryor DB, Blackburn HL. Estimated contribution of coronary artery bypass graft surgery to the decline in coronary heart disease mortality: The Minnesota Heart Survey.
Boersma H, Doornbos G, Bloemberg BPM, Wood DA, Kromhout D, Simoons ML.
Pudule I, Grimberga D, Kadzianskiene K, Abaravicius A, Vaask S, Robertson A, McKee M. Patterns of smoking in the Baltic republics.
Molarius A, Parsons R, Dobson A, Evans A, Fortman SP, Jamrozik K, Kuulasmaa K, Motchanov V, Sans S, Tuomilehto J, Puska P for the WHO MONICA Project. Trends in cigarette smoking in 36 populations from the early 1980s to the mid-1990s: findings from the WHO MONICA Project.

