


Abstract
CpG and TpA dinucleotides are underrepresented in the human genome. The CpG deficiency is due to the high mutation rate from C to T in methylated CpG's. The TpA suppression was thought to reflect a counterselection against TpA's destabilizing effect in RNA. Unexpectedly, the TpA and CpG deficiencies vary according to the G+C contents of sequences. It has been proposed that the variation in CpG suppression was correlated with a particular chromatin organization in G+C-rich isochores. Here, we present an improved model of dinucleotide evolution accounting for the overlap between successive dinucleotides. We show that an increased mutation rate from CpG to TpG or CpA induces both an apparent TpA deficiency and a correlation between CpG and TpA deficiencies and G+C content. Moreover, this model shows that the ratio of observed over expected CpG frequency underestimates the real CpG deficiency in G+C-rich sequences. The predictions of our model fit well with observed frequencies in human genomic data. This study suggests that previously published selectionist interpretations of patterns of dinucleotide frequencies should be taken with caution. Moreover, we propose new criteria to identify unmethylated CpG islands taking into account this bias in the measure of CpG depletion.
Introduction
The frequency of occurrence of dinucleotides within genomes has received much attention because some of them significantly depart their expectations with respect to base composition. Classically, these deviations are measured by the ratio of observed over expected dinucleotide frequency (XpYo/e = dXY/nX·nY, where nX denotes the frequency of nucleotide X, and dXY is the frequency of the dinucleotide XpY). It is well known that in vertebrate species the frequency of dinucleotide CpG is much (up to fivefold) lower than the product of C and G frequencies (Bird 1980 ). Although the deviation is less pronounced, the TpA dinucleotide is also significantly underrepresented in vertebrate genomes (Hanai and Wada 1988 ; Beutler et al. 1989 ; Karlin and Mràzek 1997 ). In mammals, the CpG deficiency is the consequence of a mutational bias. CpG is the target of DNA-methyltransferase activity, resulting in the methylation of cytosine. Methylated CpG's have a high mutation rate toward TpG (or CpA on the complementary strand), decreasing the CpG frequency. In the regions that escape methylation in the germ line (e.g., the promoter regions of housekeeping genes), CpG dinucleotides are less suppressed. As a consequence, these regions (the so-called “CpG islands”) appear relatively CpG-rich compared with the rest of the genome (Antequera and Bird 1999 ).
The reason for the TpA scarcity is not clearly understood. However, UpA appears to be a preferential target for ribonucleases (Beutler et al. 1989 ). Moreover, Beutler et al. (1989) noticed that TpA is more stringently excluded in DNA destined to be expressed in the cytosol (exons of protein-coding genes and tRNA and rRNA genes) than in nontranscribed Y-chromosomal DNA, DNA that is expressed only in mitochondria, and DNA that is degraded within the nucleus (intron DNA). This led the authors to propose that, by reason of their instability, there was a selective pressure against UpA dinucleotides in mRNA, tRNA, or rRNA sequences.
Unexpectedly, the deficiencies in CpG and TpA dinucleotides, measured by the ratio of observed to expected dinucleotide frequency (CpGo/e, TpAo/e), varies according to the G+C contents of human genes: CpG depletion is lower and TpA depletion higher in G+C-rich than in G+C-poor genes (Hanai and Wada 1988 ). The same trend has been observed within genes: both the G+C content and the CpGo/e ratio are higher in 5′ untranslated regions (UTRs) than in 3′ UTRs (Pesole et al. 1997 ). On a larger scale, it has been shown that CpGo/e is higher in G+C-rich parts of the genome (G+C-rich isochores) than in G+C-poor regions (Bernardi et al. 1985 ; Aissani and Bernardi 1991 ; Jabbari and Bernardi 1998 ). Interestingly, these correlations (positive and negative, respectively) between sequence CpGo/e or TpAo/e and G+C content have also been found in RNA viruses (Rima and McFerran 1997 ). However, the reason for these correlations was not established.
We propose that the observed TpA deficiency (on one hand) and the observed correlations between G+C content, CpG deficiency, and TpA deficiency (on the other hand) are essentially indirect consequences of the mutational CpG depletion. We first present an intuitive argument explaining the reasons for these effects, and we then quantify them through an improved model of dinucleotide evolution that accounts for overlaps between successive dinucleotides.
Intuitive Argument
Consider a random sequence with independent dinucleotide frequencies (i.e., no neighboring effect). Now suppose that many CpGs change to either TpG or CpA. This would increase the number of A's and T's. However, this would not change the number of TpAs and would not generate new CpGs, since new dinucleotides arising from such changes can only be NpT, TpG, CpA, and ApN (where N is A, C, G, or T). Thus, this CpG depletion has three noteworthy consequences. First, since the number of T's and A's, but not the number of TpAs, increases, the ratio TpAo/e (dTA/nT·nA) tends to decrease. Second, since the number of C's and G's has decreased, the expected number of CpGs in the new sequence is smaller than the number of CpGs in the original sequence. Therefore, the CpGo/e ratio underestimates the real CpG depletion. Finally, both effects are enhanced when the G+C content is high: the relative increase in A and T frequencies induced by CpG depletion is higher, resulting in an increased TpA deficiency and a decrease in the expected number of CpGs.
To give an idea of the impact of CpG mutations, we calculated the G+C content and the observed over expected dinucleotide frequencies in a random sequence where 67% of CpG's would have been changed to TpG or CpA. We calculated these values for G+C contents (before CpG mutations) of 40% and 60%. As shown in table 1 , in both cases, CpG depletion induces an apparent TpA deficiency. The CpGo/e ratio is higher than the ratio of final/initial CpG frequencies (0.33). Thus, the CpGo/e ratio underestimates the real mutation pressure on CpG dinucleotides. Finally, the CpGo/e and TpAo/e ratios are, respectively, higher and lower in the G+C-rich than in the G+C-poor sequence, in agreement with observations from the human genome.
A Model of Dinucleotide Evolution
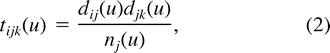
The above approach is obviously simplistic because it does not take into account the dynamics of the mutation process. Therefore, we developed a model to simulate the evolution of dinucleotide content in a sequence where CpG dinucleotides are under mutation pressure toward TpG or CpA. Nucleotide evolution is usually modeled as a four-state Markov chain, where each change from one state to another is assigned a rate in continuous time (e.g., see Yang 1995 ). Sved and Bird (1990) applied this approach to dinucleotides using a 16-state Markov chain. Their model, however, did not account for the overlap between successive dinucleotides. The overlap induces dependencies among dinucleotide frequencies that have important effects. A consequence of neglecting the overlap is that the sum of the equilibrium frequencies of, say, ApN dinucleotides is different from the sum of the equilibrium frequencies of NpAs in Sved and Bird's (1990) study (their table 2 ), while both should be equal to the frequency of A.
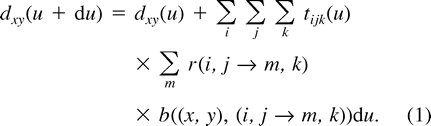
Equation (1) written for all possible (x, y) forms a system of 16 differential equations that describe the instantaneous dynamics of dinucleotide frequencies under our model. This system can hardly be solved analytically—in contrast to the analogous system in models describing nucleotide evolution—essentially because the expression of tijk includes products between dij's, making it nonlinear. However, equation (1) allows one to quickly simulate the evolution of dinucleotides and to deduce equilibrium frequencies given 𝛉, κ, and κ1. The simulation process is the following:
Start from dinucleotide frequencies D(0).
Deduce nucleotide N(0) and trinucleotide T(0) frequencies.
Compute D(du) for some arbitrary small du using equation (1) .
Deduce N(du) and T(du) and iterate until equilibrium is achieved.
Results
We made use of this process to compare the predictions of our model with human DNA sequence data. G+C content is variable across the human genome according to the so-called “isochore structure” (Bernardi et al. 1985 ). In contrast, there is no evidence that transition/transversion ratios within or outside CpG doublets vary in distinct parts of the genome. Therefore, we used fixed values for parameters κ and κ1 but allowed 𝛉 to vary. Estimates for κ (2.1) and κ1 (27.6) were obtained from a study of hemophilia B polymorphism in the United Kingdom (Giannelli, Anagnostopoulos, and Green 1999 ) and were largely concordant with the data of Cargill et al. (1999) and Halushka et al. (1999) .
Figure 1 displays the relationship between CpG and TpA depletion (observed/expected frequencies) and G+C content in 3,073 human DNA sequences longer than 100 kb. Sequences were retrieved from GenBank release 115 (December 15, 1999) using the ACNUC database (Gouy et al. 1985 ). As previously reported with smaller data sets, a significant correlation between CpGo/e and G+C content was found: CpG deficiency was lower in G+C-rich regions. A moderate TpA deficiency also appeared, correlated with G+C content as well (but negatively). The regression lines are shown.
We simulated the evolution of dinucleotide frequencies until equilibrium was achieved using the empirical estimates for κ and κ1 indicated above and various 𝛉 values. The relationship between the predicted equilibrium G+C content and equilibrium CpG and TpA deficiencies under the model assumptions are shown in figure 1 (open circles). Figure 1a shows a very good fit between CpG frequencies in observed and simulated sequences. Note that we did not even try to fit the parameters to the data: we used empirical estimates of mutational rates. This suggests that this model correctly represents CpG evolution. In particular, the correlation between CpG depletion and G+C content is predicted by the model.
Interestingly, our model also predicts some TpA deficiency at equilibrium, although no specific mutational mechanism has been assumed with respect to TpA dinucleotides. Moreover, in agreement with the observation on real sequences, our model predicts a negative correlation between TpAo/e and G+C content (fig. 1b ). Note that the slope of the correlation is the same in real and in simulated sequences. Thus, variations of the TpAo/e ratio according to the G+C content are probably simply a direct consequence of CpG depletion. Using a related approach but a different model, Bulmer (1986) did not predict any TpA deficiency. One should note, however, that the TpAo/e ratio is lower in real sequences than expected according to our model. Thus, other factors contribute to the deficiency of TpA in human sequences.
In summary, these simulations confirm the qualitative predictions of the simplistic example presented in table 1 . In agreement with real data, our model predicts that: (1) an increased mutation rate from CpG to TpG and CpA induces an apparent depletion in TpA, (2) this apparent TpA depletion increases with G+C content, and (3) the CpGo/e ratio underestimates the real mutation pressure on CpG dinucleotides, all the more as the sequence is G+C-rich; as a consequence, (4) CpGo/e and TpAo/e are correlated (positively and negatively, respectively) to G+C content.
Discussion
Our model has several implications regarding the biological significance of the variations of the CpGo/e and TpAo/e ratios along the genome. First, since the CpG deficiency is related to the level of methylation, and since the level of methylation is correlated with chromatin organization and gene expression, it has been proposed that the positive correlation between CpGo/e and G+C might reflect a particular chromatin organization associated with transcriptionally active DNA or some differences in the regulation of gene expression in G+C-rich compared with G+C-poor isochores (Bernardi et al. 1985 ; Aissani and Bernardi 1991 ; Jabbari and Bernardi 1998 ). However, the fit between our simulations and the data observed on real sequences suggests that this correlation is simply due to the fact that the ratio CpGo/e underestimates the deficiency in CpG dinucleotides in G+C-rich regions. Therefore, there is no evidence for variation in the rate of CpG hypermutation with respect to the isochore G+C content, and the apparent reduced CpG deficiency in G+C-rich isochores is simply a mathematical artifact.
This formula is consistent with the standard definition of CpG islands when the G+C content equals 50%, and it accounts for the CpG/GC relationship when the G+C content is different from 50%.
Third, Beutler et al. (1989) have noted that the TpAo/e ratio is lower in exons of protein-coding genes and tRNA and rRNA genes than in Y-chromosomal DNA, mitochondrial DNA, and introns. They also have shown that UpA has a destabilizing effect on RNAs. This led them to propose that a selective pressure against TpA is acting in DNA sequences destined to be expressed in the cytosol. However, it should be noted that protein-coding regions and tRNA or rRNA genes are characterized by a relatively high G+C content (on average, 55%–60%) compared with the other sequences they analyzed (less than 49% in introns, 44% in mitochondria, and 39% in chromosome Y genomic sequences). According to our model, these differences in G+C content could explain the differences in TpAo/e. To directly test the selectionist hypothesis proposed by Beutler et al. (1989) , we compared the TpAo/e ratios in coding regions, introns, and 3′ UTRs of human genes. Coding regions and 3′ UTRs are part of the mRNA (and hence are destined to be expressed in the cytosol), whereas introns are not. Therefore, according to the selectionist hypothesis, TpAo/e should be lower in coding regions and 3′ UTRs than in introns. On the other hand, coding regions are relatively G+C-rich compared with introns and 3′ UTRs. Therefore, according to our model, TpAo/e should be lower in coding regions than in 3′ UTRs and introns. As shown in table 2 , the data fit with our model and not with the selectionist hypothesis.
Since human genomic DNA is essentially nontranscribed, another prediction of the selectionist hypothesis is that TpAo/e should be lower in 3′ UTRs and introns than in genomic sequences. On the contrary, we found that the average TpAo/e ratios in 3′ UTRs (0.64 ± 0.20) and introns (0.68 ± 0.13) were very close to those of large (>100 kb) genomic sequences of similar base composition (0.67 and 0.66, respectively, calculated according to the regression slope presented in fig. 1 ).
Therefore, contrary to what has been proposed (Beutler et al. 1989 ) there is no evidence that TpA dinucleotides are more counterselected in exons than in introns or in transcribed than in nontranscribed DNA. As shown with our model, CpG depletion induces an apparent TpA depletion that depends on the G+C content of sequences. The differences in the TpAo/e ratios between the different sequences analyzed by Beutler et al. (1989) are merely a consequence of their differences in G+C content. However, as mentioned previously, the CpG depletion does not totally explain the observed TpA deficiency in the human genome. Karlin and Mràzek (1997) proposed that the deficiency in TpA might be due to its low thermodynamic stacking energy in DNA. They also suggested that because of the presence of TpA as part of many regulatory signals (e.g., TATA box, polyadenylation signal), TpA suppression might help to avoid inappropriate binding of regulatory factors. Although these are useful working hypotheses, they are still speculative, and the reason for the TpA depletion remains to be determined.
Edward Holmes, Reviewing Editor
Keywords: dinucleotides CpG TpA CpG islands methylation isochores
Address for correspondence and reprints: Laurent Duret, Laboratoire de Biométrie, Génétique et Biologie des Populations, UMR CNRS 5558, Université Claude Bernard, 43 Boulevard du 11 Novembre 1918, 69622 Villeurbanne cedex, France. E-mail: duret@biomserv.univ-lyon1.fr.
Table 1 Impact of CpG Mutations on Base Composition and Dinucleotide Deficiency (observed/expected frequency) in a G+C-Poor and a G+C-Rich Sequence
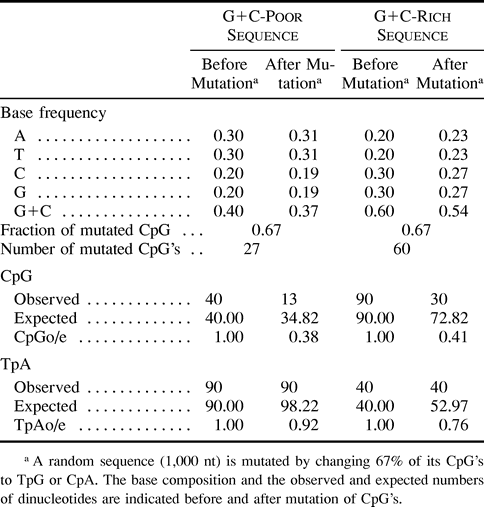
Table 1 Impact of CpG Mutations on Base Composition and Dinucleotide Deficiency (observed/expected frequency) in a G+C-Poor and a G+C-Rich Sequence
Table 2 Base Composition and Dinucleotide Deficiency (observed/expected frequency) in Coding and Noncoding Regions of Human Genes
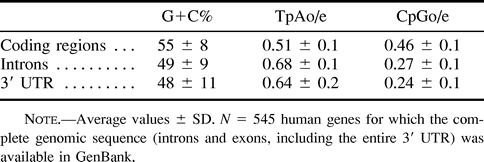
Table 2 Base Composition and Dinucleotide Deficiency (observed/expected frequency) in Coding and Noncoding Regions of Human Genes
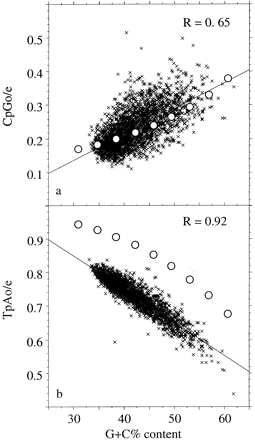
Fig. 1.—Correlation between G+C content and the ratio of observed/expected TpA and CpG dinucleotide frequencies in the human genome. Observed frequencies are in 3,073 genomic sequences longer than 100 kb. Solid lines represent linear regression, and open circles represent frequencies predicted according to the model
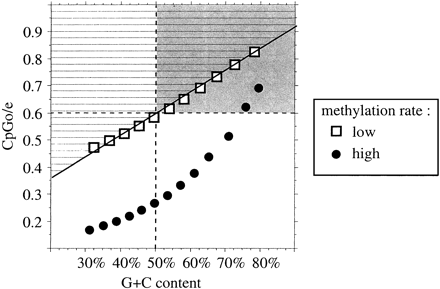
Fig. 2.—Correlation between G+C content and the observed/expected CpG dinucleotide ratio predicted by our model for different rates of CpG methylation: a high rate (κ1 = 27.6, circles) and a low rate (κ1 = 8.0, squares). The regression line for the low rate of methylation is indicated (R2 = 0.997). The area above the regression line (hatched) corresponds to undermethylated sequences. The gray rectangle corresponds to sequences that would be predicted to be unmethylated CpG islands according to the criteria classically used in the literature (Gardiner-Garden and Frommer 1987 )
We thank two anonymous referees for their helpful comments. This work was supported by the Centre National de la Recherche Scientifique.
literature cited
Aissani, B., and G. Bernardi.
Antequera, F., and A. Bird.
Bernardi, G., B. Olofsson, J. Filipski, M. Zerial, J. Salinas, G. Cuny, M. Meunier-Rotival, and F. Rodier.
Beutler, E., T. Gelbart, J. H. Han, J. A. Koziol, and B. Beutler.
Bird, A. P.
Bulmer, M.
Cargill, M., D. Atshuler, J. Ireland et al. (17 co-authors).
Cross, S., P. Kovarik, J. Schmidtke, and A. Bird.
Gardiner-Garden, M., and M. Frommer.
Giannelli, F., T. Anagnostopoulos, and P. M. Green.
Gouy, M., C. Gautier, M. Attimonelli, C. Lanave, and G. Di Paola.
Halushka, M. K., J.-B. Fan, K. Bentley, L. Hsie, N. Shen, A. Weder, R. Cooper, R. Lipshutz, and A. Chakravarti.
Hanai, R., and A. Wada.
Jabbari, K., and G. Bernardi.
Karlin, S., and J. Mràzek.
Pesole, G., S. Luini, G. Grillo, and C. Saccone.
Rima, B. K., and N. V. McFerran.
Sved, J., and A. Bird.
Tamura, K.
