


Introduction
Since the beginning of maintenance therapy for end-stage renal disease (ESRD) through dialysis or transplantation, the number of patients treated for terminal kidney failure worldwide has continued to grow at a rate that is far in excess of the growth rate of the general population. By 2001, more than 1 million patients were reported worldwide to receive dialysis treatment alone, with the numbers growing at an annual global average rate of 7% [1,2]. The main factors contributing to the continued growth are the universal ageing of populations, multi-morbidity, higher life-expectancy of treated ESRD patients and increasing access of a generally younger patient population to treatment in countries in which access had previously been limited [3–6]. Solutions targeting the prevention or reversal of renal disease receive widespread attention, but have as yet failed to significantly change the development of global patient numbers. A superior and financially viable alternative to dialysis or allograft transplantation for chronic renal failure is not foreseen for the near or even mid-term future [6–9].
In order to facilitate effective future planning by healthcare authorities, reliable and up-to-date information on ESRD patient numbers, development trends, treatment modalities and treatment outcomes are indispensable. An increasing number of national and international renal registries have provided valuable demographic and epidemiologic information on renal patients since the first report of the European Dialysis and Transplant Association (EDTA) was published in 1965 [6,10–17]. These reports provide a base for comparison between specified patient populations and an understanding of treatment practices and policies and their implications for the well-being of those undergoing treatment for ESRD. The conclusions that can be drawn from such considerations provide knowledge of value to both medical communities and policy makers throughout the world.
Even at a national level, data collection and analysis requires extensive resources to enable fast and reliable reporting of the most recent numbers. The collection of records reflecting the situation in a large group of countries presents additional challenges that render timely reporting a difficult target to achieve. A multi-country European database is organized by the ERA/EDTA, and now consolidates renal replacement information from different renal registries collecting patient data of 27 countries [16]. An alternative approach to reporting international ESRD-relevant data is pursued in the Dialysis Outcomes and Practice Patterns Study (DOPPS). This was initiated in 2002 as an observational study and presently collects information on haemodialysis (HD) practice patterns and their associated outcomes from 12 countries in Europe, North America and Asia [15]. Fresenius Medical Care, the largest dialysis care company worldwide, follows two different and separate approaches, one addressing practice patterns and outcomes in its clinics (e.g. the European Clinical Database, EuClid), and the other using its extensive international network for retrieving and comparing reliable and contemporary ESRD demographic information from 122 countries [2,18]. This article supplies an extract of the latter for use and reference by renal care specialists and healthcare administrative bodies. In addition, trends observed in association with patient demographic data are specified and discussed.
Methods
Details pertaining to the treatment of patients with ESRD were collected for 122 countries that have established dialysis programmes and to which the Fresenius Medical Care international dialysis network has insight. The individual countries are listed in Table 1. With a combined population of 5.9 billion, these countries represent 92% of the total world population. For practical reasons, some widely accepted special administrative areas or regions of special sovereignty are also termed countries throughout this article.
Countries included in the survey
| Albania | Dominican Republic | Kyrgyzstan | Russia |
| Algeria | Ecuador | Latvia | Saudi Arabia |
| Argentina | Egypt | Lebanon | Senegal |
| Armenia | El Salvador | Libya | Serbia and Montenegro |
| Australia | Estonia | Lithuania | Singapore |
| Austria | Finland | Luxembourg | Slovakia |
| Azerbaijan | F Y R of Macedonia | Malaysia | Slovenia |
| Bahrain | France | Mali | South Africa |
| Bangladesh | Gabon | Malta | South Korea |
| Belarus | Georgia | Mauritania | Spain |
| Belgium | Germany | Mauritius | Sri Lanka |
| Benin | Ghana | Mexico | Sudan |
| Bosnia and Herzegovina | |||
| – Federation | Greece | Moldova | Sweden |
| – Republika Sprska | Guatemala | Morocco | Switzerland |
| Brazil | Honduras | Myanmar | Syria |
| Brunei | Hong Kong | Nepal | Taiwan |
| Bulgaria | Hungary | Netherlands | Thailand |
| Cameroon | Iceland | New Zealand | Togo |
| Canada | India | Nicaragua | Trinidad and Tobago |
| Chile | Indonesia | Nigeria | Tunisia |
| China | Iran | Norway | Turkey |
| Colombia | Iraq | Oman | Turkmenistan |
| Costa Rica | Ireland | Pakistan | Ukraine |
| Cote d’Ivoire | Israel | Panama | United Arab Emirates |
| Croatia | Italy | Paraguay | United Kingdom |
| Cuba | Japan | Peru | United States of America |
| Cyprus | Jordan | Philippines | Uruguay |
| Czech Republic | Kazakhstan | Poland | Uzbekistan |
| Denmark | Kenya | Portugal | Venezuela |
| Kuwait | Qatar | Vietnam | |
| Romania | Yemen |
The country-by-country surveys performed at the end of each calendar year focus on the total number of patients treated for ESRD, the treatment modality selected, products used, treatment location and ESRD patient care structure and funding. The survey has been refined over the years to facilitate access to more detailed information and to reflect changes in the development of therapies and products. Its modular design allows the information from all countries to be consolidated and compiled in one central database.
The questionnaires are prepared in English and, in some cases, the relevant local language, and are distributed to professionals in the field of dialysis who are in a position to insert ESRD-relevant country-specific information themselves or who can coordinate appropriate input from knowledgeable contacts in each country. Country demographic and economic data are extracted from publicly available and internationally recognized sources [19,20] and inserted in the forms before distribution. All countries are asked to return the completed survey forms with information pertaining to the year surveyed by 31 January of the following year, i.e. the surveys with information relating to 2004 were returned within the first few weeks of 2005. The surveys are subsequently centrally validated by means of cross-reference with the most recent sources of national ESRD information (e.g. registry data) and with the results of earlier surveys performed over the previous years. In addition, replies are subjected to a validation process, in which input fields with related information are linked and checked for consistency. All information received is consolidated at different regional levels within the database and validation checks are repeated for groups of countries (e.g. the European Union, Latin America etc.).
In this article, focus is primarily on treated ESRD patients at year-end 2004 and, in particular, on ESRD patients receiving dialysis treatment. Detailed results are therefore presented for the total population treated for ESRD, the subset of dialysis patients (i.e. HD and peritoneal dialysis (PD) patients together) and then the smaller subsets of HD and PD patients separately. Prevalence values for ESRD, transplant, dialysis, HD and PD patients were calculated using the reported number of patients treated in a country at year-end divided by the country population to yield values per million population (p.m.p.). All transplant numbers refer to patients living with a functioning renal allograft at year-end. All growth rates, unless otherwise indicated, refer to the annual growth from year-end 2003 to year-end 2004. Numbers presented here are rounded in a consistent and common sense manner in order to support portrayal of relative and absolute magnitudes. Data for the European Union refer to the status as of May 2004, i.e. 25 countries.
Results
Treated ESRD, dialysis and transplant patients
At the end of 2004, some 1 783 000 people worldwide were undergoing treatment for ESRD; 1 371 000 (i.e. 77%) were on dialysis treatment and 412 000 (i.e. 23%) were living with a functioning renal transplant. Table 2 provides an overview of these numbers for both the global situation and the various geographic regions of the world. The numbers reveal that a rough 70/30% split of treated ESRD patients in dialysis/transplant patients is more or less typical for the regions North America, Europe and the Middle East, while an even higher proportion of treated ESRD patients are on dialysis treatment than living with a functioning transplant in Asia, Latin America and Africa. Table 2 also shows that approximately half of all dialysis patients reside in North America and Europe, and as much as 74% of all patients living with a transplant are located in these two regions. Within Europe, over 80% of all treated ESRD patients reside in the 25 countries of the European Union. Results for Japan are separated from the remainder of Asia due to the significant differences in the patient care infrastructure: while higher numbers of dialysis patients reside in Japan compared with all other Asian countries together, the number of patients living with a functioning transplanted kidney in Japan is only around one-third of that for the rest of Asia. Compared with year-end 2003, the total numbers of treated ESRD patients, dialysis patients and transplant patients each increased by between 6 and 7%.
Global and regional overview of ESRD, dialysis and transplant patient numbers and prevalence values per million population at year-end 2004 (numbers rounded)
| Patient numbers | Prevalence values (p.m.p.) | |||||||||
|---|---|---|---|---|---|---|---|---|---|---|
| ESRD | Dialysis (HD + PD) | Transplant | ESRD | Dialysis (HD + PD) | Transplant | |||||
| 1 783 000 | 1 371 000 | 412 000 | Global | 280 | 215 | 65 | ||||
| 492 000 | 337 000 | 154 000 | North America | 1505 | 1030 | 470 | ||||
| 473 000 | 324 000 | 149 000 | Europe | 585 | 400 | 185 | ||||
| (387 000) | (252 000) | (135 000) | (thereof EU) | (850) | (550) | (295) | ||||
| 261 000 | 248 000 | 13 000 | Japan | 2045 | 1945 | 100 | ||||
| 237 000 | 196 000 | 41 000 | Asia (excluding Japan) | 70 | 60 | 10 | ||||
| 205 000 | 170 000 | 35 000 | Latin America | 380 | 320 | 65 | ||||
| 61 000 | 57 000 | 5000 | Africa | 70 | 65 | 5 | ||||
| 54 000 | 39 000 | 15 000 | Middle East | 190 | 140 | 55 | ||||
The resulting global average prevalence values for treated ESRD, dialysis and transplant patients p.m.p. were 280, 215 and 65, respectively. The prevalence values (also Table 2) demonstrate significant variation between the designated regions. Notably, the average prevalence of both treated ESRD and dialysis in the European Union was lower than in North America and Japan. In addition, considerable intra-regional variations were reported.
Regarding treated ESRD patients (i.e. dialysis and transplant patients together), individual country prevalence values ranged from less than 10 p.m.p. (observed in 11 countries) to more than 1000 p.m.p. (observed in 9 countries). ESRD prevalence values exceeding 1500 p.m.p. were reported for the two countries with the largest treated ESRD populations – the USA and Japan. Within Europe, the countries with the highest ESRD prevalence were Portugal, Germany, Cyprus, Spain and Italy (between 1000 and 1160 p.m.p.). In Latin America, the highest ESRD prevalence values reported were in the 610–860 p.m.p. range and referred to the countries Chile, Uruguay and Argentina.
In the case of transplant patients, 65% of the countries reported a prevalence lower than 100 p.m.p. and only 16% of the countries reported a prevalence of patients with a functioning graft higher than 300 p.m.p. The five countries with the highest transplant prevalence values were Cyprus, Spain, Norway, the USA and Ireland.
The prevalence of dialysis in individual countries ranked according to size of their dialysis patient population is shown in Table 3. This analysis revealed that at the end of 2004, 52% of the global dialysis population was treated in just four countries: the USA, Japan, Brazil and Germany – although these four countries accounted for only around 11% of the world population. Mainland China, due to its around 48 000 dialysis patients (albeit very low dialysis prevalence) took up fifth position; inclusion of the special administrative region of Hong Kong and Taiwan would move Greater China, with a dialysis population of over 91 000, up to third place in this list. The next 10 countries ranked by size of their dialysis population accounted for 23% of the global dialysis population. The remaining 23% of global dialysis patients were treated in more than 100 different countries representing 52% of the world population.
Regional concentration of dialysis patients as of year-end 2004 compared with the general population. Countries are ordered according to decreasing dialysis patient populations (numbers rounded)
| Country | Number of dialysis patients | Percentage of global dialysis patients (%) | General population (millions) | Percentage of world population (%) | Dialysis prevalence (p.m.p.) |
|---|---|---|---|---|---|
| USA | 320 000 | 24 | 294 | 5 | 1090 |
| Japan | 248 000 | 18 | 128 | 2 | 1940 |
| Brazil | 68 000 | 5 | 185 | 3 | 370 |
| Germany | 66 000 | 5 | 82 | 1 | 800 |
| China | 48 000 | 3 | 1300 | 20 | 40 |
| Survey countries 6–15 together | 311 000 | 23 | 585 | 9 | 530 |
| Survey countries 16–122 together | 310 000 | 23 | 3340 | 52 | 90 |
| Other countries | 0 | 0 | 495 | 8 | 0 |
| All countries | 1 371 000 | 100 | 6409 | 100 | 215 |
Haemodialysis and peritoneal dialysis patients and selected treatment-related factors
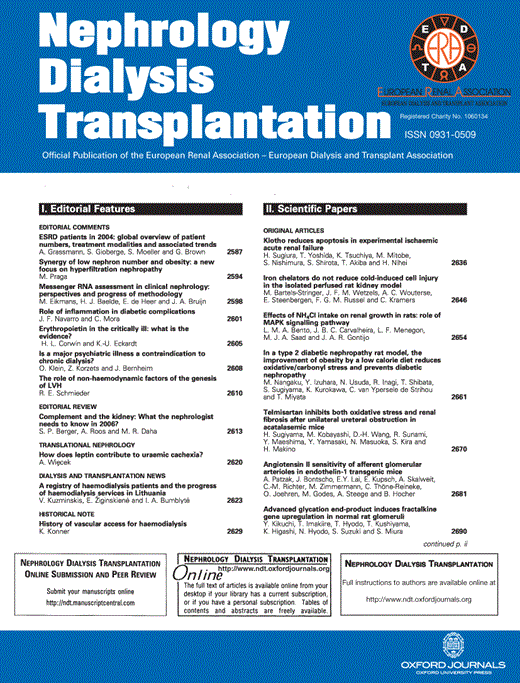
Analysis of the type of treatment received by dialysis patients revealed that HD remains the most common treatment modality in all regions of the world (Table 4). Of the 1 371 000 dialysis patients worldwide at the end of 2004, 89% (i.e. 1 222 000) were treated by HD and 11% (i.e. 149 000) were undergoing PD treatment. In none of the geographical regions considered did the prevalence of PD come even close to that of HD. However, examination of the 15 countries with the largest dialysis patient populations reveals that this global average distribution of patients between HD and PD was not reflected in all countries (Figure 1). Compared with the 11% global average, countries such as the Republic of Korea, Mexico and the UK had a significantly higher proportion of PD patients, and countries such as Japan and Germany had a lower proportion of PD patients. With the exception of Mexico, HD was the predominant treatment modality in each of the 15 major countries. In 111 of the 122 countries surveyed, the percentage of dialysis patients on HD exceeded 66%. Compared with 2003, global numbers of both HD and PD patients increased by approximately 6%.
Comparison of HD and PD patient numbers in the 15 countries with the highest dialysis patient populations.
Global and regional overview of haemodialysis (HD) and peritoneal dialysis (PD) patient numbers and prevalence values per million population at year-end 2004 (numbers rounded)
| Patient numbers | Prevalence values (p.m.p.) | |||||
|---|---|---|---|---|---|---|
| HD | PD | HD | PD | |||
| 1 222 000 | 149 000 | Global | 190 | 25 | ||
| 306 000 | 31 000 | North America | 940 | 95 | ||
| 291000 | 33 000 | Europe | 360 | 40 | ||
| (227 000) | (25 000) | (thereof EU) | (500) | (55) | ||
| 238 000 | 10 000 | Japan | 1865 | 80 | ||
| 166 000 | 30 000 | Asia (excluding Japan) | 50 | 10 | ||
| 129 000 | 41 000 | Latin America | 240 | 75 | ||
| 55 000 | 2000 | Africa | 65 | <5 | ||
| 37 000 | 2000 | Middle East | 130 | 10 | ||
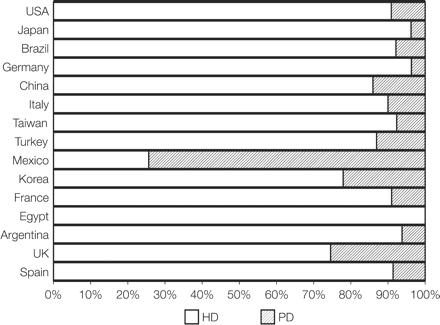
The data provided in Table 4 reveal that 68% of the global HD patients, but only 50% of the global PD patients, reside in the three regions North America, Europe and Japan. Considerations concerning deciding factors for a particular dialysis treatment modality make a comparison between economically mature areas treating very large patient populations and other areas an interesting exercise. Figure 2 is a graphical presentation of the global distributions of HD and PD patients between the USA, Japan, the EU (each of which has a mature economy and treats in excess of 240 000 dialysis patients a year) and all other countries together. It clearly demonstrates that, while 38% of all HD patients are treated in regions ‘Other’, as much as 58% of all PD patients reside in countries outside of the USA, the EU and Japan.
Global distributions of HD and PD patients at year-end 2004.
In the USA, the EU and Japan, the HD population increased by between 3 and 4% compared with year-end 2003, while the corresponding growth in the regions ‘Other’ was significantly higher at around 10%. The majority of HD patients worldwide underwent in-centre dialysis treatment. At year-end 2004, HD patients were treated in approximately 22 700 centres worldwide with an average of 54 patients per centre. Globally, around 0.4% of all HD patients (5200 patients) were performing HD in the home environment. The proportion of HD patients that are home HD patients is higher than the global average in some countries, particularly New Zealand, Australia, Finland, the UK and Sweden. The three countries with the largest populations of home HD patients are the USA, Australia and France, which together account for around 57% of all home HD patients worldwide. At year-end 2004, nearly 96% of the worldwide HD patient population were undergoing HD treatment, while around 4% (43 000 patients) were receiving haemofiltration or haemodiafiltration (HF/HDF) treatments. Despite the low global presence of HF/HDF, a regional analysis revealed that the proportion of HD patients undergoing HF/HDF treatment in the EU and Japan was as much as 10% and 5%, respectively.
The practice of dialyser reuse is another interesting field of analysis. Within the EU, only around 5% of HD patients are treated with reprocessed dialysers. This number is significantly influenced by Poland, which is the only country in the EU in which dialyser reprocessing is still widespread (around 80% of HD patients). Excluding Poland, only around 1% of all HD patients in the EU are treated with reprocessed dialysers. Dialysers are not reused in Japan, but a high penetration of dialyser multiple-use was indicated for individual countries in Asia, Latin America, the Middle East and Africa. In the USA, the percentage of HD patients treated with reused dialysers decreased from 65% in the year 2000 to 42% at year-end 2004. In general, data reported from the countries indicate a decreasing trend in this practice.
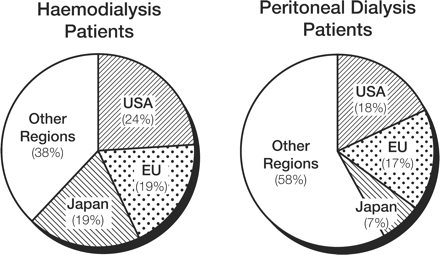
A number of previously identified HD treatment related trends were supported by the data reported in 2004 and the previous year. Figure 3 shows 2003–2004 changes in the use of dialysers as characterized by membrane material and permeability. The trend towards the use of dialysers containing synthetic and high-flux membranes was evident in all regions of the world. Globally, 68% of all dialysers used in 2004 contained a synthetic membrane while approximately 61% contained a high-flux membrane. 88% of dialysers used in the USA contained a synthetic membrane, and 93% included a high-flux membrane. In the EU, more focus is placed on the use of a synthetic membrane than on permeability, so that while 83% of dialysers were made of a synthetic membrane, only 44% of the dialysers used were high-flux. The opposite is true in Japan, where 96% of dialysers were high-flux and 53% were synthetic. Outside the USA, Japan and the EU, the increase in the use of dialysers containing synthetic and high-flux membranes was even higher than the respective global average increases of 16 and 14%. Notably, the global number of cellulose-based dialysers used fell by as much as 12% since year-end 2003, while 6% less low-flux dialysers were utilized.
2003–2004 changes in global dialyser numbers according to membrane material and permeability.
The regional average PD growth rates between 2003 and 2004 showed a pattern similar to that of HD growth, in that higher growth rates were observed outside the regions USA, Japan and the EU than within these. PD number changes in the USA, Japan and the EU were insignificant and in sharp contrast to a PD growth rate of around 11% in the collective region ‘Other’. The global average growth in PD of 6% between 2003 and 2004 was driven by automated peritoneal dialysis (APD) modalities: in this time period, the number of PD patients treated by APD increased by approximately 10%, whereby the number of patients treated by continuous ambulatory peritoneal dialysis (CAPD) grew by only around 4%. At year-end 2004, as much as 30% of PD patients globally were on APD treatment. Again, strong variations in the allocation of patients to either CAPD or APD were evident on a regional or country level, with over 50% of PD patients undergoing APD in some countries in 2004, the level being even as high as 62% in the USA. In Mexico, the UK and Korea (i.e. the countries with the highest number of PD patients compared with HD patients), 21, 32 and 5% of total PD patients, respectively, were treated by APD in 2004.
Discussion
This article provides a comprehensive overview of treated ESRD patient numbers for the year 2004, both globally and for various geographical regions. Corresponding numbers are supplied for the various ESRD treatment modalities, i.e. patients living with a functioning graft, HD patients and patients treated by PD. The global and regional picture is supplemented with information on treatment-related subjects and emerging trends, with particular emphasis on HD- and PD- specific issues such as relative numbers, place of treatment, dialyser membrane characteristics, the practice of dialyser reuse and the acceptance of the special therapy approaches HDF/HF and APD. Some individual country data are reported, but only in cases of a specific influence on global or regional average values or in order to demonstrate the potential for variability at a country level.
An extensive validation process was an integral part of the data collection and analysis procedure, as described already. This process ensured that the numbers presented here are consistent with a host of other information supplied by the individual countries concerning treatment of dialysis patients. No publicly available sources of numbers of treated ESRD patients in 2004 could be identified at the time of data analysis, so a direct comparison of 2004 data with statistics from registries was not possible. In order to facilitate a validation, the most recent data available from recognized sources was compared with survey data retrieved for the same year. Such comparisons of patient numbers revealed a deviation of <5% for the majority of countries.
The 122 countries surveyed for this report account for 92% of the 2004 world population and around 99% of all treated ESRD patients. As such, the numbers presented here can be accepted as providing a true global overview, in addition to being the most comprehensive and current available to date. The survey reveals that, worldwide, almost 1.8 million people were treated for ESRD at the end of 2004 and around 1.4 million thereof were on some form of dialysis treatment. These numbers are 20% higher than those already reported in the equivalent survey performed for the year 2001 [2] and represent an annual growth of ∼6% compared with the year 2003. It is of particular significance that the average global increase of ∼6% in the number of ESRD, HD and PD patients reported here was not representative of the growth observed in individual countries or geographical regions. Lower than average growth rates in both HD and PD were observed in the USA, the EU and Japan, while significantly higher than average growth rates were observed in the group of all other countries. In general, and in comparison with global average values, countries that reported high growth rates also reported a significantly lower prevalence of dialysis, demonstrated a higher acceptance of PD and tended to be economically weaker.
Based on an extrapolation of the 2004 patient numbers with the respective 2003–2004 growth rates, one can expect the number of dialysis patients to approach 2 million by the year 2010. Furthermore, according to these calculations and taking the different regional growth rates into consideration, there will be a significant change in the regional distribution of patients, with around 50% of all dialysis patients in 2010 being treated in countries outside the USA, the EU and Japan, as opposed to around 40% at year-end 2004. It should be noted, however, that such prognoses are sensitive to a host of influencing factors that can affect considerable changes in future patient numbers and regional distributions. The wide variation between countries in the 2004 dialysis prevalence values reported (ranging from under 20 p.m.p. in some countries in Latin America, the Middle East, Asia and Africa to almost 2000 p.m.p. in Japan) and in the 2003–2004 dialysis growth rates observed exemplifies the differences between individual countries and the potential for developments outside the given forecast.
It is well accepted that the age structure and co-morbidity of a given population as well as dialysis treatment practices and outcomes influence both the incidence of renal disease and the development of the ESRD population. Developing countries, in particular, are generally characterized by a lower age of the general population and, in addition, the average age of a patient commencing dialysis is considerably lower there than in developed countries. A comparison of national economic strength, expressed as gross domestic product (GDP), with prevalence of ESRD suggests that economic factors impose restrictions to treatment in countries in which the GDP per capita is below a limiting value: in 47 of the 75 countries with the largest ESRD populations, the GDP per capita per annum is under US$10 000 and a significant correlation between GDP and ESRD prevalence is indicated (Figure 4). The absence of a clear correlation in the 28 countries in Figure 4 with a GDP above US$10 000 suggests that, following attainment of a certain economic wealth, factors other than economy dominate in determining incidence and prevalence of ESRD. Approaches that enable establishment of ESRD treatment programmes in countries with restrictive economic resources and generally younger patient populations may result in future patient numbers significantly in excess of those derived on the basis of currently reported growth rates.
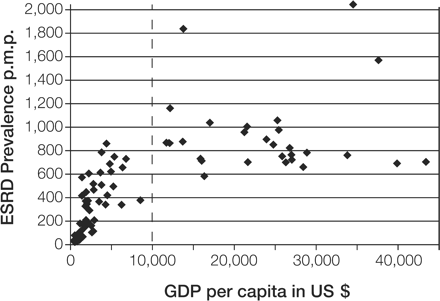
Prevalence of ESRD in 2004 versus economic welfare in the 75 countries with the largest ESRD patient populations.
Two significant HD-related trends could be clearly supported by particularly large changes in 2003 to 2004 numbers. One is the tendency towards the use of dialysers containing membranes made of a synthetic material (up 16% compared with 2003) rather than cellulose-based membranes (down 12% compared with 2003). Another is the increased preference for high-flux dialysers (up 14% compared with 2003) at the expense of low-flux dialysers (down 6% compared with 2003). Most high-flux membranes are made from a synthetic polymer (e.g. polysulfone, polyethersulfone, polyacrylonitrile, polymethylmethacrylate etc.), but the higher increase in the use of synthetic membranes indicates that low-flux membranes made from synthetic material have also increased in preference. In general, these changes reflect an enhanced focus on treatment quality issues and practice outcomes. Reports on improved patient survival with HDF treatment support future continuation of these trends [21,22]. A trend towards the use of APD as opposed to CAPD was also supported by the data, with now as much as 30% of all PD patients worldwide being treated by this automated process.
This article provides a global overview of the treated ESRD population in 2004 and information on the patient geographical distribution, treatment modality selected and some clear treatment-related trends. Together with data available from national and international registries, the results of this study provide insight into present-day ESRD demographics. Such knowledge may be of value in assessing ESRD patient care practices and in allocating future resources necessary to provide better care to ESRD patients.
We would like to express our thanks to all those people in the 122 countries worldwide who provided the data for this report.
Conflict of interest statement. All authors are employees of Fresenius Medical Care.
References
Lysaght MJ. Maintenance dialysis population dynamics: current trends and long-term implications.
Moeller S, Gioberge S, Brown G. ESRD patients in 2001: global overview of patients, treatment modalities and development trends.
Jones CA, Krolewski AS, Rogus J, Xue JL, Collins A, Warram JH. Epidemic of end-stage renal disease in people with diabetes in the United States population: Do we know the cause?
The UK Renal Registry. The Seventh Annual Report. December 2004 (http://www.renalreg.com/Front_Frame.htm)
Dirks JH, De Zeeuw D, Agarwal SK et al. Prevention of chronic kidney and vascular disease: Toward global health equity – The Bellagio 2004 Declaration.
Eknoyan G, Lameire N, Barsoum R et al. The burden of kidney disease: improving global outcomes.
Peroco N, Codreanu I, Schieppati A, Remuzzi G. Prevention of progression and remission/regression strategies for chronic renal diseases: can we do better now than five years ago?
Alberts C, Drukker W. Report on regular dialysis treatment in Europe.
Nakai S, Shinzato T, Nagura Y et al. An overview of regular dialysis treatment in Japan (as of 31 December 2001).
Austrian Dialysis and Transplant Registry. Annual Report 2003 (http://www.nephro.at/JB_all.htm)
QuaSi-Niere. Report on dialysis treatment and renal transplantation in Germany. Annual report 2003/2004 (http://www.quasi-niere.de/world_e.htm)
Sociedad Latinoamerica de Nefrologia e Hipertension 2003 Report. (http://www.slanh.org/registro/informes.asp)
University Renal Research and Education Association (URREA). The Dialysis Outcomes and Practice Patterns Study (DOPPS). Report
European Renal Association – European Dialysis and Transplant Association Registry. Annual Report 2003 (http://www.era-edta-reg.org/index.jsp)
US Renal Data System. Annual Data Report 2004 (http://www.usrds.org/adr.htm)
Steil H, Orlandini G, Marcelli D et al. EuCliD – a medical registry.
The United Nations Statistics Division (http://unstats.un.org/unsd/)
WHO Statistical Information System (WHOSIS - http://www3.who.int/whosis/menu.cfm)
Canaud B, Bragg-Gresham JL, Marshall MR et al. Patients receiving hemodiafiltration or hemofiltration have lower mortality risk than patients receiving hemodialysis without replacement fluid in Europe: The Dialysis Outcomes and Practice Patterns Study (DOPPS).


Comments