


Abstract
We present an analysis of nine S0–Sb galaxies which have (photometric) bulges consisting of two distinct components. The outer component is a flattened, kinematically cool, disc-like structure: a ‘discy pseudo-bulge’. Embedded inside is a rounder, kinematically hot spheroidal structure: a ‘classical bulge’. This indicates that pseudo-bulges and classical bulges are not mutually exclusive phenomena: some galaxies have both. The discy pseudo-bulges almost always consist of an exponential disc (scalelengths = 125–870 pc, mean size ∼440 pc) with one or more disc-related subcomponents: nuclear rings, nuclear bars, and/or spiral arms. They constitute 11–59 per cent of the galaxy stellar mass (mean PB/T = 0.33), with stellar masses ∼7 × 10⁹–9 × 10¹⁰ M⊙. The classical-bulge components have Sérsic indices of 0.9–2.2, effective radii of 25–430 pc and stellar masses of 5 × 10⁸–3 × 10¹⁰ M⊙; they are usually <10 per cent of the galaxy's stellar mass (mean B/T = 0.06). The classical bulges do show rotation, but are clearly kinematically hotter than the discy pseudo-bulges. Dynamical modelling of three systems indicates that velocity dispersions are isotropic in the classical bulges and equatorially biased in the discy pseudo-bulges. In the mass–radius and mass–stellar mass density planes, classical-bulge components follow sequences defined by ellipticals and (larger) classical bulges. Discy pseudo-bulges also fall on this sequence; they are more compact than large-scale discs of similar mass. Although some classical bulges are quite compact, they are as a class clearly distinct from nuclear star clusters in both size and mass; in at least two galaxies they coexist with nuclear clusters. Since almost all the galaxies in this study are barred, they probably also host boxy/peanut-shaped bulges (vertically thickened inner parts of bars). NGC 3368 shows isophotal evidence for such a zone just outside its discy pseudo-bulge, making it a clear case of a galaxy with all three types of ‘bulge’.
1 INTRODUCTION
In the standard picture of galaxy structure, disc galaxies have two main stellar components. The defining component is the disc: a highly flattened structure dominated by rotation, often (but not always) with a radial density profile which is exponential; discs often have significant substructure, particularly bars and spiral arms. The secondary component, present in early and intermediate Hubble types, is the bulge. Traditionally, the bulge has been seen as something very like a small elliptical galaxy embedded within the disc: more spheroidal than the disc, with stellar motions dominated by velocity dispersion rather than rotation, and having a strongly concentrated structure – e.g. having a surface-brightness profile similar or identical to the stereotypical R1/4 profile of an elliptical). In addition, the stellar populations of bulges were said to resemble those of ellipticals in being older (and possibly more metal rich and α enhanced) than the majority of stars in the disc. (See e.g. Wyse, Gilmore & Franx 1997; Renzini 1999 for reviews.) Taken all together, this seemed to argue for a bulge formation mechanism similar to that proposed for ellipticals, either via monolithic collapse or by rapid, violent mergers of initial subcomponents at high redshift.
The past decade or two has seen the growing realization that this picture is probably not true for many bulges, at least when bulges are defined as the excess stellar light in the central regions of the galaxy when compared to the dominant exponential profile of the disc.1 Instead, bulges are now seen as falling into two rather different classes: classical bulges (the traditional model) and pseudo-bulges (e.g. Kormendy 1993; Kormendy & Kennicutt 2004), which are conceived of as something much more like discs than spheroids; i.e. they are flattened and dominated by rotation, with profiles which are close to exponential. Added to this complexity is the existence of so-called boxy and ‘peanut-shaped’ bulges, which are now well understood as the vertically thickened inner parts of bars (see Athanassoula 2005, for a discussion of the distinctions); confusingly, these structures are also sometimes called pseudo-bulges.
Although some authors are careful to point out the possibility that classical bulges could coexist with pseudo-bulges (see e.g. Athanassoula 2005; Fisher & Drory 2010), it is common to suggest that galaxies have one or the other, but not both. For example, in observational surveys such as those of Fisher & Drory (2008) or Gadotti (2009), photometrically identified bulges are classified as either classical or pseudo-bulge. Similarly, in studies of how central supermassive black holes (SMBHs) relate to their host galaxies, disc galaxies are divided into those with classical bulges and those with pseudo-bulges (e.g. Hu 2008; Greene et al. 2010; Kormendy, Bender & Cornell 2011).
In this paper, we present evidence for the coexistence in nine galaxies of both a classical bulge – that is, a round, kinematically hot stellar structure which is significantly larger than a NSC – and a discy pseudo-bulge – that is, a flattened stellar system, distinct from the main disc, whose kinematics are at least partly dominated by rotation and which (usually) hosts nuclear bars, nuclear rings, or other discy morphology.
Two of the galaxies discussed here – NGC 3368 and NGC 3489 – were previously discussed, in an abbreviated fashion, in Nowak et al. (2010), using the term ‘composite pseudo-bulges’. Some analysis of the morphological substructure in NGC 3945 and NGC 4371 has been previously presented in Erwin & Sparke (1999) and Erwin et al. (2003).
The outline of this paper is as follows. After some initial discussion of data sources and reduction (Section 2), we lay out our terminology in Section 3. We introduce our methodology for identifying classical bulges by considering in Section 4 two examples of simple classical-bulge-plus-disc systems (galaxies with only a classical bulge in addition to their disc). With this as a reference, we then consider two galaxies (NGC 3945 and NGC 4371) in some detail in Section 5, demonstrating first that much of their photometrically defined bulges are not classical bulges as previously defined, but something else: (discy) pseudo-bulges. We then go on to show that inside each pseudo-bulge is an additional structure which does resemble a classical bulge. The evidence for composite bulges in seven other galaxies follows a similar pattern, but is postponed to Appendix A so as not to interrupt the flow of the paper. Section 7 uses the results of Schwarzschild modelling for three composite-bulge galaxies to investigate the 3D stellar dynamics of the classical-bulge and discy pseudo-bulge components. Section 8 considers these composite-bulge galaxies and their subcomponents, including an analysis of their place in the mass–radius and surface-density–mass diagrams and a demonstration that the classical-bulge components, while generally rather small, are not in the same class as NSCs. Finally, Section 9 summarizes our findings.
2 DATA SOURCES
2.1 Imaging data and surface-brightness profiles
Imaging data for this study comes from a variety of sources; for each galaxy, we specify the individual images used and their origins. Some of the large-scale, ground-based optical images come from the WIYN Survey (Erwin & Sparke 2003), the Isaac Newton Telescope's Wide Field Camera (INT-WFC) observations of Erwin, Pohlen & Beckman (2008), or from the Sloan Digital Sky Survey (SDSS; York et al. 2000); for the latter, we use Data Release 7 (Abazajian et al. 2009). Other ground-based image sources include William Herschel Telescope (WHT)-INGRID K-band images from Knapen et al. (2003), available via NED, and images from the European Southern Observatory (ESO) archive and the Isaac Newton Group (ING) archive. A summary of this data can be found in Table 1.
For high-resolution imaging of the central regions of galaxies, we rely on archival images from the Hubble Space Telescope (HST), obtained with the Wide Field Planetary Camera 2 (WFPC2), the Wide Field Channel of the Advanced Camera for Surveys (ACS-WFC), or the NICMOS2 and NICMOS3 near-infrared (IR) imagers. In some cases – i.e. when HST imaging data are lacking or when the centre of a galaxy is particularly dusty – we use adaptive-optics (AO) K-band images derived from our VLT-SINFONI IFU observations by collapsing the data cubes along the wavelength direction. The latter observations are described in more detail in Nowak et al. (2010), Rusli et al. (2011) and Erwin et al. (in preparation).
Fortunately, these two issues can be dealt with in combination, by taking advantage of the fact that the same galaxy was observed in both images. The trick is to identify a radial overlap zone between the two profiles (outside the region where seeing distorts the low-resolution data) and iteratively fit for the values of k and Bi which minimize the difference |$I_{i}^{\prime }(r) - I_{o}(r)$| for values of r in the overlap zone (with Io being the outer profile). The two profiles are then merged at the best-matching radius in the overlap region. Although the profiles we analyse are usually major-axis cuts, in practice we determine k and Bi using profiles from ellipse fits with fixed position angle (PA) and ellipticity, to increase the signal-to-noise ratio (S/N). This approach is ideal when the high- and low-resolution images were taken with the same filter; in some cases, we are forced to match and combine profiles from images with dissimilar filters (e.g. F814W and R, or K and z).
When decomposing our surface-brightness profiles – which are typically cuts along the major axis of the galaxy – we do not attempt to correct for point spread function (PSF) convolution, though we do exclude the inner 2–3 pixels of the profile from the fit. For several galaxies with HST images, we estimated the possible effects of neglecting PSF convolution by also extracting profiles from images which had been deconvolved using the Lucy–Richardson algorithm (via the iraf task lucy) and TinyTim-generated PSFs. (This was not possible for all galaxies, since for some galaxies we rely on SINFONI data for which PSFs cannot be determined with nearly the same precision.) Comparison of fits to both uncorrected and ‘deconvolved’ profiles of the same galaxy showed that parameters for the central (classical) bulges differ by ≲ 15 per cent in the Sérsic index n and ≲ 3 per cent for other parameters.
2.2 Spectroscopic data
Some of the spectroscopic data used for NGC 2859 and NGC 4371 are based on previously unpublished data obtained with the ISIS double spectrograph on the 4.2 m WHT. Details of the observations are provided in Appendix B.
For NGC 3368, NGC 3945 and NGC 4371 we use long-slit data obtained with the Marcario Low Resolution Spectrograph at the Hobby-Eberly Telescope (HET), previously presented in Fabricius et al. (2012). For NGC 3368 and NGC 4699, we also use IFU data from our SINFONI K-band SMBH measurement programme (Nowak et al. 2010; Erwin et al., in preparation).
2.2.1 Other sources
We also make use of various published long-slit and IFU kinematic data; the specific sources are listed in Table 1 and in the discussions of each galaxy. We note here some data sets provided directly to us. For NGC 1068, this includes both long-slit data from Shapiro, Gerssen & van der Marel (2003), provided by Joris Gerssen, and SINFONI data for NGC 1068 (Davies et al. 2007), provided by Ric Davies. Large-scale SINFONI kinematic data for NGC 3368 (Hicks et al. 2013) were provided by Erin Hicks. Finally, for NGC 4262 we make use of OASIS IFU data (McDermid et al. 2006), provided by Richard McDermid.
3 TERMINOLOGY AND DEFINITIONS: WHAT DO WE MEAN BY ‘CLASSICAL BULGE’ AND ‘PSEUDO-BULGE’?
The terms ‘pseudo-bulge’ and ‘classical bulge’ are unfortunately rather ambiguous at present. Sometimes they are defined in terms of their presumed formation methods: e.g. pseudo-bulges are central concentrations of stars formed from bar- or spiral-driven inflows of gas in the disc plane, or even by any process that does not explicitly involve major mergers, while classical bulges are those structures formed by violent relaxation in major mergers (usually at high redshifts). The fundamental problem with such approaches is that there are few if any clear observational predictions for how to distinguish such formation methods in nearby galaxies.
For example, the formation of central ‘bulges’ by the merger of massive star-forming clumps in gas-rich, high-z discs can produce thick, dispersion-dominated central structures with ∼R1/4 light profiles and α-enhanced metallicities (e.g. Immeli et al. 2004; Elmegreen, Bournaud & Elmegreen 2008), fulfilling most of the traditional criteria for classical bulges. If one insists on major mergers as the formation mechanism, then these are not classical bulges – but we would have little or no way to distinguish these structures at z ∼ 0 from ‘proper’ classical bulges. Other theoretical studies of this formation mechanism argue that the resulting bulges should be smaller and more exponential-like, with Sérsic indices of ∼2 or even ∼1, and significant rotation (e.g. Hopkins et al. 2012; Inoue & Saitoh 2012). What this means is that a classification of structures in present-day galaxies based on their supposed formation mechanisms, though desirable, is probably still premature.
If we turn to the more feasible approach of observationally based classification, we still find considerable discord, if not an outright cacophony. Some surveys classify the central region of a galaxy as classical or pseudo-bulge depending on the presence or absence of certain morphological features: e.g. a smooth light distribution means a classical bulge, while the presence of dust lanes, spiral arms, rings, nuclear-scale bars, or so-called boxy/peanut-shaped isophotes mean a pseudo-bulge (Kormendy & Kennicutt 2004; Fisher & Drory 2008, e.g.). Other studies make distinctions based on photometric profiles of the ‘bulge’ component that results from a bulge-disc decomposition – e.g. pseudo-bulges are by definition any central structure with a Sérsic index < 2, or even any such structure with n < 4 (Laurikainen et al. 2009) – or some combination of mean surface brightness and size for the bulge component (e.g. Gadotti 2009).
Because of this confusion, we feel it is important to be clear about our terminology and our methods for identifying and classifying different types of ‘bulges’. As part of our analysis, we first identify what we call photometric bulges. This term refers to the region of a galaxy where the observed stellar surface brightness is brighter than an inward extrapolation of the outer-disc component, or is brighter than the inward extrapolation of a previously identified discy pseudo-bulge. We require that the photometric bulge should be more extended than a simple NSC (i.e. the half-light radius should be ≳ 10 pc). This is, as the name suggests, a purely photometric classification, and is used only as a preliminary tool (and for comparison with the results of purely photometric methodologies).
We then analyse the photometric bulges and classify them into two categories as follows.
Classical bulge. This is a photometric bulge which is some type of kinematically hot spheroid. That is, it must be clearly rounder in a 3D sense than the main galaxy disc (i.e. (c/a)bulge > (c/a)disc, where c is the vertical scalelength and a is the radial) and must have stellar kinematics which are dominated by velocity dispersion rather than rotation.
Discy pseudo-bulge. This is a photometric bulge which is ‘disc-like’ in two main ways: it has a flattening similar or identical to that of the main galaxy disc, and the stellar kinematics are dominated by rotation rather than velocity dispersion at least some point within the photometric-bulge region. We also consider the presence of clear morphological features such as bars, rings and spiral arms to be additional signatures of a discy pseudo-bulge, but do not rely on them alone.
It is important to note that our definition of classical bulge does not assume a particular surface-brightness profile shape: we are not assuming that kinematically hot spheroids must have de Vaucouleurs R1/4 profiles, nor that they must have Sérsic indices greater than some minimum value.
We also note that we are not considering several characteristics which are sometimes, as alluded to previously, discussed as indicative of ‘pseudo-bulges’ (Kormendy & Kennicutt 2004). For example, we are mostly not concerned with the presence or absence of dust in the centres of these galaxies, since this can sometimes be due to off-plane or counter-rotating gas (likely the result of accretion), and in other cases may merely indicate that the disc and bulge are coextensive. Since many of the galaxies we consider are lenticular, we do not require the presence of current or recent star formation as a pseudo-bulge indicator either. Thus, we are explicitly including what Fisher, Drory & Fabricius (2009) called ‘inactive pseudo-bulges’ (objects in their sample which had what they considered the morphological and photometric signatures of pseudo-bulges but which showed little or no evidence for recent star formation; see also Fisher & Drory 2010).
Finally, we are, for the most part, explicitly excluding boxy/peanut-shaped bulges from consideration in this study. As Athanassoula (2005) pointed out, these are the vertically thickened inner parts of bars, the result of a common dynamical instability which appears to accompany the formation of most bars. As such, they are not the sort of highly flattened, axisymmetric structures we are most interested in. None the less, we do consider the question of their possible coexistence with discy pseudo-bulges and classical bulges later on in the paper (Section 8.4).
In Section 4, we present two cases of S0 galaxies with purely classical bulges, as a way of providing both examples of how we identify classical bulges and some context for the composite bulges we discuss later. In Section 5, we then go on to analyse two composite-bulge S0 galaxies in detail; we start by identifying discy pseudo-bulges in each galaxy. While we would ideally like to present an example or two of ‘pure discy pseudo-bulge’ systems before moving on to the composite bulges, we have encountered difficulty in trying to identify any clear examples in the very nearby (e.g. D ≲ 20 Mpc), early-type disc galaxy population for which the necessary data (particularly stellar kinematics with the right combination of high spatial resolution and radial extent) exist. The problem is not so much identifying candidate discy pseudo-bulges in other nearby galaxies (as numerous others have done), but rather being able to clearly demonstrate that these are not also composite-bulge galaxies: i.e. that there are no classical bulges, however small, inside these galaxies. The fact that we do not present any examples of S0–Sb disc galaxies with pure discy pseudo-bulges should not, however, be taken as a claim that such systems are absent in the local Universe.
4 METHODS AND APPLICATIONS: SIMPLE CLASSICAL BULGES
4.1 Basic methodology
Secondly, we analyse the morphology of the photometric-bulge region, focusing especially on the shape of the isophotes. Our working assumption is that the photometric bulge and the outer disc share a common equatorial plane (i.e. they have the same line of nodes and, most importantly, the same inclination to the line of sight). This means that if the bulge is intrinsically rounder (more spheroidal) than the disc, its projected isophotes should appear rounder than those of the outer disc; in the extreme case of a spherical bulge, we would expect to see the elliptical isophotes of the (projected) outer disc give way to circular isophotes at small radii, where the bulge dominates the light.
Finally, we analyse the stellar kinematics in the photometric-bulge region, trying to determine whether they are more dominated by rotation or velocity dispersion. Traditionally, one way of using stellar kinematics to discriminate between classical bulges and pseudo-bulges (going back to Kormendy 1982) has been to note the position of the bulge in question on the V/σ–ϵ diagram (Illingworth 1977), where V and σ are the ‘characteristic’ stellar velocity and velocity dispersion and ϵ is the ellipticity.2 One can define a curve in this diagram which corresponds to an ‘isotropic oblate rotator’ (IOR), a simple model for a classical bulge or elliptical with isotropic velocity dispersion and possible flattening due to modest amounts of stellar rotation (e.g. Binney 1978, 2005). If the object clearly lies above the IOR curve, then the argument is that the object is too dominated by rotation to be considered a classical bulge. (Kinematically hot systems with little or no rotation but significant anisotropy will tend to lie below the IOR line.) This is one of the methods by which some of the original ‘pseudo-bulges’ (avant la lettre) were identified (Kormendy 1982, 1993). Recent discussion of this diagram, primarily in the context of elliptical and S0 galaxies and taking advantage of 2D kinematics, include, e.g. Cappellari et al. (2007), Spolaor et al. (2010), and Emsellem et al. (2011).
There are, however, some problems with the V/σ–ϵ approach. The underlying theoretical arguments for the reference IOR models pre-suppose simple, coherent stellar systems with unique, unambiguous values for the ellipticity, velocity and velocity dispersion. The original application envisaged was elliptical galaxies, where at least the domain (the entire galaxy) is unambiguous. But in the case of complex systems such as a bulge embedded within a disc containing secondary structures (nuclear rings, bars, etc.), it is not at all clear how one is supposed to define ‘the’ ellipticity; nor is it clear how to define ‘the’ velocity dispersion when the latter can vary significantly with radius. Even the common technique of choosing the maximum stellar velocity as ‘the’ velocity runs into trouble if the rotation curve continues to rise throughout the bulge region and into the disc-dominated part of the galaxy (or if the rotation curve has multiple peaks).
Faced with these difficulties, we opt for a different approach: we define a simple local measurement of the relative importance of rotation versus dispersion, by deprojecting the observed rotation to its in-plane value Vdp = Vobs/sin i and then dividing this by the observed velocity dispersion σ at the same radius. The resulting quantity – Vdp/σ – is a continually varying function of the radius, not a ‘universal’ value for an entire galaxy (or entire galactic component). We adopt an admittedly crude and ad hoc limit of Vdp/σ = 1 as the dividing line between kinematically ‘cool’ and kinematically ‘hot’ systems, so that classical bulges should have Vdp/σ < 1 within the region where they dominate the galaxy's light. In the following subsections, we provide some partial justification for this criterion by showing that galaxies with simple disc + spheroidal bulge morphologies do seem to have Vdp/σ < 1 within their bulge-dominated regions.
Since we identify the photometric-bulge region via decomposition of the major-axis profile, it makes sense to use major-axis value of Vdp/σ. This lets us use major-axis long-slit spectroscopy, which is in many cases the only available stellar-kinematic data – or the only data covering the full radial range of interest – for the galaxies we examine.
To show how this approach works in the simple case of disc galaxies without pseudo-bulges, the following subsections apply our methodology to two S0s with classical bulges.
4.2 Simple classical bulge example: NGC 7457
NGC 7457 is a nearby (D = 12.9 Mpc)3 low-luminosity S0 galaxy, seen at moderate inclination (i ≈ 58°; Gutiérrez et al. 2011); it has a central velocity dispersion of only ∼60–70 km s−1 (e.g. Trager et al. 1998; Wegner et al. 2003; Ho et al. 2009). Although it has been suggested as a possible pseudo-bulge host in the past, largely on the basis of supposed deviations from the Faber–Jackson relation (e.g. Kormendy 1993; Pinkney et al. 2003), more recent analyses clearly identify it as having a classical bulge (e.g. Fisher & Drory 2008, 2010; Kormendy et al. 2011).
The upper-left panel of Fig. 1 shows the V-band isophotes for NGC 7457, based on an archival image from the Jacobus Kapteyn Telescope (JKT) of the ING (see Gutiérrez et al. 2011, for details). The upper-right panel shows our bulge/disc (B/D) decomposition of a major-axis cut which combines data from the V-band image with data from an HST WFPC2 F555W image (for r < 6 arcsec). The fit excluded both the outer part of the disc (which has an antitruncated profile; Gutiérrez et al. 2011) and the inner nuclear excess at r < 0.35 arcsec, which has been attributed to either AGN emission (Gebhardt et al. 2003) or a NSC (Graham & Spitler 2009). The bulge/disc crossover radius is at Rbd = 6.2 arcsec; the disc is clearly the dominant component at r ≳ 15–20 arcsec.
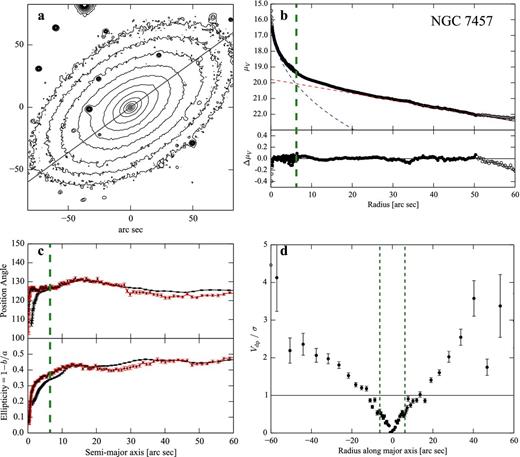
Evidence for a classical bulge in the low-mass S0 galaxy NGC 7457. (a) Log-scaled V-band isophotes (JKT image); grey line marks major axis (PA =126°). (b) Bulge-disc decomposition of major-axis profile. Data (black circles) combine major-axis cuts through HST WFPC2 F555W image (r < 6.6 arcsec) and ground-based V-band image. The dashed lines are Sérsic + exponential fit to the data for r = 0.4–50 arcsec (filled circles), with residuals in lower subpanel; data at r > 50 arcsec are part of a shallower outer zone in the antitruncated disc profile. The vertical dashed green line marks ‘bulge=disc’ radius Rbd, where Sérsic and exponential components are equally bright; this sets the boundary of the ‘photometric-bulge region’. (c) Ellipticity and PA of ellipse fits to V-band image (black) and HST image (red). (d) Plot of deprojected stellar rotation velocity divided by local velocity dispersion Vdp/σ along the major axis, using long-slit data from Simien & Prugniel (1997). The vertical dashed lines mark the photometric-bulge region |R| < Rbd; Vdp/σ is <1 inside, indicating a kinematically hot region (i.e. a classical bulge).
Turning to the isophotes shapes, the lower-left panel of Fig. 1 shows the results of fitting ellipses to both images. The ellipticity stays roughly constant into a ∼ 12 arcsec, and then becomes progressively rounder inside. This is consistent with the influence of a round bulge embedded within a highly elliptical (inclined) disc, so we have evidence that the photometric bulge identified in the B/D decomposition is a rounder (and thus more spheroidal) object than the disc.
Finally, the lower-right panel of Fig. 1 shows Vdp/σ as a function of radius along the major axis, using the long-slit kinematic data of Simien & Prugniel (1997). Within the photometric-bulge region, Vdp/σ is consistently <1 (in fact, it never gets above ∼0.6); it increases to larger radii, finally becoming >1 at r ≳ 15 arcsec. Note that Vdp/σ continues to increase as we move into the (photometric and morphological) disc region, reaching values ≳ 2 in the region which is unambiguously disc dominated.
As a crude approximation, then, we can identify ‘kinematically disc-like’ regions as having Vdp/σ > 1.
4.3 Simple classical bulge example: NGC 1332
With a K-band luminosity of 1.56 × 10¹¹ L⊙ and a central velocity dispersion of 328 km s−1 (Rusli et al. 2011), NGC 1332 is one of the most massive S0 galaxies in the nearby Universe (D = 22.3 Mpc; from Tonry et al. 2001 and Mei et al. 2005); it also hosts a central SMBH with a mass of 1.45 × 10⁹ M⊙ (Rusli et al. 2011).
Fig. 2 shows the overall morphology of the galaxy in panel (a): a highly elliptical outer disc with a distinctly rounder inner zone. Decomposition of the major-axis profile (panel b, combining data from a ground-based R-band image with HST WFPC2 F814W data at smaller radii and data from our SINFONI K-band data cube at the very smallest radii to reduce the effects of circumnuclear dust extinction; see Rusli et al. 2011 for details) shows a photometric bulge dominating the light at r < Rbd = 12 arcsec. As was the case for NGC 7457, the isophotes in the bulge-dominated region are clearly rounder (panel c) than those of the outer disc.
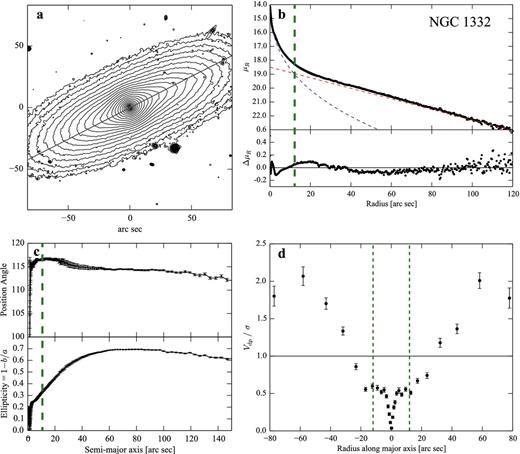
As for Fig. 1, but now showing evidence for a classical bulge in the high-mass S0 galaxy NGC 1332. (a) Log-scaled R-band isophotes (NTT-EMMI image); grey line marks major axis (PA =117°). (b) Bulge-disc decomposition of major-axis profile. Data (black circles) combine ellipse fits to SINFONI 100 mas and HST-WFPC2 F814W images (r < 2.6 arcsec) and ground-based R-band image. The dashed lines are Sérsic + exponential fit to the data, with residuals in lower subpanel. The vertical dashed green line marks ‘bulge=disc’ radius Rbd, where Sérsic and exponential components are equally bright; this sets the boundary of photometric-bulge region. (c) Ellipticity and PA of ellipse fits to R-band image. (d) Plot of Vdp/σ along major axis, using long-slit data from Kuijken et al. (1996) as re-reduced by Rusli et al. (2011). The vertical dashed lines mark the photometric-bulge region |R| < Rbd; Vdp/σ is <1 inside, indicating a kinematically hot region (i.e. a classical bulge).
Previous B/D decompositions for this galaxy (both 1D and 2D) are discussed in Rusli et al. (2011). Of particular note is the fact that their 2D decomposition had a best fit using a Sérsic bulge component with ellipticity =0.27, in contrast to the best-fitting exponential disc ellipticity of 0.73. This is clear support for the idea that the photometric bulge corresponds to a region which is significantly rounder than the disc. The slight twisting and rounding of isophotes between a ∼ 20 and 40 arcsec may indicate a very weak bar or lens, but otherwise this galaxy is very close to an ideal exponential disc + Sérsic bulge system.
Finally, panel (d) of Fig. 2 shows the radial trend of Vdp/σ, using data from Kuijken, Fisher & Merrifield (1996) as re-reduced by Rusli et al. (2011). Vdp/σ clearly reaches a plateau value (∼0.5–0.6) within the photometric bulge; as was the case for NGC 7457, the ratio only becomes >1 outside the photometric-bulge region.
As in the case of NGC 7457, we conclude that the photometric bulge in NGC 1332 is a structure which is clearly rounder than the disc and has stellar kinematics dominated by velocity dispersion: in other words, a classical bulge.
5 COMPOSITE BULGES: DETAILED EXAMPLES
In this section, we turn to a set of galaxies whose photometric bulges show significantly more complex structure than was true for the two S0 galaxies considered in the previous section. Basic parameters for these galaxies are presented in Table 2 .
Galaxies with composite bulges.
| Galaxy | RC3 type | D | Source | MB | PA | i | Rbd |
|---|---|---|---|---|---|---|---|
| (Mpc) | (°) | (°) | (arcsec) | ||||
| (1) | (2) | (3) | (4) | (5) | (6) | (7) | (8) |
| NGC 1068 | (R)SA(rs)b | 14.2 | 1 | −21.23 | 86 | 31/40 | 24 |
| NGC 1543 | (R)SB(l)00 | 20.0 | 2 | −20.12 | – | 20? | 26 |
| NGC 1553 | SA(r)00 | 18.0 | 2 | −21.08 | 152 | 48 | 16 |
| NGC 2859 | R)SB(r)0+ | 24.2 | 1 | −20.21 | 85 | 32 | 52 |
| NGC 3368 | SAB(rs)ab | 10.5 | 3 | −20.37 | 172 | 50 | 52 |
| NGC 3945 | (R)SB(rs)0+ | 19.8 | 1 | −19.94 | 158 | 55 | 17 |
| NGC 4262 | SB(s)0−? | 15.4 | 4 | −18.72 | 155 | 30 | 7.2 |
| NGC 4371 | SB(r)0+ | 16.9 | 4 | −19.49 | 90 | 58 | 32 |
| NGC 4699 | SAB(rs)b | 18.9 | 1 | −21.33 | 35 | 37 | 44 |
Notes. Basic characteristics of galaxies with composite bulges. Column 1: galaxy name. Column 2: Hubble type (RC3). Column 3: distance. Column 4: source for distance: 1 = virgocentric-infall-corrected redshift from HyperLeda; 2 = Tonry et al. (2001), with correction from Mei et al. (2005); 3 = Freedman et al. (2001); 4 = Blakeslee et al. (2009). Column 5: absolute B luminosity (HyperLeda Btc + adopted distance). Column 6: adopted PA of disc. Column 7: adopted inclination. Column 8: radius where luminosity of Sérsic component = luminosity of exponential component from initial photometric decomposition (see the text).
Imaging and spectroscopic data summary.
| Galaxy | Telescope/instrument | Filter | Source | Telescope/instrument | Source |
|---|---|---|---|---|---|
| imaging | spectroscopy | ||||
| (1) | (2) | (3) | (4) | (5) | (6) |
| NGC 1068 | VLT-SINFONI (AO) | H | 1 | VLT-SINFONI (AO) | 1 |
| HST-NICMOS3 | F200N | Gemini-GMOS | 2 | ||
| 2MASS | K | KNPO-4m-RCFS | 3 | ||
| SDSS | i | – | |||
| NGC 1543 | HST-WFPC2 | F814W | – | ||
| Spitzer-IRAC | IRAC2 | – | |||
| NGC 1553 | HST-WFPC2 | F814W | CTIO-4m-RCS | 4 | |
| HST-NICMOS2 | F160W | ESO-1.52m-B&C | 5 | ||
| Spitzer-IRAC | IRAC1 | – | |||
| NGC 2859 | HST-ACS/WFC | F814W | WHT-ISIS | 6 | |
| WIYN-3.5 m | R | 7 | WHT-SAURON | 8 | |
| SDSS | i | – | |||
| NGC 3368 | VLT-SINFONI (AO) | K | 9 | VLT-SINFONI (AO) | 9 |
| HST-NICMOS2 | F160W | HET-MLRS | 10 | ||
| WHT-INGRID | K | 11 | – | ||
| SDSS | r | – | |||
| NGC 3945 | HST-WFPC2 | F814W | HST-STIS | 12 | |
| WIYN-3.5 m | R | 7 | HET-MLRS | 10 | |
| NGC 4262 | HST-ACS/WFC | F850LP | WHT-OASIS | 13 | |
| SDSS | i | WHT-SAURON | 14 | ||
| NGC 4371 | HST-ACS/WFC | F850LP | VLT-SINFONI (AO) | 15 | |
| INT-WFC | r | 16 | WHT-ISIS | 6 | |
| NGC 4699 | VLT-SINFONI (AO) | K | 15 | VLT-SINFONI (AO) | 15 |
| SDSS | i,z | Las Campanas-2.5m-MS | 17 |
Notes. Imaging and spectroscopic data used for the composite-bulge galaxies. For each galaxy, we list the data in order of decreasing spatial resolution (e.g. HST or AO data, followed by ground-based data). Column 1: galaxy name. Column 2: telescope + instrument or survey for imaging data (‘AO’ = adaptive optics used). Column 3: filter used for imaging data. Column 4: source of imaging data, if not from public telescope archives. Column 5: telescope + instrument for spectroscopic/kinematic data. Column 6: source of spectroscopic/kinematic data. References: 1 = Davies et al. (2007); 2 = Gerssen et al. (2006); 3 = Shapiro et al. (2003); 4 = Kormendy (1984); 5 = Longo et al. (1994); 6 = this paper (Appendix B); 7 = Erwin & Sparke (2003); 8 = de Lorenzo-Cáceres et al. (2008); 9 = Nowak et al. (2010); 10 = Fabricius et al. (2012); 11 = Knapen et al. (2003); 12 = Gültekin et al. (2009); 13 = McDermid et al. (2006); 14 = Emsellem et al. (2004); 15 = Erwin et al. (in preparation); 16 = Erwin et al. (2008) and 17 = Bower et al. (1993).
We begin by examining two S0 galaxies – NGC 3945 and NGC 4371 – in detail, as paradigms for the analysis we apply to the whole set. Individual details and analysis for the other galaxies are discussed in Appendix A.
5.1 Composite bulge example: NGC 3945
NGC 3945 is a double-barred S0 galaxy (Erwin & Sparke 1999; Erwin 2004) which was originally singled out as an unusual object by Kormendy (1982); it had the largest value of (Vmax/σ0)⋆4 of any of the galaxies in his sample (see also fig. 17 of Kormendy & Kennicutt 2004), indicating an unusually high degree of rotational support for a ‘bulge’.
Erwin & Sparke (1999) re-examined this galaxy using HST imaging. They pointed out that much of the inner region (i.e. the photometric bulge) appeared to be similar to a small exponential disc, complete with a nuclear bar surrounded by a stellar ring, embedded inside the main body of the galaxy, and that this region had a flattening roughly consistent with that of the outer disc. Erwin et al. (2003) revisited this analysis by performing B/D decompositions and a further analysis of the original kinematics of Kormendy (1982); they noted the existence of a separate photometric component within the inner 2 arcsec, with isophotes which were rounder than the main part of the photometric bulge (and the outer disc). Because NGC 3945 is such a paradigmatic case for the phenomenon of composite bulges, we repeat most of their analysis here, with the addition of HST STIS stellar kinematics from Gültekin et al. (2009) which enables us to explore the kinematic status of the classical bulge; we also make use of new, large-scale kinematics obtained with the HET.
5.1.1 Photometric bulge as discy pseudo-bulge
As we did for the pure-classical-bulge S0s in the previous section, we performed a simple B/D decomposition of the major-axis profile (panel b of Fig. 3). This is not entirely successful, since the outer disc is not a simple exponential; instead, it is distorted by the presence of a very luminous outer ring, which we exclude from the fit. (On the other hand, this profile largely avoids any contribution from the primary bar, which is oriented close to the galaxy minor axis.) None the less, there is a clear inner excess which dominates the light at r ≲ 20 arcsec; from our fit, we find Rbd = 17 arcsec.
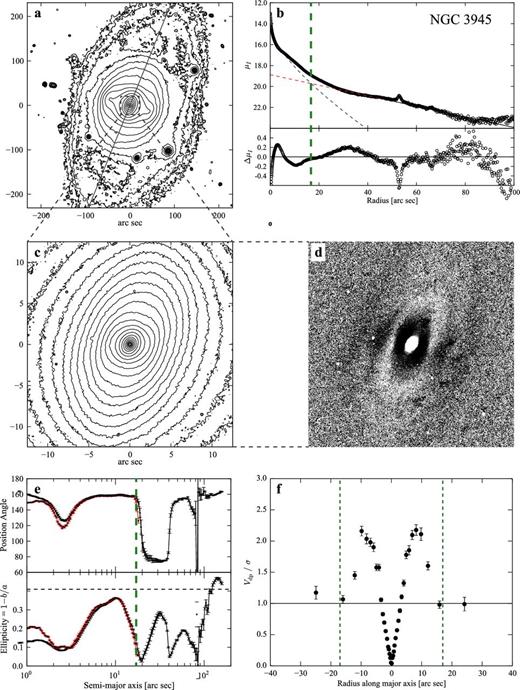
Evidence for a discy pseudo-bulge in the S0 galaxy NGC 3945. (a) Log-scaled R-band isophotes (WIYN image, smoothed with 15-pixel-wide median filter); grey diagonal line marks major axis (PA =158°). (b) Bulge-disc decomposition of WIYN major-axis profile. The dashed lines show Sérsic + exponential fit to the data, with residuals in lower subpanel. The vertical dashed green line marks ‘bulge=disc’ radius Rbd, where Sérsic and exponential components are equally bright; this sets the boundary of the photometric bulge. (c) Close-up of photometric-bulge region, (log-scaled isophotes from HSTF814W WFPC2 image). (d) Unsharp mask (using σ = 15 pixel Gaussian kernel) of inner region on the same scale as panel (c), showing stellar nuclear ring. (e) Ellipse fits to WIYN and HST images; note that the ellipticity reaches ∼0.36, similar to outer-disc value (horizontal dashed line), in the photometric bulge; this suggests that at least part of the photometric bulge has flattening similar to the outer disc. (f) Deprojected stellar rotation velocity divided by local velocity dispersion Vdp/σ along the major axis, using HET long-slit data. The vertical dashed lines mark the photometric-bulge region |R| < Rbd; Vdp/σ rises to >2 in this region, indicating a kinematically cool region more like a disc.
The fit in Fig. 3 is somewhat different from the global B/D decomposition presented in Erwin et al. (2003), which used an ellipse-fit profile rather than a major-axis cut, and tried to fit the outer ring beyond 80 arcsec with the same exponential component. That fit increased the role of the Sérsic component (in part because it included light from the bar, which our cut largely avoids because the bar is oriented almost perpendicular to the major axis), moving Rbd out to ∼30 arcsec; a similar Rbd value can be seen in the ellipse-fit-based B/D decomposition of this galaxy in Fisher & Drory (2010). If we use either of those fits instead, the photometric-bulge region becomes larger, but the conclusions of our analysis remain unchanged.
Thus far, our analysis of this galaxy has not shown any clear deviation from the simple classical-bulge systems discussed in Section 4. Something rather different does emerge, however, when we look at the isophote shapes in the photometric-bulge region (panels c and e of Fig. 3). The ellipticity of this region is quite large: it reaches a maximum value of 0.36 at a ≈ 10 arcsec, which is close to that of the outer disc. Given that these isophotes may still be distorted by light from the (primary) bar outside, it is possible that the underlying shape is actually the same as the outer disc; in any case, it suggests that much of the photometric-bulge region is nearly as flat as the outer disc.
Unsharp masking (panel d of Fig. 3) shows the signature of a stellar nuclear ring in this region (with a ∼ 6.5 arcsec); additional unsharp masking also reveals the presence of a nuclear bar inside the ring (see fig. 2 of Erwin & Sparke 1999). This inner bar actually produces a minimum in the ellipticity at a ≈ 2.6 arcsec because it is oriented close to the minor axis of the galaxy. The presence of these structures reinforces the idea that the photometric bulge of NGC 3945 is predominantly a disc-like structure.
Finally, panel (f) of Fig. 3 shows Vdp/σ, using our HET kinematics. In contrast to the simple classical-bulge galaxies studied above, Vdp/σ reaches a peak value >2 within the photometric-bulge region. This is clear, dramatic evidence that the photometric-bulge region is not a simple, kinematically hot structure; instead, the local stellar motions are sufficiently dominated by rotation as to resemble the disc regions of NGC 1332 and NGC 7457. Combined with the previous morphological evidence, this makes NGC 3945 one of the clearest cases of an S0 galaxy with a discy pseudo-bulge.
5.1.2 Inner photometric bulge as classical bulge
All of the foregoing is strong evidence that the photometric bulge of NGC 3945 is mostly, if not entirely, a discy pseudo-bulge. However, there is also good evidence that the innermost regions of the galaxy are dominated by a separate component, distinct from the pseudo-bulge.
The inner part (r < 20 arcsec) of the major-axis surface-brightness profile (panel b of Fig. 4) has two interesting characteristics: first, most of the profile is very nearly a perfect exponential; secondly, the inner r ≲ 2 arcsec shows a steep central excess. Erwin et al. (2003) pointed out that this profile appeared eerily similar to that of an exponential plus an inner Sérsic component, and proceeded to treat it in just that fashion. Panel (b) of Fig. 4 produces a revised version of that fit, this time including the contribution from the lens/outer disc (dashed green line in the bottom-left corner of the upper panel). Although the details of the fit are slightly different from Erwin et al. (2003), the result is still an excellent match to the profile; the small deviations at r < 5 arcsec are due to the presence of the inner bar and its surrounding nuclear ring. Given this inner decomposition, we can identify a new, much smaller photometric-bulge region, with Rbd, i = 1.1 arcsec (we use Rbd, i to indicate an inner bulge = disc radius, in contrast to the Rbd value from the global decomposition of the previous subsection).
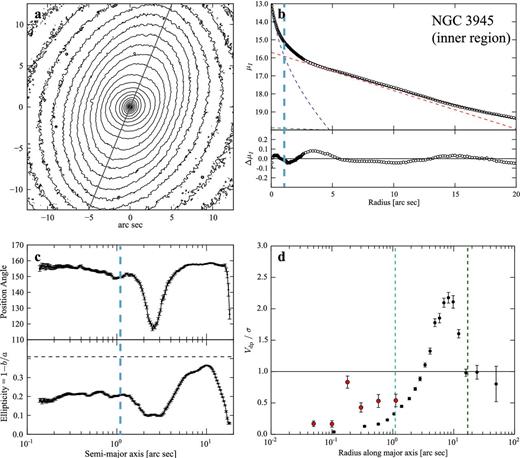
Evidence for a small classical bulge inside the discy pseudo-bulge of NGC 3945. (a) Close-up of main photometric-bulge region from HST WFPC2 F814W image, grey line marks major-axis PA. (b) Major-axis profile from HSTF814W WFPC2 image, with Sérsic + two-exponential fit (dashed lines) and residuals from fit in lower subpanel. The vertical dashed blue line marks inner ‘bulge=disc’ radius Rbd, i, where the Sérsic and exponential components of this fit are equally bright; this sets the boundary of the inner photometric bulge. (c) Ellipse fits to HST image; ellipticity in the inner photometric-bulge region (a ≲ 1.1 arcsec) is ∼0.21, much less than that of the discy pseudo-bulge outside. (d) Deprojected, folded stellar rotation velocity divided by local velocity dispersion Vdp/σ along the major axis, using HST STIS data from Gültekin et al. (2009; red) and HET long-slit data (black). The vertical dashed blue and green lines mark the inner and main photometric-bulge regions |R| < Rbd, i, respectively. In the inner region (r ≲ 1 arcsec), Vdp/σ remains well below 1, suggesting a kinematically hot region.
The inner ellipse fits – particularly those of the HST image – show that the region inside Rbd, i = 1.1 arcsec is distinctly rounder than the main part of the discy pseudo-bulge (and rounder than the outer disc), with an ellipticity ≈0.21 (panel c of Fig. 4). Photometrically and morphologically, then, we have evidence for a distinct central component, rounder than the outer disc and the discy pseudo-bulge.
What about the stellar kinematics? Here, we make use of the HST-STIS kinematics published by Gültekin et al. (2009). Panel (d) of Fig. 4 shows that Vdp/σ reaches a plateau value of ∼0.5 in the region ≲ 1.1 arcsec. Since the stellar kinematics of this central structure appear dominated by random motions, much like the larger classical bulges of NGC 1332 and NGC 7457 (above), we conclude that this inner structure is a (small) classical bulge.
5.2 Composite bulge example: NGC 4371
Like NGC 3945, NGC 4371 was noted by Kormendy (1982) for its rather large value of (Vmax/σ0)⋆ – second only to NGC 3945 in his sample. The variation in ellipticity of the inner isophotes in this barred S0 galaxies led Wozniak et al. (1995) to suggest that the galaxy might have a total of three bars: the obvious large outer bar and two more in the photometric-bulge region. Using HST images, Erwin & Sparke (1999) were able to show that the apparent signature of the inner two ‘bars’ was actually the result of a bright, stellar nuclear ring distorting the isophotes (see also Erwin, Vega Beltrán & Beckman 2001).
5.2.1 Photometric bulge as discy pseudo-bulge
Our B/D decomposition of the major-axis profile is shown in panel (b) of Fig. 5. The fit shows significant residuals, due in part to the presence of the nuclear ring at a ∼ 10 arcsec; however, it does allow us to define the photometric-bulge boundary as Rbd = 25 arcsec. (This is smaller than the bulge region defined by the decomposition of Fisher & Drory 2010, presumably because their ellipse-fit-derived profile includes light from the bar, which our major-axis cut largely excludes.)
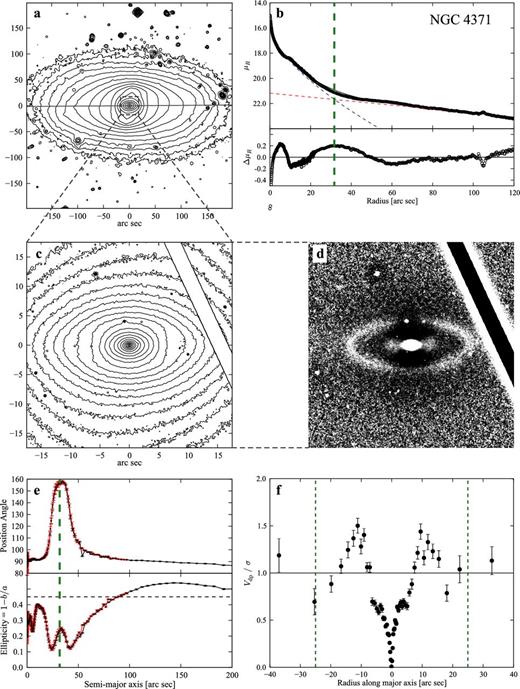
Evidence for a discy pseudo-bulge in the S0 galaxy NGC 4371. (a) Log-scaled R-band isophotes (INT-WFC image, smoothed with 15-pixel-wide median filter); grey line marks major axis (PA =90| $_{.}^{\circ}$|4). (b) Bulge-disc decomposition of INT-WFC major-axis profile. The dashed lines represent Sérsic + exponential fit to the data, with residuals plotted in lower subpanel. The vertical dashed green line marks ‘bulge=disc’ radius Rbd, where the Sérsic and exponential components are equally bright; this sets the boundary of the ‘photometric bulge’. (c) Close-up of photometric-bulge region (log-scaled contours from HST ACS-WFC F850LP image). (d) Unsharp mask (σ = 20 pixels) of same region, showing stellar nuclear ring. (e) Ellipse fits to INT-WFC and HST (red) images; note that ellipticity reaches ∼0.40, almost as high as the outer-disc value (horizontal dashed line), in photometric bulge; this suggests that at least part of the photometric bulge has flattening similar to the outer disc. (f) Deprojected stellar rotation velocity divided by local velocity dispersion Vdp/σ along major axis, using WHT-ISIS long-slit data. The vertical dashed lines mark the photometric-bulge region |R| < Rbd; Vdp/σ rises to ∼1.5 in this region, indicating a kinematically cool region more like a disc.
As was the case for NGC 3945, a close-up of the photometric-bulge region shows very elliptical isophotes interior to those defining the bar (panels c and e of Fig. 5); the peak ellipticity of ∼0.40 is close to that of the outer disc. (Note that the plotted ellipticity in panel e peaks at 0.54 at a ∼ 140 arcsec due to the presence of an outer ring; the true outer-disc ellipticity of 0.45 is determined from isophotes further out; see e.g. fig. 3b of Erwin, Beckman & Pohlen 2005.) Unsharp masking (panel d) shows the nuclear ring, which is a purely stellar phenomenon with no signs of gas, dust, or ongoing star formation, though Comerón et al. (2010) did find that the ring has a slightly bluer colour than the surrounding light in their HST colour map. Unlike the case of NGC 3945, there is no evidence for a nuclear bar in this galaxy.
The peculiarly box-shaped isophotes interior to the nuclear ring, which are visible at a ∼ 5–7arcsec and which produce the local ellipticity minimum in the ellipse fits, can be explained as the side effect of adding the isophotes of an elliptical ring to those of a rounder structure inside (see Erwin et al. 2001).
Finally, analysis of our major-axis WHT-ISIS spectroscopy shows that the Vdp/σ profile (panel f) has a peak of ∼1.5 within the photometric-bulge region – in fact, the peak is more or less at the radius of the nuclear ring. Once again, we have good evidence that the photometric-bulge region is kinematically more like a disc than a classical spheroid, in addition to the clear morphological evidence for a discy pseudo-bulge.
5.2.2 Inner photometric bulge as classical bulge
Although the inner profile is not as clean and simple as that of NGC 3945, we can still identify a clear central excess at r ≲ 5 arcsec. Panel (b) of Fig. 6 shows a plausible decomposition, where we treat the inner disc + nuclear ring as a single component with a broken-exponential profile (Erwin et al. 2008). [See Erwin et al. (in preparation), for a more complex, 2D decomposition which yields similar results in terms of the classical bulge.] As we did for NGC 3945, we can define an inner value of Rbd, i = 5 arcsec, where the Sérsic component is brighter than the sum of the outer exponential plus the nuclear-ring/inner-disc component.
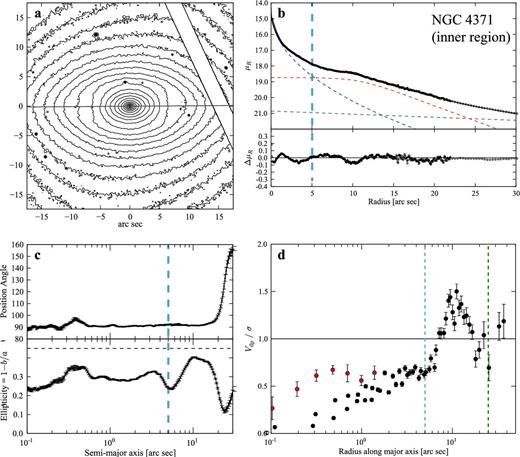
Evidence for a classical bulge inside the discy pseudo-bulge of NGC 4371. (a) Close-up of main photometric-bulge region from HST ACS-WFC F850LP image; grey line marks major-axis PA. (b) Major-axis profile from HST (r < 22 arcsec) and INT-WFC images, with fit (Sérsic + broken exponential + outer exponential; dashed lines) and residuals from fit in lower subpanel. The vertical dashed blue line marks inner ‘bulge=disc’ radius Rbd, i, where the Sérsic component has surface brightness equal to the sum of the disc components; this sets the boundary of the inner ‘photometric bulge’. (c) Ellipse fits to the HST image; note that ellipticity in the inner photometric-bulge region (a ≲ 5 arcsec) is ∼0.28, significantly less than that of the discy pseudo-bulge outside. (d) Deprojected, folded stellar rotation velocity divided by local velocity dispersion Vdp/σ along the major axis, using WHT-ISIS long-slit data (black) and SINFONI AO data (red). The vertical dashed blue and green lines mark the inner and main photometric-bulge regions |R| < Rbd, i, respectively. In the inner region (r ≲ 5 arcsec), Vdp/σ reaches a plateau value of ≈0.65, suggesting a kinematically hot region (i.e. a classical bulge).
The ellipticity of the HST isophotes interior to this radius (panel c of Fig. 6) is consistently ≈0.30 (the variation at a ≈ 0.3–0.6 arcsec is due to a circumnuclear dust ring, noted by Comerón et al. 2010). Moreover, the stellar kinematics for this region (panel d of the same figure) shows that Vdp/σ reaches a plateau of ∼0.65 within Rbd, i = 5 arcsec, so the kinematics of this region are dominated by velocity dispersion instead of rotation. In other words, the inner r < 5 arcsec of this galaxy appears to be dominated by a classical bulge.
6 OTHER COMPOSITE BULGES
Detailed discussion and analysis of the other seven composite-bulge galaxies can be found in Appendix A. We note here that not all these galaxies are as clear-cut as the two just discussed (NGC 3945 and NGC 4371). For example, we lack kinematic data with high enough spatial resolution to properly resolve the interior of the classical-bulge region for some of those galaxies. In most such cases, however, Vdp/σ is significantly <1 in the (resolved) region just outside the classical bulge, so it is unlikely that Vdp/σ is actually >1 inside the classical bulge.
For some galaxies, we use profiles from PA other than the galaxy major axis, especially when strong nuclear bars are present. This includes profiles perpendicular to nuclear bars (when present), to minimize its contribution, as well as alternate cases where we use a profile along the nuclear-bar major axis, including an extra component to account for the bar contribution.
The results of these analyses, combined with the previous ones for NGC 3945 and NGC 4371, are presented in Tables 3–5.
Discy pseudo-bulge characteristics.
| Galaxy | Exp. profile? | Max(Vdp/σ) | Discy features | μ0 | h | log M⋆ | |
|---|---|---|---|---|---|---|---|
| (mag arcsec−2) | (arcsec) | (pc) | (M⊙) | ||||
| (1) | (2) | (3) | (4) | (5) | (6) | (7) | (8) |
| NGC 1068 | Y | 2.80 | Bar, spirals | 13.12 (K) | 6.80 | 468 | 10.89 |
| NGC 1543 | Y | –a | Bar, NR | 17.15 (I) | 7.03 | 665 | 9.84 |
| NGC 1553 | Y? | 1.38 | Bar, NR/spirals | 15.31 (I) | 5.33 | 466 | 10.57 |
| NGC 2859 | Y | 1.56 | Bar, NR/spirals | 16.88 (i) | 4.45 | 522 | 10.49 |
| NGC 3368 | Y | 1.36 | Bar, spirals | 12.71 (K) | 3.05 | 149 | 9.85 |
| NGC 3945 | Y | 2.18 | Bar, NR | 15.69 (I) | 5.11 | 491 | 10.43 |
| NGC 4262 | Y | 1.58 | NR | 14.45 (i) | 1.66 | 124 | 10.09 |
| NGC 4371 | Y[*] | 1.50 | NR | –b | –b | –b | 9.88 |
| NGC 4699 | Y | 1.36c | Bar, spirals | 15.83 (z) | 7.61 | 697 | 10.97 |
Column 1: galaxy name. Column 2: indicates whether surface-brightness profile is exponential. Column 3: maximum value of Vdp/σ in the discy pseudo-bulge. Column 4: ‘discy’ features found in the pseudo-bulge region (NR = nuclear ring); note that for NGC 1068 and NGC 3368, the bars are only seen clearly in the near-IR. Column 5: central surface brightness of exponential component of discy pseudo-bulge; band is listed in parentheses. Columns 6 and 7: exponential scalelength of same, listed in both angular and linear sizes. Column 8: logarithm of estimated stellar mass of discy pseudo-bulge (including nuclear-bar components; see the text). Notes: aGalaxy too close to face-on to reliably deproject velocities. bIn NGC 4371, the discy pseudo-bulge profile is distorted by the strong nuclear ring, and is not modelled as a simple exponential (see Section 5.2.2). cKinematics do not extend to edge of pseudo-bulge, so this may be only a lower limit on Max(Vdp/σ).
Classical bulge parameters.
| Name | n | Re | μe | ϵ | log M⋆ | |
|---|---|---|---|---|---|---|
| (arcsec) | (pc) | (mag arcsec−2) | (M⊙) | |||
| (1) | (2) | (3) | (4) | (5) | (6) | (7) |
| NGC 1068 | 0.98 | 0.50 | 34 | 11.05 (K) | 0.14 | 9.47 |
| NGC 1543 | 1.50 | 2.73 | 258 | 17.02 (I) | 0.05 | 9.49 |
| NGC 1553 | 1.66 | 1.48 | 129 | 15.73 (I) | 0.1 | 9.32 |
| NGC 2859 | 1.68 | 1.06 | 124 | 17.00 (i) | 0.15 | 9.47 |
| NGC 3368 | 1.34 | 0.63 | 31 | 13.38 (K) | 0.00 | 8.73 |
| NGC 3945 | 2.02 | 1.24 | 119 | 16.20 (I) | 0.20 | 9.63 |
| NGC 4262 | 0.89 | 0.30 | 23 | 15.02 (i) | 0.05 | 8.70 |
| NGC 4371 | 2.18 | 5.20 | 427 | 18.70 (z) | 0.30 | 9.64 |
| NGC 4699 | 1.43 | 2.15 | 247 | 15.42 (z) | 0.11 | 10.46 |
Notes. Characteristics the of the classical bulges in our composite-bulge galaxies. Column 1: galaxy name. Columns 2–5: parameters of Sérsic fit; effective radius is given in both angular and linear sizes, and the band of the μe value is in parenthesis (these are usually based on the reddest available images, which vary from galaxy to galaxy). Column 6: adopted mean isophotal ellipticity of classical bulge. Column 7: logarithm of estimated stellar mass (see the text).
B/T values.
| Name | B/T⋆, cl | B/T⋆, phot | B/TL (lit.) | Source |
|---|---|---|---|---|
| (1) | (2) | (3) | (4) | (5) |
| NGC 1068 | 0.021 | 0.40 | 0.11 | L10 |
| NGC 1543 | 0.10 | 0.00 | 0.34 | L10 |
| NGC 1553 | 0.031 | 0.41 | 0.23 | L10 |
| NGC 2859 | 0.070 | 0.38 | 0.29, 0.47 | L10, F12 |
| NGC 3368 | 0.024 | 0.54 | 0.26, 0.41 | F11, F12 |
| NGC 3945 | 0.045 | 0.37 | 0.39, 0.36 | L10, F12 |
| NGC 4262 | 0.045 | 0.65 | 0.55 | L10 |
| NGC 4371 | 0.093 | 0.27 | 0.22, 0.38 | L10, F12 |
| NGC 4699 | 0.089 | 0.71 | 0.34 | L04 |
Notes. Bulge-to-total (B/T) values for composite-bulge galaxies. Column 1: galaxy name. Column 2: ratio of classical bulge stellar mass to total galaxy stellar mass. Column 3: ratio of photometric bulge stellar mass to total galaxy stellar mass, from simple 1D decomposition. Column 4: near-IR B/T luminosity values from the literature. Column 5: sources for values in Column 4 – L04 = 2D K-band decompositions of Laurikainen et al. (2004); L10 = 2D K-band decompositions of Laurikainen et al. (2010); F11 = ‘near-IR’ 1D decompositions of Fisher & Drory (2011); F12 = H-band 1D decompositions of Fabricius et al. (2012).
7 STELLAR DYNAMICS OF CLASSICAL BULGES AND DISCY PSEUDO-BULGES
Three of the composite-bulge galaxies, along with one of the example pure-classical-bulge galaxies (NGC 1332), have been observed with the SINFONI IFU during a project measuring SMBH masses in galaxy centres (Nowak et al. 2007, 2008, 2010; Rusli et al. 2011, 2013; Erwin et al., in preparation). As part of the analysis, we perform Schwarzschild orbit-superposition modelling in order to reproduce both the stellar light distribution and the observed stellar kinematics; see Thomas et al. (2004), Nowak et al. (2010) and Rusli et al. (2011) for details. Briefly stated, this involves constructing a galaxy potential from the combination of a central SMBH and one or more deprojected, 3D luminosity–density distributions (e.g. a component for the classical bulge and one for the discy pseudo-bulge+outer disc), converted to 3D stellar mass density distributions via a stellar mass-to-light ratio (M/L). Trial values of the SMBH mass and the stellar M/L are assigned, and then several tens of thousands of sample orbits are integrated in the potential. The resulting orbit library is weighted to produce the best match to the observed light distribution and the observed stellar kinematics, and the process is then iterated with new values of M/L and SMBH mass to map out the χ2 landscape.
The end result, in addition to best-fitting values for the stellar M/L and the SMBH mass, is a library of stellar orbits and corresponding weights which can be used to investigate the phase-space distribution of the stars and to look for things such as radial trends in 3D stellar dynamical quantities. We have previously made use of best-fitting orbit libraries to study radial anisotropy trends in core and non-core elliptical galaxies (Thomas et al. 2014); here, we use the best-fitting models for the S0 NGC 1332 (which has only a classical bulge) and the composite-bulge galaxies NGC 3368, NGC 4371 and NGC 4699 to explore how the models might shed light on the internal 3D kinematics of composite bulges.
Data and modelling for NGC 1332 and NGC 3368 have already been presented in Rusli et al. (2011) and Nowak et al. (2010), respectively; full data and modelling results, including SMBH measurements, for the other galaxies will be presented elsewhere (Erwin et al., in preparation). Once the best-fitting model is determined, stellar dynamical quantities can be extracted using the weighted means of orbits in different radial and angular bins.
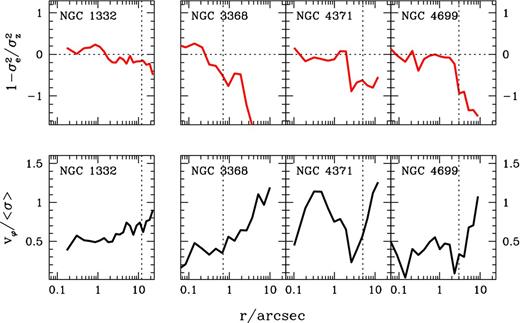
3D stellar kinematics from dynamical modelling of galaxies observed with SINFONI, for the classical-bulge galaxy NGC 1332 (left-hand panels) and three of the composite-bulge galaxies (right set of panels). The vertical dashed lines mark Rbd for NGC 1332 and Rbd, i for the classical bulges in the composite-bulge galaxies; regions to the left of these lines are dominated by the classical-bulge components. Top panels: |$\beta _{\rm eq} \: = \: 1 \, - \, \sigma _{e}^{2} / \sigma _{z}^{2}$|, which measures the relative anisotropy of planar (|$\sigma _{e}^{2} = (\sigma _{R}^2 + \sigma _{\varphi }^2)/2$|) versus vertical (|$\sigma _{z}^{2}$|) velocity dispersion in the best-fitting models; values near zero indicate isotropic velocity dispersions, while more negative values mean planar dispersions dominate over vertical dispersions. Lower panels: local ratio of mean rotation velocity Vφ to total mean velocity dispersion in the models.
For all galaxies, the anisotropy parameter βeq is ∼0 in the classical-bulge region, and decreases outside, indicating a shift from isotropic velocity dispersion to a dispersion which is dominated by planar motions. The latter is what we expect for flattened, disc-like structures, and supports the idea that the discy pseudo-bulges are indeed dynamically distinct from the classical bulges.
In most cases, the Vφ/〈σ〉 profiles show a trend similar to what we have seen in the major-axis Vdp/σ profiles: dispersion-dominated kinematics within the classical-bulge region and rotation-dominated kinematics in the discy pseudo-bulge (or main disc in the case of NGC 1332) outside. The exception is NGC 4371, where there is also an inner peak in Vφ/〈σ〉 at r ∼ 0.4 arcsec, deep within the classical-bulge region. Curiously, the radius where Vφ/〈σ〉 reaches its local maximum is also where the isophotal ellipticity has a local maximum (panel c of Fig. 6), though HST colour maps indicate that this is also a region marked by strong circumnuclear dust (see Comerón et al. 2010). This might represent the existence of an additional discy component with r ∼ 30 pc deep inside the classical bulge.
8 DISCUSSION
In the preceding sections of this paper (and in the Appendix) we have provided a kind of existence proof demonstrating that at least some lenticular and early-type spiral galaxies can host both discy pseudo-bulges and compact classical bulges, with the latter nestled inside the former. This shows that classical bulges and pseudo-bulges are not always exclusive phenomena.
The discy pseudo-bulges can almost always be described with exponential profiles,5 with the addition of various disc-like features: nuclear bars, stellar rings, or spiral arms. Our major-axis decompositions yield exponential scalelengths of 125–870 pc, with a mean of 440 pc. These are relatively massive structures, with stellar masses ranging from 7.1 × 10⁹ to 9.4 × 10¹⁰ M⊙ (mean = 3.3 × 10¹⁰ M⊙), or anywhere from 11 to 59 per cent of the total galaxy stellar mass (mean fraction = 33 per cent). Thus, in many cases a significant fraction of the galaxy's stars are part of the discy pseudo-bulge. (See Section 8.3 for details on the computation of the discy pseudo-bulge stellar masses.)
The classical bulges, in contrast, are relatively compact, low-mass structures. Our fits yield Sérsic indices of 0.89–2.18 (mean index = 1.52), half-light radii between 23 and 426 pc (mean Re = 143 pc), and stellar masses ranging from 5.0 × 10⁸ to 2.9 × 10¹⁰ M⊙. (See Section 8.2 for details of the stellar-mass estimation.) In only two galaxies is the stellar mass of the classical bulge more than 10 per cent of the galaxy's total stellar mass (NGC 1543 and NGC 4699, where it is 13.1 and 11.3 per cent, respectively), and the mean value is only 5.9 per cent.
8.1 Hints concerning the frequency of composite bulges
How common are composite-bulge systems? The disadvantage of an existence-proof study such as this one is that it can do little, by itself, to answer this question. The galaxies discussed in this paper are unfortunately not drawn from any well-defined sample which has been consistently analysed with the same degree of spatial resolution in both imaging and spectroscopy, primarily because the necessary combined data (particularly high-resolution spectroscopy for stellar kinematics) are not available for most nearby galaxies. We can note that most of our galaxies are part of a sample of early-type barred galaxies originally studied by Erwin & Sparke (2003) and expanded by Erwin et al. (2005), which does allow us to put some very crude lower limits. Of the 25 barred S0 galaxies in the aforementioned sample with i > 30°, we can identify three which are composite-bulge hosts (NGC 2859, NGC 3945 and NGC 4371). Of the 34 barred S0/a–Sb barred galaxies with the same inclination cutoff, there are three more galaxies from our composite-bulge set (NGC 1068, NGC 3368 and NGC 4699). This suggests that at least ∼10 per cent of S0–Sb barred galaxies are probably composite-bulge systems. The true frequency could be much higher – though it clearly cannot be 100 per cent, as there are clearly some galaxies with classical bulges but no discy pseudo-bulges (e.g. NGC 1332 and NGC 7457, Sections 4.2 and 4.3).
If we take the presence of nuclear bars as indicators of discy pseudo-bulges, as is often done (e.g. Kormendy & Kennicutt 2004; Fisher & Drory 2008), then the recent review of Erwin (2011) suggests that discy pseudo-bulges (with or without classical bulges) can be found in at least 20 per cent of early-type (S0–Sab) disc galaxies. The presence of nuclear bars as indicators of discy pseudo-bulges also means that weaker, less luminous discy pseudo-bulges may be lurking within more dominant classical bulges. For example, at least four of the galaxies classified as having classical bulges in the recent studies of Fisher & Drory (2008) and Fisher & Drory (2010) have nuclear bars: NGC 3031, NGC 3992, NGC 4548 and NGC 6684 (Elmegreen, Chromey & Johnson 1995; Erwin 2004; Gutiérrez et al. 2011; Erwin, in preparation b).
Fisher & Drory (2010) argued that galaxies with composite bulges would not be clearly distinguishable from galaxies with only a discy pseudo-bulge when using 1D surface-brightness profiles, unless the classical bulge were very luminous; they suggested that some of the galaxies with what they called ‘inactive pseudo-bulges’6 might harbour classical bulges as well, if the latter had relatively small Sérsic indices (e.g. ≲ 3). This is exactly what we find: all of our classical-bulge components have Sérsic indices ≲ 2.2. Of the four galaxies in common with their sample (NGC 1543, NGC 3368, NGC 3945 and NGC 4371), all are classified by Fisher and Drory as ‘inactive pseudo-bulges’ based on the mid-IR colours. It is worth noting that their 1D decompositions produced Sérsic indices for the photometric bulges of n < 2 for all but one of these galaxies (NGC 4371), so one cannot conclude from the Sérsic index of the photometric bulge alone that a galaxy is lacking a classical-bulge component.
8.2 Embedded classical bulges compared with other ‘spheroid’ systems
Table 4 presents the structural characteristics of the classical bulges in our composite-bulge systems. The listed colours come from aperture photometry on SDSS images (or HST images in the case of NGC 3945; Erwin et al. 2003); we use the colour-to-M/L calibrations of Bell et al. (2003) to calculate the resulting stellar masses. The exception to this is NGC 1068, where the bright AGN point source makes accurate stellar colour measurements in the inner few arcseconds very difficult. Instead, we adopted a K-band M/L of 0.7, using the lower end of the age estimate (5–12 Gyr) from the near-IR spectroscopy of Storchi-Bergmann et al. (2012) and the average M/L of Longhetti & Saracco (2009).7
In this paper, we refer to these compact, inner components as ‘classical bulges’ because they fulfil at least some of the standard criteria for classical bulges. The fact that they have rounder isophotes than the outer disc, yet share similar or identical PA, suggests they are approximately oblate spheroids (with little triaxiality) which are rounder (in an edge-on, vertical sense) than the disc. In addition, we have clear evidence that the classical bulges are kinematically hot, with Vdp/σ always <1, in the cases of NGC 1068, NGC 3368, NGC 3945, NGC 4371 and NGC 4699, where the available kinematic data come from observations with high enough spatial resolution to resolve the classical-bulge region. In other galaxies, such as NGC 2859.
The one exception to the usual classical-bulge paradigm is in the luminosity profiles. Traditionally, classical bulges have been claimed to have R1/4 profiles – i.e. a Sérsic index of n = 4. More recent formulations have suggested an approximate dividing line of n = 2, with classical bulges having higher values and pseudo-bulges (of whatever kind) having lower (e.g. Fisher & Drory 2010). Almost all of the objects we find have n < 2; only for NGC 3945 and NGC 4371 is n ≳ 2. So one could argue, purely on the basis of the Sérsic indices, that most of our central structures are a peculiar species of round, kinematically hot ‘pseudo-bulge.’ However, we prefer to consider the possibility that classical bulges can have a range of surface-brightness profiles, and that their primary characteristics remain their overall shape, their lack of discy substructure, and pressure-dominated stellar kinematics.
There are other kinematically hot, round stellar systems which are not considered classical bulges, of course. As we have seen, the classical-bulge parts of composite bulges span a range of sizes, with half-light radii from ∼400 down to ∼25 pc. The lower end of this range is sufficiently small that one might wonder whether some of these objects would really be better understood as ‘NSCs’, which are extremely common in late-type spirals and at least moderately common in earlier type discs (see e.g. the review by Böker 2008).
In Figs 8 and 9, we plot the classical-bulge components of our composite bulges in the context of other ‘spheroids’ – that is, stellar systems dominated by velocity dispersion – ranging from NSCs, dwarf spheroidals and ultracompact dwarfs to giant ellipticals. For the latter three classes of objects, we use the aggregated data compiled by Misgeld & Hilker (2011).
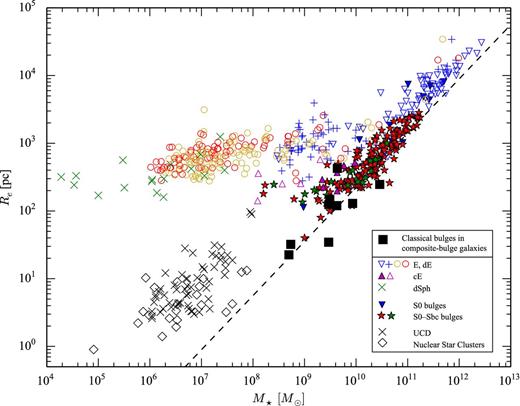
Half-light radius versus total stellar mass for a variety of ‘spheroids’ or ‘hot stellar systems’, based partly on fig. 4 of Misgeld & Hilker (2011). All except the squares, diamonds and stars are taken from their compilation: the open and filled blue (inverted) triangles are ellipticals and bulges of S0 galaxies, respectively, from Bender, Burstein & Faber (1993); the blue plus signs and red and orange open circles are E and dE galaxies from the ACS Virgo Cluster Survey (Ferrarese et al. 2006), the Hydra I Cluster (Misgeld, Mieske & Hilker 2008) and the Centaurus Cluster (Misgeld, Hilker & Mieske 2009), respectively; the magenta triangles are compact ellipticals (the open triangles are Coma galaxies from Price et al. 2009); and green and black × symbols are dSph galaxies and UCDs, respectively. The red stars are bulges of S0–Sa galaxies from the 2D decompositions of Laurikainen et al. (2010); the green stars are bulges of unbarred S0–Sbc galaxies from Balcells et al. (2007); and the open black diamonds are NSCs (see the text for sources). Finally, the filled black squares are the classical bulge components of our composite-bulge galaxies; they appear to fall into the narrow sequence defined by ellipticals and (early-type disc) bulges. The dashed line is the ‘zone of avoidance’ from equation 8 of Misgeld & Hilker (2011).
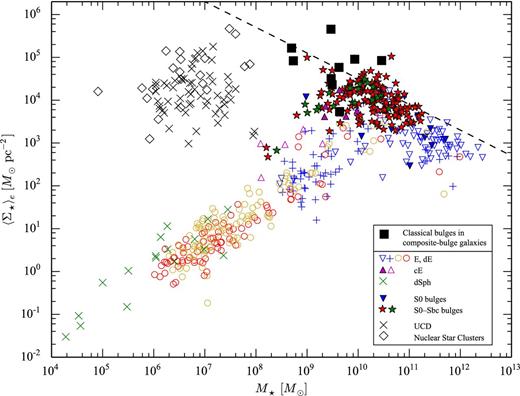
As for Fig. 8, but now showing mean stellar mass density within the half-light radius versus total stellar mass for the same systems.
To those data we have added the (photometric) bulges of S0–Sa galaxies from table 1 of Laurikainen et al. (2010; red stars). These are more modern measurements based on 2D decompositions of near-IR images, which help ensure that light belonging to the bar is not counted as part of the bulge. (We note that these decompositions do not account for the possibility of composite bulges, and we exclude the seven galaxies in their sample which are studied in this paper.) We converted their K-band measurements to stellar masses using the M/L of Bell et al. (2003) and colours from HyperLEDA. In particular, we used (B − V)e colours, which are a better approximation to the bulge colours than the total galaxy colour.8 We also include the bulges of unbarred S0–Sbc galaxies from Balcells, Graham & Peletier (2007), converting their K-band magnitudes to stellar masses in the same fashion (green stars). Finally, we plot NSCs using a compilation of masses from Erwin & Gadotti (2012) and half-light radii primarily from Böker et al. (2004) and Walcher et al. (2005), with some additional values from Ho & Filippenko (1996), Graham & Spitler (2009), Barth et al. (2009), Kormendy et al. (2010) and Seth et al. (2010).
What Fig. 8 shows is that the structures we identify as classical bulges in the composite-bulge systems fall into the ‘bulge’ section of the plot, not the ‘nuclear cluster’ section. Elliptical galaxies9 and classical bulges form a clear, relatively tight sequence in the Re–M⋆ plane, and our classical bulges either fall directly into this sequence or form a natural extension of it. Similarly, in Fig. 9, our classical bulges fall into the same (loose) sequence formed by giant ellipticals and larger classical bulges.
Although the smallest classical bulges are undeniably small, and begin to approach the most massive NSCs in size (half-light radius), they are significantly more massive. Moreover, in at least two of the composite-bulge galaxies (NGC 1543 and NGC 1553) there is evidence for distinct NSCs with half-light radii ∼4 pc located inside the classical-bulge components. While we cannot rule out the possibility of an as yet undetected population of central spheroids with masses ∼108 M⊙ and Re ∼ 10–20 pc, which would provide continuity between the classical bulges and NSCs, for the time being we consider them to be distinct phenomena.
8.3 Discy pseudo-bulges in the mass–size–density planes
As we have seen, the classical-bulge components of our composite-bulge systems appear to follow the same trends as (larger) classical bulge and ellipticals, at least in the Re–M⋆ and 〈Σ⋆〉e–M⋆ planes. What about the discy pseudo-bulges: do they resemble large-scale discs, classical bulges, or something else? Figs 10 and 11 show where the discy pseudo-bulges (filled blue diamonds) fall in the same diagrams used for Figs 8 and 9; we have desaturated the previously plotted points to allow the pseudo-bulge data points to stand out more clearly. We also plot the (large-scale) disc components from the S0/spiral decompositions of Balcells et al. (2007) and Laurikainen et al. (2010) as filled grey diamonds.
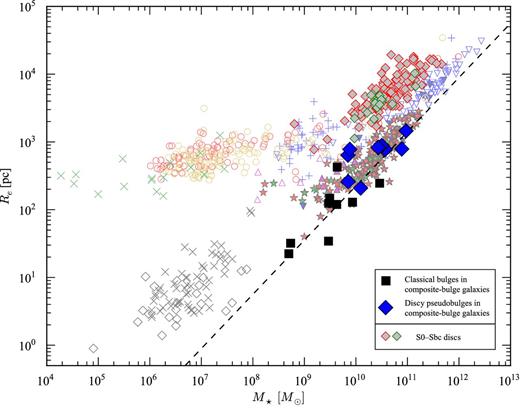
As for Fig. 8, but now including the discy pseudo-bulge components of our composite-bulge galaxies (large blue diamonds), along with the large-scale discs (smaller grey diamonds) from Balcells et al. (2007, green borders) and Laurikainen et al. (2010, red borders). The discy pseudo-bulges are clearly more compact than large-scale discs of the same mass, and actually fall on the same bulge/elliptical sequence as the classical-bulge components (the filled black squares).
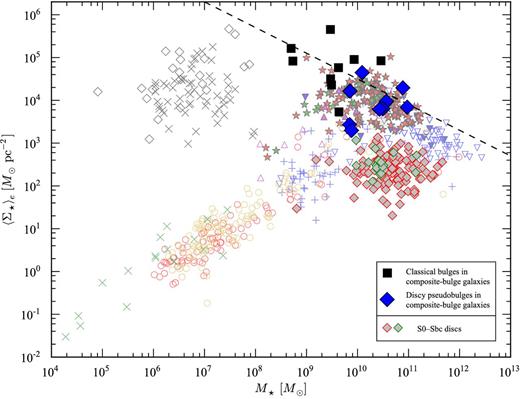
As for Fig. 10, but now showing mean stellar mass density within the half-light radius versus total stellar mass for the same systems.
The stellar masses of our discy pseudo-bulges – and the main discs from the Laurikainen et al. (2010) and Balcells et al. (2007) samples – plotted in Figs 10 and 11 come from the same general colour-to-M/L estimates (based on Bell et al. 2003) as used for the classical-bulge components in the preceding section. For most of the discy pseudo-bulges, we use the exponential component from the inner decomposition (e.g. panel b of Fig. 4) and assume that the discy pseudo-bulge is an exponential disc with an ellipticity equal to that of the outer disc. (For NGC 4371, we use the plotted broken-exponential fit from panel b of Fig. 6.) In the cases of NGC 1068, NGC 1543 and NGC 2859, where the inner fits specifically exclude the contribution of bright inner bars, we include an additional flux term to account for the inner bar itself (e.g. Erwin 2011). The half-light radii are computed using the best-fitting exponential scalelengths from the inner decompositions (e.g. panel b of Fig. 4) – i.e. excluding any contribution from the classical-bulge component. (The half-light radii for the large-scale discs are also estimated this way.) For discy pseudo-bulges with significant inner bars, this may misestimate the true half-light radius, but probably by less than a factor of 2, which means a very small shift on the plots.
What we can see from Figs 10 and 11 is that in terms of size, stellar mass and mean density, discy pseudo-bulges actually fall into the bulge/elliptical sequence, just like the classical bulges (albeit with masses and sizes that are on average larger than the classical bulges). Although some of the discy pseudo-bulges are as massive as large-scale stellar discs, they are roughly a factor of ∼5 times more compact. This suggests that their formation mechanisms are probably not the same as those involved in large-scale discs. It also is an indication that otherwise unclassified objects which fall on the classical-bulge/elliptical sequence in the mass–size and mass–density planes may not always be kinematically hot spheroidal systems.
(We note in passing that the precise location and distribution of large-scale discs on plots such as these may depend partly on Hubble type. For example, discs in very late-type spirals may lie further to the left in the Re–M⋆ plane; see e.g. fig. 9 of Laurikainen et al. 2010 or figs 18 and 20 of Kormendy & Bender 2012.)
8.4 What about boxy/peanut-shaped pseudo-bulges?
Athanassoula (2005) argued that instead of lumping the central regions of disc galaxies into just two types – classical bulges versus pseudo-bulges – one could, from a theoretical point of view, distinguish at least three possible structures: classical bulges, ‘disc-like bulges’ (i.e. what we have been calling discy pseudo-bulges), and boxy/peanut-shaped bulges, which are actually the vertically thickened inner parts of bars. She even suggested that some galaxies might contain all three at the same time.
In this paper, we have identified a number of disc galaxies containing both classical bulges and discy pseudo-bulges; what about boxy/peanut-bulges? We have avoided dealing with the latter in order to concentrate on the contrasting discy and spheroidal nature of the pseudo-bulges and classical bulges we are interested in; moreover, the traditional approach to identifying boxy/peanut-shaped bulges relies on galaxies which are edge-on, not moderately inclined. None the less, all but one of the galaxies discussed in this paper are barred. The extensive survey of edge-on galaxies by Lütticke, Dettmar & Pohlen (2000) found that the frequency of boxy and peanut-shaped bulges was consistent with most if not all barred galaxies having a vertically thickened inner region (a box/peanut structure, or B/P structure). Bureau et al. (2006) identified a number of edge-on galaxies which appeared to have both B/P structures and discy pseudo-bulges, so the coexistence of those two structures is certainly plausible. (Due to low spatial resolution and the presence of strong dust extinction in the central regions, small embedded classical bulges would have been difficult to find in their galaxies, if any such were present.)
More recently, Erwin & Debattista (2013) identified several morphological signatures of the B/P structure in barred galaxies which can be seen when the galaxy is only moderately inclined (i.e. i ∼ 40–70°), if the bar is favourably aligned with respect to the disc major axis. Since NGC 1068, NGC 1543, NGC 2859 and NGC 4262 are close to face-on (mostly i ≲ 30°), we would not expect to see signatures of the B/P structure. Additionally, the bars in NGC 3945 and NGC 4371 are oriented very close to the minor axes of their respective host galaxies. The latter orientation is one which minimizes the signature of the B/P structure; Erwin & Debattista did not find this signature in those three galaxies. However, they did identify NGC 3368 as an example of a galaxy with a visible projected B/P structure; as we noted in Section A3, this is probably responsible for the slightly boxy isophotes outside the discy pseudo-bulge – see Fig. 12. Thus, NGC 3368 is a clear case of a galaxy matching the suggestion of Athanassoula (2005) that disc galaxies can simultaneously host classical bulges, discy pseudo-bulges, and B/P bulges.
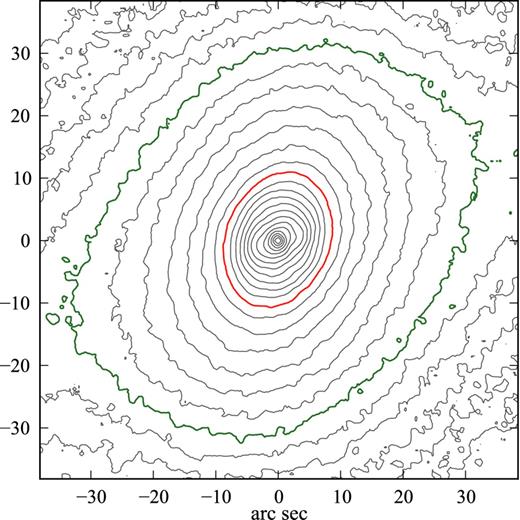
Discy pseudo-bulge inside a boxy/peanut-shaped bulge. Median-smoothed K-band isophotes for the interior of the outer bar of NGC 3368 (see Fig. A5 for larger scale context). The thicker green contour indicates the region of boxy isophotes, which are probably the projection of the inner, vertically thickened part of the bar – a boxy/peanut-shaped bulge. The region inside which is dominated by the discy pseudo-bulge is indicated by the thicker red contour. See also fig. A1 of Erwin & Debattista (2013).
8.5 Speculations on formation
8.5.1 Morphology: discy pseudo-bulges are (mostly) found inside bars
Most discussions of pseudo-bulges (see e.g. Kormendy & Kennicutt 2004) portray them as secondary structures formed late in a galaxy's history, usually via some form of bar-driven gas inflow and subsequent star formation in the central regions of the galaxy. The fact that almost all the galaxies discussed in this paper are barred is at least broadly consistent with the hypothesis of bar-driven formation. What is perhaps not yet clear is whether bar-driven inflow and star formation can readily create discy pseudo-bulges as large and as massive as some of those we identify. A possible additional issue is the fact that star formation inside the bars of early-type discs in the local Universe is usually observed taking place in nuclear rings. Several of our discy pseudo-bulges do feature nuclear rings (Table 3), which argues for a connection; the question is whether the rest of the discy pseudo-bulge, both inside and outside the ring, was formed the same way.
Wozniak & Michel-Dansac (2009) studied a high-resolution disc galaxy simulation and noted the formation of an extended ‘nuclear disc’ inside the bar, due to gas-driven bar inflow and star formation. This disc apparently gave rise to an independently rotating nuclear bar, with a gaseous nuclear ring of radius ∼400 pc. The reported size of the disc – ∼500 pc after 2 Gyr – is consistent with some of our discy pseudo-bulges, and the mass (7 × 10⁹ M⊙, 34 per cent of the galaxy's total stellar mass) is as well. More recently, Cole et al. (2014) have reported on a detailed disc–galaxy simulation in which a similar large nuclear disc formed inside a bar, and compared it to the discy pseudo-bulges in NGC 3368, NGC 3945, and NGC 4371. The nuclear disc in the simulation was more extended (relative to the size of the bar) than is the case for the three discy pseudo-bulges, but did have a similar mass fraction (29 per cent of the simulated galaxy's total stellar mass). So it appears that at least some detailed, high-resolution simulations can produce barred galaxies with discy pseudo-bulges similar to those seen in real galaxies.
We note that three of the composite-bulge galaxies do pose some more general problems for the bar-driven formation scenario, because their bars are weak, missing, or simply too small. NGC 1068, though formally unbarred, does at least appear to have a large-scale bar surrounding its discy pseudo-bulge (Erwin 2004, and references therein); however, this bar is quite weak, and is sometimes considered an ‘oval disc’ rather than a true bar (Kormendy & Norman 1979; Kormendy & Kennicutt 2004). It is not clear whether such a large discy pseudo-bulge (44 per cent of the NGC 1068's stellar mass) would be formed by such a weak bar. NGC 1553 is classified as unbarred, though it might be possible that its ‘lens’ is either the remnant of a once-strong bar (as argued by, e.g. Kormendy & Kennicutt 2004), or is the projection of the B/P structure of a still-existing, albeit rather weak, bar (see Appendix A1). The most difficult case is NGC 4699, where the discy pseudo-bulge is larger than the sole bar in the system. This implies that not all discy pseudo-bulges can be formed by bar-driven gas inflow. The alternative would be to postulate a previous, large bar in NGC 4699 which has since vanished. Unfortunately, theories of bar destruction either require unnaturally high central mass concentrations (which should prevent the existence of the current small bar in this galaxy), or do not yield testable predictions that would allow us to unambiguously identify whether a galaxy once had a bar, as opposed to never having had one.
A different formation scenario, which could potentially account for cases like NGC 4699, might be that some discy pseudo-bulges form early, possibly before any large-scale bar, as part of a general inside-out process. For example, Guedes et al. (2013) have presented a cosmologically motivated disc–galaxy simulation which formed with a ‘pseudo-bulge’ inside a larger disc; their analysis showed that most of the stars in the pseudo-bulge formed in situ and prior to most of the outer disc.
One way of distinguishing between these scenarios would be to look for evidence of significant differences in ages between the stars making up the discy pseudo-bulge and those making up the bar (if present) or disc outside. Younger ages in the discy pseudo-bulge would argue for the bar-driven formation mechanism, while a predominantly older population in the discy pseudo-bulge would suggest something more like the inside-out scenario of Guedes et al. (2013).
8.5.2 Possible clues from stellar populations
Unfortunately, we are rather lacking in detailed stellar-population analyses for most of our composite-bulge galaxies. Published analyses tend to be patchy and limited, either spatially or in terms of models with multiple populations.
de Lorenzo-Cáceres et al. (2012) and de Lorenzo-Cáceres, Falcón-Barroso & Vazdekis (2013) presented an analysis of stellar populations near the centres of five double-barred galaxies, one of which is the composite-bulge system NGC 2859. They found minimal age differences between the stars of the inner and outer bars, with the former being either coeval with or slightly younger than the latter. This seems to suggest that the inner bars – and by implication the rest of the discy pseudo-bulges – in these galaxies could indeed be (somewhat) younger than the outer bars, and thus formed after the outer bar formed, in agreement with the bar-driven formation model.
For the classical bulges, the existing data are (perhaps) contradictory. In the case of NGC 2859, de Lorenzo-Cáceres et al. (2013) found that the youngest part of the central region of NGC 2859 was what we identify as the classical bulge. While this could be interpreted as evidence that classical bulges form after the discy pseudo-bulges, one should note that de Lorenzo-Caceres et al. measured luminosity-weighted ages from comparisons with single stellar population (SSP) models, so there is the possibility that the measured ages are contaminated by more recent stellar populations.
The relevance of this concern was shown by Sarzi et al. (2005), who used HST STIS spectroscopy to estimate the stellar populations in the central 0.2 × 0.25 arcsec of a number of galaxies, including the composite-bulge system NGC 3368. Their best-fitting SSP models indicated a mean age of ∼1 Gyr for the nuclear region (dominated by the classical bulge) of NGC 3368, but their best-fitting multiple-population models included both younger and older components, with a 10 Gyr population contributing 27 per cent of the nuclear light (and the ≲ 1 Gyr components accounting for only 1.4 per cent of the nuclear stellar mass).
Storchi-Bergmann et al. (2012) modelled the near-IR spectra of the central 4.5 × 5.0 arcsec of NGC 1068 with multiple-age populations and found that the oldest component (5–13 Gyr in age) was concentrated in the inner r < 1 arcsec, corresponding to what we identify as the classical bulge (Section A6).
So the limited stellar-population evidence is, overall, broadly consistent with the discy pseudo-bulges being younger than both the bars outside and the classical bulges inside, but there is clearly room for further work.
8.5.3 Classical-bulge formation?
In the standard picture of galaxy formation, classical bulges are formed at high redshift from the violent merger of smaller galaxies or protogalactic subclumps, resulting in a compact, centrally concentrated object, with stellar kinematics dominated by dispersion and an old, metal-rich stellar population. Although we know of no reason why this could not be the case for our classical bulges, the latter do tend to be smaller and lower in mass (and certainly in B/T) than what is usually assumed for classical bulges. It is unclear whether this process would produce such small structures, or ones with Sérsic indices of ∼1–2.5.
Another possibility is the more recent scenario of clump-cluster mergers at high redshift (e.g. Noguchi 2000; Immeli et al. 2004; Elmegreen et al. 2008). In this model, massive star clusters form in turbulent, gas-rich discs and then, due to dynamical friction, spiral in towards the centre, where they merge in a fashion not entirely unlike the standard classical-bulge merger formation. Although some simulations have suggested that the resulting bulge would be relatively massive, with high Sérsic indices (e.g. Elmegreen et al. 2008), it seems possible that smaller, shorter lived versions of this scenario might form lower mass, lower Sérsic index classical bulges like those we find in the composite-bulge galaxies.
There is also the possibility that the structures we identify as classical bulges in these galaxies are actually byproducts of secular evolution – i.e. that they are produced in some fashion after the main disc forms, or even after the discy pseudo-bulge forms. We know that NSCs can host multiple episodes of star formation (e.g. Walcher et al. 2006), and the centre of the galaxy is where gas that loses angular momentum will tend to accumulate, which might suggest that compact classical bulges form through a similar process. However, the classical bulges in our galaxies tend to be significantly larger than – and even coexist with – NSCs (Section 8.2), which argues against that idea.
Our classical bulges might conceivably form directly out of discy pseudo-bulges via some kind of instability, though realistic models for such a process are lacking. We can rule out standard bar instabilities, since these produce elongated, boxy/peanut-shaped structures elongated along the parent bar (e.g. Erwin & Debattista 2013, and references therein), in contrast to the round, approximately axisymmetric structures we see, and also because some of the strongest cases, such as NGC 4371, do not have nuclear bars. (The B/P structures of the large-scale bars would be far larger than the classical bulges we find, as is clearly the case for at least NGC 3368; see Section 8.4). Similarly, the presence of nuclear bars in many of these galaxies (e.g. NGC 1068, NGC 1543, NGC 1553, NGC 2859, NGC 3945, and possibly NGC 4699) rules out scenarios in which a nuclear bar is ‘destroyed’ in order to form a classical bulge. We also note that the apparent high frequency of pseudo-bulges in late-type spirals (e.g. Fisher & Drory 2011) suggests that pseudo-bulges by themselves probably do not always give rise to classical bulges.
9 SUMMARY
We have presented a morphological and kinematic analysis of nine disc galaxies (S0 or spiral) in which the photometric-bulge region – that is, the excess stellar light above an inward extrapolation of the outer-disc profile – is composed of at least two distinct components as follows.
A discy pseudo-bulge. A structure with flattening similar to that of the outer disc, one or more morphological features characteristics of discs (nuclear rings, bars and/or spirals) and a stellar kinematics which is dominated by rotation.
A classical bulge. A component which is rounder (more spheroidal) than the discy pseudo-bulge and which has kinematics dominated by velocity dispersion. These components do, however, tend to have profiles best fitted with Sérsic indices of n = 1–2.2, so they are not classical in the sense of having R1/4 profiles.
In at least one galaxy there is also evidence for a boxy/peanut-shaped bulge (the vertically thick inner part of a bar), demonstrating that all three types of ‘bulge’ can coexist, as suggested by, e.g. Athanassoula (2005).
Using Schwarzschild orbit-superposition modelling for three of these galaxies (NGC 3368, NGC 4371 and NGC 4699), taken from Erwin et al. (in preparation), we investigated the 3D stellar orbital structure of the best-fitting models for each galaxy. We found that the stellar velocity dispersion is approximately isotropic within the classical-bulge regions but is equatorially biased in the discy pseudo-bulges (as expected for a highly flattened system), and also that the ratio of azimuthal velocity to total velocity dispersion (Vφ/〈σ〉) is typically ≲ 0.5 in the classical bulge and increases towards values ≳ 1 in the discy pseudo-bulge.
Although we are currently unable to put strong limits on the frequency of composite-bulge galaxies, they are probably present in at least ∼10 per cent of barred S0 and early-type spiral galaxies.
Plotting the classical-bulge components of the composite-bulge galaxies in the Re–M⋆ and 〈Σ⋆〉e–M⋆ planes shows that they fall into the same general sequence as elliptical galaxies and the (larger) bulges of disc galaxies. Even though some of the classical-bulge components are quite small, with half-light radii ∼30 pc, they remain distinct from NSCs (and some in fact harbour NSCs in their centres). Curiously, the discy pseudo-bulge components also lie along the elliptical/classical-bulge sequences in these planes. While some discy pseudo-bulges are as massive as the main (outer) discs of S0 and spiral galaxies, they are considerably more compact.
Since almost all of our composite-bulge galaxies are barred, the discy pseudo-bulge components could plausibly be the result of bar-driven gas inflow and star formation. We note that the ‘nuclear discs’ formed in this fashion in the simulations of Wozniak & Michel-Dansac (2009) and Cole et al. (2014) are similar in size and relative stellar mass to the discy pseudo-bulges in our galaxies. Cases where discy pseudo-bulges are found in unbarred galaxies (or galaxies where the only bar is smaller than the discy pseudo-bulge) are more difficult to explain, unless discy pseudo-bulges can form early in a galaxy's history as part of a general inside-out process (e.g. Guedes et al. 2013).
We enjoyed helpful and interesting conversations with a number of people, including Niv Drory, Witold Maciejewski and Victor Debattista. We are particularly grateful to Rick Davies, Joris Gerssen, Karl Gebhardt, Erin Hicks and Richard McDermid for supplying us with kinematic data, both long-slit and IFU, and to Jakob Walcher for help with nuclear star cluster data. We would also like to thank Begoña García-Lorenzo for faithfully executing our WHT-ISIS service observations of NGC 4371, and the anonymous referee for comments which helped improve the manuscript.
PE was supported in part by DFG Priority Programme 1177 (‘Witnesses of Cosmic History: Formation and evolution of black holes, galaxies and their environment’).
This research is (partially) based on data obtained with the William Herschel Telescope (WHT); the WHT and its service programme are operated on the island of La Palma by the Isaac Newton Group in the Spanish Observatorio del Roque de los Muchachos of the Instituto de Astrofísica de Canarias.
Based on observations made with ESO Telescopes at the La Silla Paranal Observatory under programme IDs 080.B-0336 and 082.B-0037.
Funding for the creation and distribution of the SDSS Archive has been provided by the Alfred P. Sloan Foundation, the Participating Institutions, the National Aeronautics and Space Administration, the National Science Foundation, the US Department of Energy, the Japanese Monbukagakusho and the Max Planck Society. The SDSS website is http://www.sdss.org/.
The SDSS is managed by the Astrophysical Research Consortium (ARC) for the Participating Institutions. The Participating Institutions are The University of Chicago, Fermilab, the Institute for Advanced Study, the Japan Participation Group, The Johns Hopkins University, the Korean Scientist Group, Los Alamos National Laboratory, the Max-Planck-Institute for Astronomy (MPIA), the Max-Planck-Institute for Astrophysics (MPA), New Mexico State University, University of Pittsburgh, University of Portsmouth, Princeton University, the United States Naval Observatory and the University of Washington.
This research made use of the NASA/IPAC Extragalactic Database (NED) which is operated by the Jet Propulsion Laboratory, California Institute of Technology, under contract with the National Aeronautics and Space Administration. It also made use of the Lyon-Meudon Extragalactic Database (LEDA; part of HyperLeda at http://leda.univ-lyon1.fr/).
Guest investigator of the UK Astronomy Data Centre.
Very compact central concentrations – e.g. nuclear star clusters (NSCs) – are considered separate objects and are excluded from this definition.
V is usually taken to be the maximum stellar rotation velocity Vmax and σ is some ‘central’ value; the ellipticity is sometimes the maximum observed value and sometimes a mean value.
This is the ratio of the observed Vmax/σ0 to the value expected for an IOR having the same ellipticity; the value for NGC 3945 was 1.82.
The main exception is NGC 4371, where the discy pseudo-bulge is better fit with a broken-exponential profile; see Section 5.2.2.
Low Sérsic indices and/or discy morphologies combined with mid-IR colours indicative of low star formation rates.
For two galaxies without (B − V)e colours (NGC 5636 and NGC 5953), we used g − r colours measured within an aperture of 5 arcsec radius on SDSS images; we were unable to find or measure colours for NGC 3892, which is excluded from the plots.
Here we are excluding dE galaxies – roughly, those ‘ellipticals’ with M⋆ ≲ 5 × 10⁹M⊙ – which tend to form a separate sequence merging into the dwarf spheroidals; see e.g. arguments in Kormendy & Bender (2012), where dE and dSph are together termed ‘spheroidals’.
Note, however, that Longo et al. reported seeing of <1 arcsec for their observations of this galaxy.
The Sérsic Re is ≈9 pc, but this does not account for PSF convolution.
midas is developed and maintained by the European Southern Observatory.
REFERENCES
APPENDIX A: OTHER COMPOSITE BULGES
A1 NGC 1553
NGC 1553 is a nominally unbarred S0 galaxy, notable for its prominent lens (e.g. Freeman 1975; Kormendy 1984). Kormendy & Kennicutt (2004) called attention to it as an example of a pseudo-bulge in an unbarred galaxy, based on its rather high Vmax/σ0 value.
As Kormendy and Kennicutt noted, this galaxy's surface-brightness profile looks very similar to that of many barred galaxies: an extended, shallow-surface-brightness ‘shelf’ with a much steeper falloff at its outer edge (located in between the central bulge and the outer exponential disc). The lens is more elliptical than the outer disc, and the presence of weak boxyness in the isophotes (strongest at a ∼ 25 arcsec) might suggest we are seeing the projected B/P structure of a (weak) bar, rather than a flattened structure. This would imply an unusually large ratio of B/P size to bar size, since we see little or no sign of the ‘spurs’ which are the projection of the vertically thin outer part of the bar (see Erwin & Debattista 2013). Regardless of its true nature, the presence of the lens leads us to model it as a separate, broken-exponential component in our global decomposition; the result is a relatively good fit to the major-axis profile (panel b of Fig. A1).
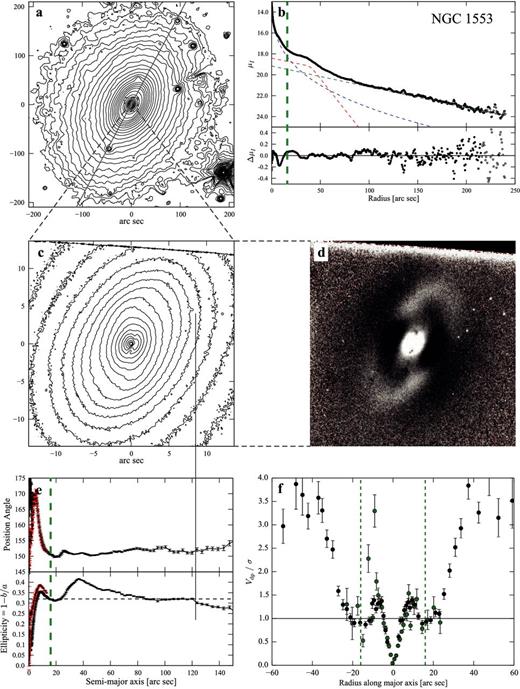
The discy pseudo-bulge in the S0 galaxy NGC 1553. (a) Log-scaled Spitzer IRAC1 isophotes (smoothed with 15-pixel-wide median filter); grey line marks major axis (PA =152°). (b) Bulge-disc decomposition of I-band major-axis profile (HST WFPC2 F814W for r < 4.1 arcsec, IRAC1 for larger radii). The dashed lines represent Sérsic + broken-exponential (lens) + exponential fit to the data, with residuals plotted in lower subpanel. The vertical dashed green line marks ‘bulge=disc’ radius Rbd. (c) Close-up of photometric-bulge region (log-scaled contours from WFPC2 F814W PC image). (d) Unsharp mask of the same image (σ = 30 pixels), showing the inner bar and partial spiral arms surrounding it. (e) Ellipse fits to the IRAC1 (black) and WFPC2 F814W (red) images. (f) Deprojected stellar rotation velocity divided by local velocity dispersion Vdp/σ along the major axis, using data from Kormendy (1984; black) and Longo et al. (1994; green). The vertical dashed lines mark the photometric-bulge region |R| < Rbd. Both data sets show that Vdp/σ rises to well over 1 within this region, indicating a kinematically cool region more like a disc.
The photometric-bulge region (r < 16 arcsec) shows clear evidence for a discy pseudo-bulge, as previously suggested by Kormendy & Kennicutt (2004) and Laurikainen et al. (2006): the ellipticity of the isophotes is similar to or greater than that of the main disc (panels c and e of Fig. A1), and the stellar kinematics are dominated by rotation, with Vdp/σ reaching a maximum of ∼1.4 at r ∼ 8 arcsec (panel f). Analysis of the HST images reveals a previously unrecognized nuclear bar, with surrounding stellar spiral arms (panel d), further evidence that the photometric bulge is disc-like.
Inside the nuclear bar, the isophotes are clearly rounder than the outer disc. We also find a clear central excess in the surface-brightness profile, and are able to fit the inner r < 30 arcsec major-axis profile quite well using the sum of an inner exponential + Sérsic, added to the contribution from the lens component we used in the global decomposition (panel b of Fig. A2). As was the case for NGC 3945 and NGC 4371, the inner photometric bulge (where the inner Sérsic component dominates, at r < 1.5 arcsec) corresponds to the round central isophotes. Although the ground-based stellar kinematics of Kormendy (1984) and Longo et al. (1994) which we use to determine Vdp/σ may not fully resolve our proposed classical-bulge region,10 the fact that Vdp/σ < 0.5 for r ≲ 3 arcsec suggests this region is indeed dominated by velocity dispersion, allowing us to classify the inner photometric bulge as a classical bulge.
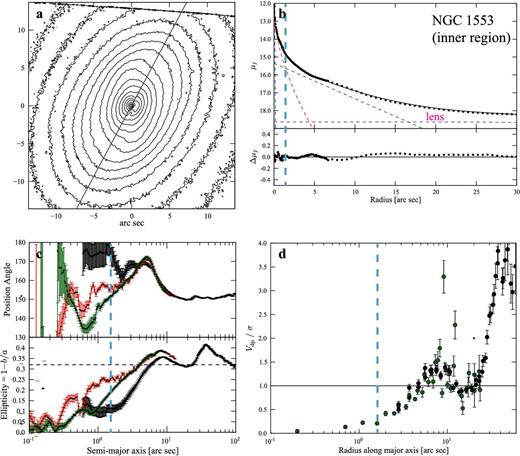
The classical bulge inside the discy pseudo-bulge of NGC 1553. (a) Close-up of main photometric-bulge region (see Fig. A1); grey line marks the major axis. (b) Major-axis profile, with fit (Sérsic + exponential + broken exponential; dashed blue, green and red lines, respectively) and residuals from fit in lower subpanel. The vertical dashed blue line marks inner ‘bulge=disc’ radius Rbd, i. (c) Ellipse fits (see Fig. A1; additional green fit is from NICMOS2 F160W image); note that the ellipticity in the inner photometric-bulge region (a ≲ 1.5 arcsec) is <0.25 (and ∼0.05–0.15 for a ≲ 0.6 arcsec), clearly less than that of the discy pseudo-bulge outside, or the outer disc. (d) Deprojected, folded stellar rotation velocity divided by local velocity dispersion Vdp/σ along galaxy major axis; see Fig. A1. The vertical dashed blue and green lines mark the inner and main photometric-bulge regions |R| < Rbd, i, respectively. In the inner region (r ≲ 1.4 arcsec) and immediately outside, Vdp/σ remains well below 1, suggesting a kinematically hot region (i.e. a classical bulge).
A2 NGC 2859
NGC 2859 is a strongly double-barred galaxy, as originally noted by Kormendy (1979); Kormendy (1982) observed a relatively high degree of stellar rotation in the photometric-bulge region, with (Vmax/σ0)⋆ = 1.2. This makes the galaxy potentially rather similar to NGC 3945.
The similarity with NGC 3945 begins, in fact, with a luminous outer ring (panel a of Fig. A3) creating a strongly non-exponential outer-disc profile. We choose to fit the region interior to the outer ring (r ≲ 70 arcsec, panel b). This produces a reasonable photometric bulge-disc decomposition, with Rbd ≈ 12 arcsec. If we had tried including the outer ring, the photometric-bulge region would only have become larger; e.g. the decomposition in Fabricius et al. (2012) gives Rbd = 30 arcsec.
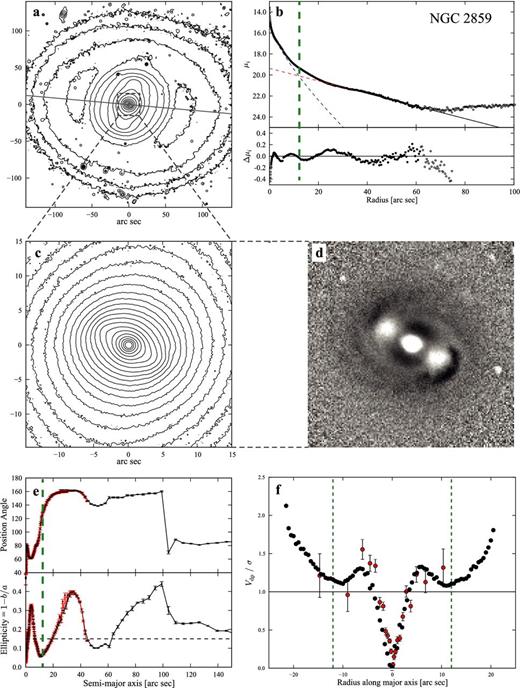
The discy pseudo-bulge in the S0 galaxy NGC 2859. (a) Log-scaled R-band isophotes (WIYN image, smoothed with 15-pixel-wide median filter); grey line marks major axis (PA =86°). (b) Bulge-disc decomposition of i-band major-axis profile (HST ACS-WFC F814W for r < 3.4 arcsec, SDSS i band for larger radii). The dashed lines represent Sérsic + exponential fit to the data, with residuals plotted in lower subpanel. The vertical dashed green line marks ‘bulge=disc’ radius Rbd, where the Sérsic and exponential components are equally bright; this sets the boundary of the ‘photometric bulge’. (c) Close-up of photometric-bulge region (log-scaled contours from R-band image). (d) Unsharp mask of the R-band image (σ = 5 pixels), showing the inner bar and partial spiral arms surrounding it. (e) Ellipse fits to the SDSS i-band (black) and ACS-WFC F814W (red) images. (f) Deprojected stellar rotation velocity divided by local velocity dispersion Vdp/σ along the major axis, using WHT-ISIS long-slit data (red) and SAURON data (black). The vertical dashed lines mark the photometric-bulge region |R| < Rbd. Both data sets show that Vdp/σ rises to well over 1 within this region, indicating a kinematically cool region more like a disc.
Interior to this we find a discy pseudo-bulge, as evidenced morphologically by the strong inner bar (Fig. A3, panels c and d) and kinematically by the Vdp/σ curve (panel f), which reaches a maximum of ∼1.3–1.5 at r ∼ 7 arcsec. The kinematic data combine our WHT-ISIS long-slit observations (Appendix B) and a pseudo-long slit constructed from the SAURON data of de Lorenzo-Cáceres et al. (2008); the latter profile was previously presented in Fabricius et al. (2012). We note that de Lorenzo-Cáceres et al. (2013) have also argued for the existence of a distinct inner disc in this galaxy from their 2D analysis of the SAURON kinematics.
Unlike the case of NGC 3945, where the inner bar was a small perturbation within the discy pseudo-bulge and could thus be ignored in the fitting process (particularly as it was oriented almost perpendicular to the major axis), the inner bar in NGC 2859 is much larger and stronger relative to the discy pseudo-bulge; indeed, it could perhaps be argued that the discy pseudo-bulge is largely just the inner bar plus its surrounding lens. However, we can take advantage of this fact by using the inner bar itself to guide our decomposition. A more detailed discussion of this approach, along with an analysis of the inner bar's structure, will be presented elsewhere (Erwin, in preparation a).
As Fig. A4 shows, we can use a cut along the inner bar's major axis and decompose this into an underlying exponential, a broken-exponential profile for the bar itself and a central Sérsic component. The latter defines the inner photometric bulge, with Rbd, i = 0.94 arcsec. This region is associated with a PA close to that of the outer disc and an ellipticity of ∼0.05 (panel c of Fig. A4), so we have morphological evidence for a classical bulge. Finally, the stellar kinematics (panel d of the figure) show that Vdp/σ remains <1 for r ≲ 3 arcsec, in both the SAURON and the (higher resolution) WHT-ISIS data.
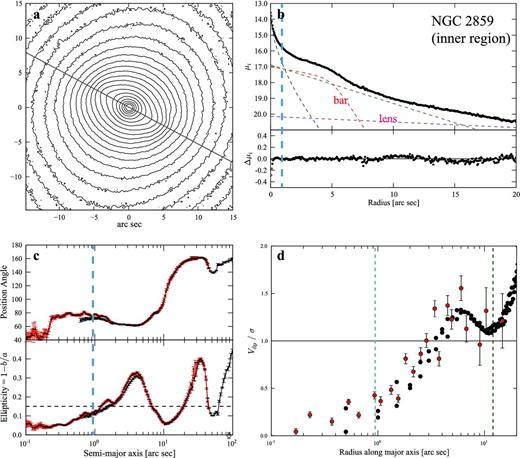
The classical bulge inside the discy pseudo-bulge of NGC 2859. (a) Close-up of main photometric-bulge region (see Fig. A3); grey line marks the major axis of the inner bar. (b) Inner bar major-axis profile (from ACS F814W image), with fit (Sérsic + broken exponential + exponential; dashed lines) and residuals from fit in lower subpanel. The vertical dashed blue line marks inner ‘bulge=disc’ radius Rbd, i, where Sérsic component is as bright as the sum of the other two components. (c) Ellipse fits (see Fig. A3); note that the ellipticity in the inner photometric-bulge region (a ≲ 1 arcsec is ∼0.05–0.1, less than that of the discy pseudo-bulge outside. (d) Deprojected, folded stellar rotation velocity divided by local velocity dispersion Vdp/σ along galaxy major axis; see Fig. A3. The vertical dashed blue and green lines mark the inner and main photometric-bulge regions |R| < Rbd, i, respectively. In the inner region (r ≲ 1 arcsec) and immediately outside, Vdp/σ remains well below 1, suggesting a kinematically hot region (i.e. a classical bulge).
A3 NGC 3368
The case of NGC 3368 was originally considered in Nowak et al. (2010); our analysis here is very similar. The large-scale major-axis decomposition (panel b of Fig. A5) shows a fairly plausible Sérsic + exponential fit, with Rbd = 52 arcsec. We note that this is rather larger than the value of Rbd = 23.3 arcsec which Fabricius et al. (2012) found from their 1D decomposition, which may reflect the effects of masking intermediate parts of the profile in the latter study. A similar fit to a partially masked 1D profile of this galaxy by Fisher & Drory (2008) resulted in Rbd ∼ 35 arcsec. Adopting either of these smaller radii as the outer boundary of the photometric-bulge region has no significant effect on our analysis, however.
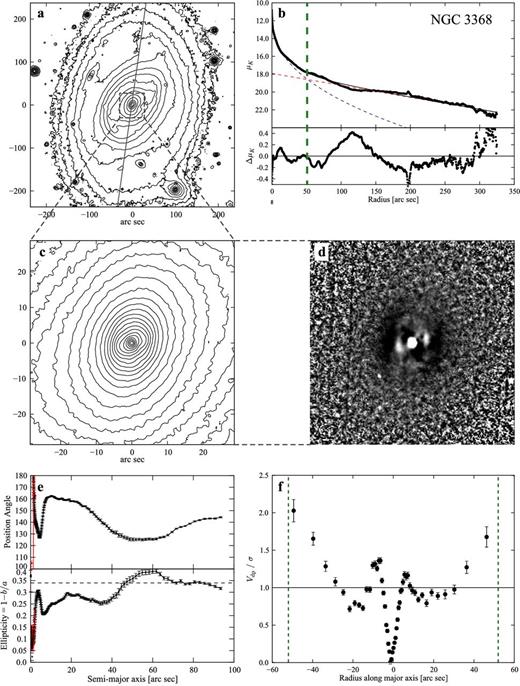
The discy pseudo-bulge in the Sab galaxy NGC 3368. (a) Log-scaled SDSS r-band isophotes (smoothed with 15-pixel-wide median filter); grey line marks major axis (PA =172°). (b) Bulge-disc decomposition of major-axis profile (combines NICMOS2 F160W; Knapen et al. (2003) K-band and SDSS r-band data). The dashed lines represent Sérsic + exponential fit to the data, with residuals plotted in lower subpanel. The vertical dashed green line marks ‘bulge=disc’ radius Rbd, where the Sérsic and exponential components are equally bright; this sets the boundary of the ‘photometric bulge’. (c) Close-up of photometric-bulge region, using Knapen et al. (2003) K-band image (smoothed with 5-pixel-wide median filter, log-scaled contours). (d) Unsharp mask of the same image (σ = 5 pixels), showing the inner bar and dust lanes in the vicinity. (e) Ellipse fits to the K-band and SINFONI (red) images. (f) Deprojected stellar rotation velocity divided by local velocity dispersion Vdp/σ along the major axis, using HET long-slit data. The vertical dashed lines mark the photometric-bulge region |R| < Rbd. Vdp/σ rises to ∼1.36 within this region, indicating a kinematically cool region more like a disc.
The isophotes and ellipse fits (panels c and e) show two regions of high ellipticity, corresponding to the ‘inner disc’ and inner bar of Erwin (2004); unsharp masking (panel d) shows the inner bar more clearly (panel d). The stellar kinematics from Fabricius et al. (2012) clearly shows a peak in the Vdp/σ profile (panel f), which reaches a maximum of ∼1.3 at r ≈ 7 arcsec; the improved S/N of the HET spectrum shows this more clearly than the older kinematics from Vega Beltrán et al. (2001) which were used by Nowak et al. (2010).
Thus we appear to have reasonable evidence for a discy pseudo-bulge, as argued in Nowak et al. (2010). As in the cases of NGC 1553 and NGC 2859, the ellipticity profile (panel e of Fig. A5) is more complicated than that of NGC 3945 and NGC 4371, both because of the strong contribution from the inner bar (which is indirect evidence for disc-like structures, but is not a disc itself) and because the intermediate ellipticity peak (at a ∼ 21 arcsec) is probably associated with the structure of the outer bar – specifically, with the projection of the vertically thick inner part of the bar (see Section 8.4).
Fig. A6 shows the evidence for a classical bulge inside the discy pseudo-bulge of this galaxy. The inner decomposition presented here is somewhat different from that of Nowak et al. (2010), because we are now including an additional (exponential) component to represent the contribution of the (outer) bar and the lens; consequently, the parameters of the best-fitting inner exponential and Sérsic components are somewhat different. None the less, our main conclusions are unchanged: we find evidence that the light at r ≲ 1 arcsec is due to a separate photometric component with much rounder isophotes than either the discy pseudo-bulge or the outer disc. The Vdp/σ plot incorporates major-axis values from the SINFONI data cubes of Nowak et al. (2010) and Hicks et al. (2013) and the lower resolution major-axis long-slit spectroscopy of Fabricius et al. (2012). The innermost SINFONI kinematics from Nowak et al. (2010), obtained with an AO-corrected seeing of ∼0.17 arcsec full width at half-maximum (FWHM), clearly show that this inner component has dispersion-dominated stellar kinematics, with Vdp/σ significantly <1.
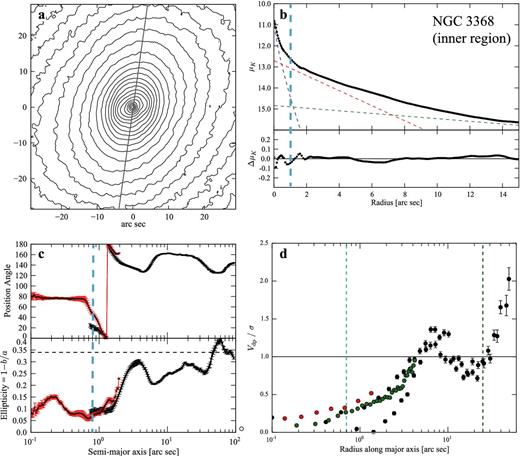
The classical bulge inside the discy pseudo-bulge of NGC 3368. (a) Close-up of main photometric-bulge region from the K-band image; grey line marks major-axis PA. (b) Major-axis profile combining SINFONI, NICMOS2 and ground-based K-band data, with fit (Sérsic + exponential + exponential; dashed lines) and residuals from fit in lower subpanel. The vertical dashed blue line marks inner ‘bulge=disc’ radius Rbd, i. (c) Ellipse fits to the K-band and SINFONI (red) images.; note that the ellipticity in the inner photometric-bulge region (a ≲ 1 arcsec is ∼0.1, less than that of the discy pseudo-bulge outside. (d) Deprojected, folded stellar rotation velocity divided by local velocity dispersion Vdp/σ along the major axis, combining AO SINFONI (red), non-AO SINFONI (green) and HET (black) data. Vertical dashed blue and green lines mark the inner and main photometric-bulge regions |R| < Rbd, i, respectively. In the inner region (r ≲ 1 arcsec), Vdp/σ remains well below 1, suggesting a kinematically hot region (i.e. a classical bulge).
A4 NGC 4262
NGC 4262 is a low-inclination barred S0 galaxy in the Virgo cluster, classified by Erwin (2004) as possessing an inner disc inside the bar, based in part on observations by Shaw et al. (1995). Although the galaxy is quite close to face-on, we do find evidence for both a (possibly) discy pseudo-bulge and a very small classical bulge.
The decomposition of the major-axis profile (Fig. A7, panel b) is relatively simple and clean, with the resulting photometric-bulge region defined by r < Rbd = 7.2 arcsec. The main morphological evidence for a discy pseudo-bulge is a distinct stellar nuclear ring with a ∼ 2.9 arcsec (panel d), also noted by Comerón et al. (2010); the isophotes in this region have an ellipticity only marginally less than that of the outer disc, and greater than that of the inner a ≲ 1 arcsec (see also panel c of Fig. A8). Kinematically, we find that Vdp/σ reaches a peak value of almost 1.6 at approximately the same radius as the nuclear ring. The stellar-kinematic data are from major-axis cuts through SAURON IFU data from the SAURON public archive,11 originally published in Emsellem et al. (2004), and higher resolution OASIS IFU data from McDermid et al. (2006).
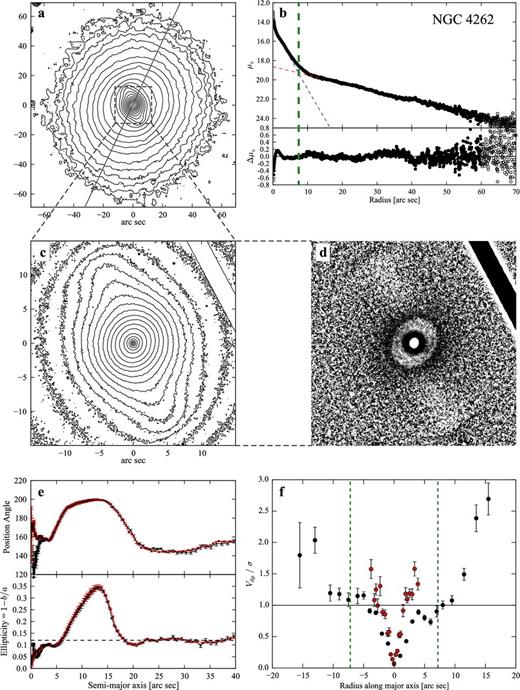
The discy pseudo-bulge in the S0 galaxy NGC 4262. (a) Log-scaled SDSS i-band isophotes (smoothed with 15-pixel-wide median filter); grey line marks major axis (PA =155°). (b) Bulge-disc decomposition of major-axis profile, from SDSS i-band and HST ACS-WFC F850LP images. The dashed lines represent Sérsic + exponential fit to the data, with residuals plotted in lower subpanel. The vertical dashed green line marks ‘bulge=disc’ radius Rbd, where the Sérsic and exponential components are equally bright; this sets the boundary of the ‘photometric bulge’. (c) Close-up of photometric-bulge region (log-scaled contours from ACS-WFC F850LP image, smoothed with 3-pixel-wide median filter). (d) Unsharp mask of the HST image (σ = 15 pixels), showing the nuclear ring. (e) Ellipse fits to the SDSS (black) and HST (red) images; note that the ellipticity interior to the bar is only slightly below that of the outer disc. (f) Deprojected stellar rotation velocity divided by local velocity dispersion Vdp/σ along the major axis, using OASIS data (red) from McDermid et al. (2006) and SAURON data (black) from Emsellem et al. (2004); the former has much higher spatial resolution (FWHM = 0.6 versus 2.6 arcsec). The vertical dashed lines mark the photometric-bulge region |R| < Rbd. Vdp/σ in the high-resolution OASIS data rises to ∼1.57 within this region, indicating a kinematically cool region more like a disc.
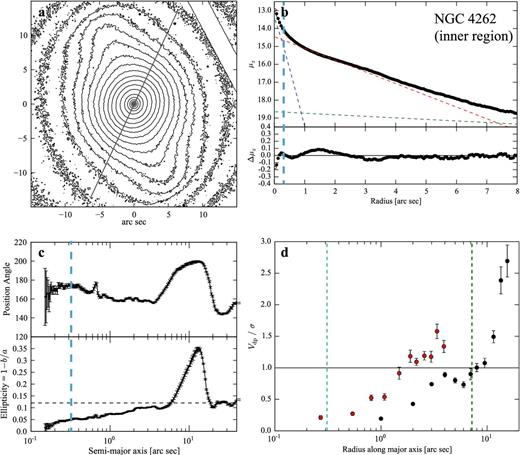
The classical bulge inside the discy pseudo-bulge of NGC 4262. (a) Close-up of main photometric-bulge region from HST ACS-WFC F850LP image; grey line marks major-axis PA. (b) Major-axis profile from the HST image, with fit (Sérsic + exponential; dashed lines) and residuals from fit in lower subpanel. The vertical dashed blue line marks inner ‘bulge=disc’ radius Rbd, i. (c) Ellipse fits to the HST image; note that the ellipticity in the inner photometric-bulge region (a ≲ 0.32 arcsec is ∼0.05, less than that of the discy pseudo-bulge outside. (d) Deprojected, folded stellar rotation velocity divided by local velocity dispersion Vdp/σ along the major axis. The vertical dashed blue and green lines mark the inner and main photometric-bulge regions |R| < Rbd, i, respectively. Although there is essentially no kinematic data for the inner photometric-bulge region, the fact that Vdp/σ is below 1 for r < 1.8 arcsec suggests that the latter is almost certainly kinematically hot (i.e. a classical bulge).
Closer inspection of the ACS-WFC isophotes shows that the isophotes become gradually rounder interior to the stellar nuclear ring, reaching values of ∼0.05 before PSF effects dominate (Fig. A8). Decomposition of the inner major-axis profile (panel b of Fig. A8) shows a small central excess, reasonably well fit by a Sérsic component with n ∼ 0.9. Stellar kinematics with the necessary resolution for this inner photometric-bulge region (r < 0.32 arcsec) are unavailable; however, the fact that Vdp/σ is <1 for radii ≲ 2 arcsec suggests that the inner stellar kinematics are probably dispersion dominated, and that the central photometric excess corresponds to a (very compact) classical bulge.
A5 NGC 4699
This is a luminous, intermediate-type (Sb) spiral galaxy with a very extended, type III outer disc (Erwin et al. 2008). In our analysis, we ignore the very outer part of this disc (visible in the azimuthally averaged profile of Erwin et al. at r ≳ 120 arcsec), and so our ‘outer’ decomposition (panel b of Fig. A9) is restricted to r < 120 arcsec. This fit yields a significant photometric bulge which dominates the light at r ≲ 45 arcsec; this clearly corresponds to what Sandage & Bedke (1994) call ‘the bulge’ of this galaxy.
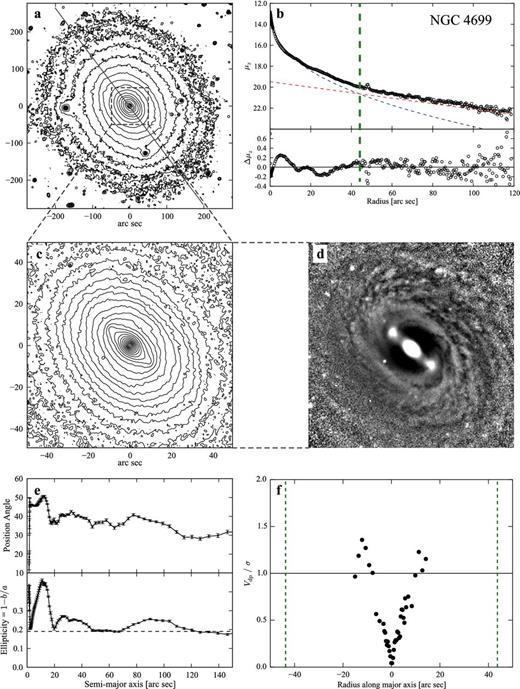
The discy pseudo-bulge in the Sb galaxy NGC 4699. (a) Log-scaled i-band isophotes (SDSS image, smoothed with 15-pixel-wide median filter); grey line marks major axis (PA =37°). (b) Bulge-disc decomposition of SDSS z-band major-axis profile. The dashed lines represent Sérsic + exponential fit to the data, with residuals plotted in lower subpanel. The vertical dashed green line marks ‘bulge=disc’ radius Rbd, where the Sérsic and exponential components are equally bright; this sets the boundary of the ‘photometric bulge’. (c) Close-up of photometric-bulge region (log-scaled contours from SDSS z-band image, smoothed with 3-pixel-wide median filter). (d) Unsharp mask of the z-band image (σ = 20 pixels), showing the bar and spiral immediately structure outside it. (e) Ellipse fits to the SDSS i-band image; note that the ellipticity in the photometric-bulge region remains essentially unchanged from the outer-disc value (horizontal dashed line), except for the peak associated with the bar, indicating the photometric bulge has flattening similar to the outer disc. (f) Deprojected stellar rotation velocity divided by local velocity dispersion Vdp/σ along the major axis, using long-slit data from Bower et al. (1993). The vertical dashed lines mark the photometric-bulge region |R| < Rbd. Although the kinematics do not extend very far out from the centre, Vdp/σ does rise to ∼1.35 within this region, indicating a kinematically cool region more like a disc.
Inspection of the photometric-bulge region shows that it is as elliptical as the outer disc, or even more so (panels c and e of Fig. A9), and is dominated by tightly wrapped spiral arms and a relatively strong bar (panels c and d of the same figure). Although the long-slit stellar kinematics of Bower et al. (1993) only extend to r ∼ 20 arcsec, they clearly show that Vdp/σ reaches values >1 in the photometric-bulge region, so we are confident in identifying a discy pseudo-bulge in NGC 4699.
Fig. A10 shows the previously identified photometric-bulge region. In the case of this galaxy, the major axis is close to the bar's major axis, but this produces only a very weak bump in the major-axis profile, similar to that due to spiral structure further out, so we do not include a separate component for the bar. The resulting fit (including two exponential components for the outer disc) is rather good, with a clear inner excess (modelled as a Sérsic component with n = 1.4) creating an inner photometric-bulge zone with Rbd, i = 2.8 arcsec. The stellar kinematics from the ground-based data of Bower et al. (1993) suggest a relatively low value of Vdp/σ within Rbd, i, and the SINFONI AO data appear to confirm this, since the SINFONI Vdp/σ values reach a plateau of only ∼0.5. Strictly speaking, we cannot rule out the possibility that Vdp/σ might reach values ∼1 between r ≈ 1.5 and 3 arcsec, since this is beyond the range of our SINFONI data but within a region where seeing effects might reduce Vdp/σ from the ground-based data. None the less, we suggest that the inner photometric-bulge region of NGC 4699, associated with very round isophotes (panel c of Fig. A10) and Vdp/σ values ≲ 0.5, is most likely another example of a compact classical bulge.
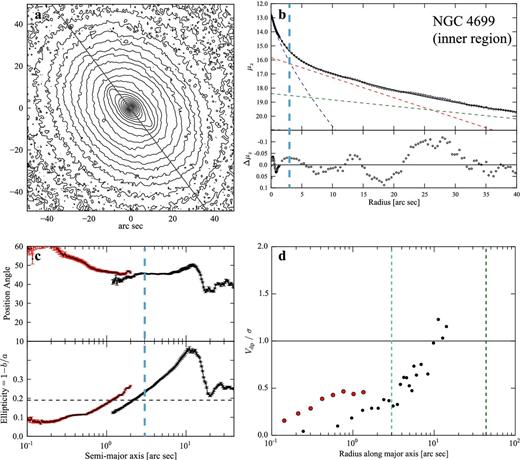
The classical bulge inside the discy pseudo-bulge of NGC 4699. (a) Close-up of main photometric-bulge region from SDSS z-band image; grey line marks major-axis PA. (b) Major-axis profile combining data from SINFONI K-band image (r < 1.3 arcsec) and SDSS z- and i-band images, with fit (Sérsic + multiple exponentials; dashed lines) and residuals from fit in lower subpanel. The vertical dashed blue line marks inner ‘bulge=disc’ radius Rbd, i. (c) Ellipse fits to the SINFONI K-band (red) and SDSS z-band images; note that the ellipticity in the inner photometric-bulge region (a ≲ 3 arcsec) is ≲ 0.15, less than that of the discy pseudo-bulge outside. (d) Deprojected, folded stellar rotation velocity divided by local velocity dispersion Vdp/σ along the major axis, using long-slit data from Bower et al. (1993; black) and SINFONI AO data (red). The vertical dashed blue and green lines mark the inner and main photometric-bulge regions |R| < Rbd, i, respectively. In the inner region (r ≲ 3 arcsec), Vdp/σ remains well below 1, suggesting a kinematically hot region (i.e. a classical bulge).
Our decomposition and identification of the classical bulge is similar to that of Weinzirl et al. (2009), who performed a 2D bulge/bar/disc decomposition of an H-band image of NGC 4699 from the OSU Bright Spiral Galaxy Survey (BSGS; Eskridge et al. 2002). (Inspection of the OSU-BSGS H-band image shows that the main disc of the galaxy is not visible in that image, so Weinzirl et al. treated the discy pseudo-bulge as the galaxy's only disc.) They found a bulge with n = 2.08 and re = 2.62 arcsec – values within ∼35 per cent of the corresponding values from our fit.
A6 Ambiguous Case: NGC 1068
In most respects, the Sb galaxy NGC 1068 appears to be similar to the previous composite-bulge galaxies: it has a large, discy pseudo-bulge combined with a much smaller central component. The sole ambiguity concerns the morphology of the central component – is it rounder than the galaxy disc, or is it more of a nuclear disc? – and stems from uncertainty about the galaxy's inclination.
Both Schinnerer et al. (2000), using H i data, and Davies et al. (2007), using stellar kinemetry analysis of their SINFONI data, suggest an inclination of ≈40°, which implies an observed ellipticity of ≈0.22 for an early-type disc. On the other hand, Gutiérrez et al. (2011) used SDSS images and found an outer-disc ellipticity of ∼0.14, implying an inclination of ∼31°. Since, as we will see below, the inner component has an ellipticity of ∼0.15, the question of whether the inner component is disc-like or spheroidal depends on the adopted galaxy inclination – thus, we consider this galaxy a somewhat ambiguous case, though we include it with the other composite-bulge galaxies in our analysis.
A6.1 Discy pseudo-bulge
Our global analysis of NGC 1068's surface-brightness profile uses the light at r ≲ 100 arcsec and is very similar to that carried out by Shapiro et al. (2003) for this galaxy (their fig. 2). As both Pohlen & Trujillo (2006) and Gutiérrez et al. (2011) showed, there is considerable stellar light further out in a shallower profile, much of which is due to the outer pseudo-ring. The global fit for this galaxy is thus similar to those for NGC 3945 and NGC 2859, where we deliberately exclude light due to extended outer rings.
The decomposition (Fig. A11, panel b) is relatively straightforward, and the resulting photometric bulge has Rbd = 24 arcsec. The morphology interior to this radius is strikingly disc-like: the near-IR stellar light is dominated by the very strong (inner) bar first noted by Scoville et al. (1988), with star-forming spiral arms forming a pseudo-ring just outside the bar (panels c and d); due to this bar, the isophotes have an ellipticity much higher than that of the outer disc (panel e).
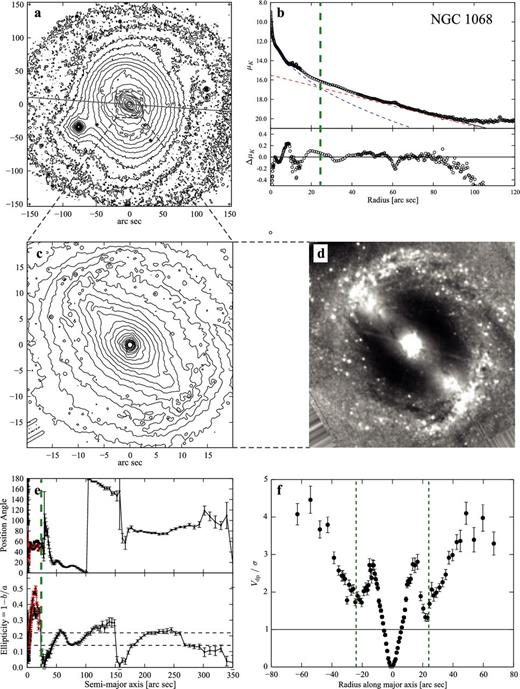
The discy pseudo-bulge in the Sb galaxy NGC 1068. (a) Log-scaled i-band isophotes (SDSS image, smoothed with 7-pixel-wide median filter); grey line marks major axis (PA =86°). (b) Bulge-disc decomposition of major-axis profile (profile combines AGN-subtracted SINFONI data from Davies et al. (2007) for r < 1.3 arcsec, HST NICMOS3 F200N for r = 1.3–15 arcsec, 2MASS K band for r = 15–42 arcsec, SDSS i band for r > 42 arcsec). The dashed lines represent Sérsic + exponential fit to the data, with residuals plotted in lower subpanel. The vertical dashed green line marks ‘bulge=disc’ radius Rbd, where the Sérsic and exponential components are equally bright; this sets the boundary of the ‘photometric bulge’. (c) Close-up of photometric-bulge region (log-scaled contours from NICMOS3 image). (d) Unsharp mask (σ = 20 pixels) of same region, showing bar and spiral arms. (e) Ellipse fits to SDSS i (black) and NICMOS (red) images. (f) Deprojected stellar rotation velocity divided by local velocity dispersion Vdp/σ along major axis, using long-slit data from Shapiro et al. (2003). The vertical dashed lines mark the photometric-bulge region |R| < Rbd; Vdp/σ rises to almost 3 in this region.
The long-slit stellar-kinematic data of Shapiro et al. (2003) show Vdp/σ > 1 at all radii ≳ 1 arcsec, and in fact the ratio reaches a value of almost ∼3 at r ∼ 15 arcsec (panel f), so this an even more extreme case of a photometric bulge with disc-like kinematics than NGC 3945. We are certainly not the first to suggest that the kinematics in this part of the galaxy are more disc-like than bulge-like: in particular, Emsellem et al. (2006) pointed this out using 2D stellar kinematics from the SAURON instrument, in conjunction with N-body/hydrodynamical modelling.
A6.2 Nuclear disc or classical bulge?
Optical and near-IR images of NGC 1068 are strongly contaminated by light from the bright AGN. To get around this problem, we make use of an H-band image from the 100 mas SINFONI observations (1.5 arcsec field of view) of Davies et al. (2007), where the AGN emission (assumed to come mostly from hot dust in the circumnuclear torus) has been spectroscopically modelled and removed, leaving behind a ‘pure stellar’ continuum which is then collapsed along the wavelength axis to form an image. We matched the surface-brightness profile extracted from this image to a profile from a larger scale HST NICMOS3 F200N image.
For the stellar kinematics, we supplement the large-scale (but low spatial resolution) data of Shapiro et al. (2003) with data from the Gemini GMOS IFU observations of Gerssen et al. (2006), which had a seeing of FWHM =0.5 arcsec, and with the VLT-SINFONI kinematics of Davies et al. (2007), observed in AO mode with a corrected FWHM of 0.10 arcsec.
We perform our inner decomposition by choosing a PA which avoids most of the inner bar (PA =137°, perpendicular to the bar). Since the galaxy is seen at a relatively low inclination, the projection effects are relatively small; however, this does mean that our decomposition does not exactly mirror the major-axis stellar kinematics.
Comparison of the NICMOS3 image with the PA =137° profile shows that the increase in surface brightness starting at r ∼ 6 arcsec is actually due to the profile crossing into the bright part of the bar, along its minor axis. Since we consider bars to be disc phenomena, this excess light should be treated as part of the discy pseudo-bulge. There is a second, much steeper increase in the profile which sets in for r ≲ 1 arcsec, associated with rounder isophotes; this is the best candidate for an embedded bulge.
Our best fit to the surface-brightness profile thus uses three components: an exponential for the main part of the pseudo-bulge outside the bar itself (in analogy with large-scale bars, one could perhaps call this a ‘lens’); a Gaussian for the minor axis profile of the bar;12 and a Sérsic for the innermost component. The innermost (Sérsic) component corresponds to the ‘extra emission’ at r < 1 arcsec noted by Davies et al. (2007), although we identify their 1–5 arcsec ‘R1/4 bulge’ profile as being due to the inner bar, not to a larger scale bulge. The final Re value recorded in Table 4 for this Sérsic component has been corrected to its major-axis value assuming an ellipticity of 0.15, based on the ellipse fits (Fig. A12).
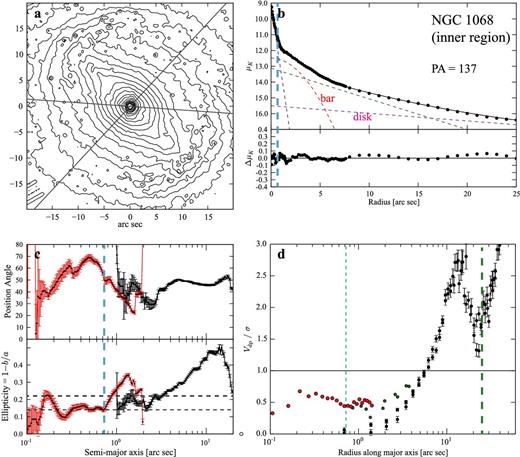
Evidence for a possible classical bulge inside the discy pseudo-bulge of NGC 1068. (a) Close-up of main photometric-bulge region from HST NICMOS3 F200N image; grey lines marks major-axis PA (86°) and PA perpendicular to inner bar (137°). (b) Profile at 137° from AGN-subtracted SINFONI H-band image of Davies et al. (2007) (r < 1.7 arcsec) and NICMOS3 F200N image, with fit (Sérsic + Gaussian + exponential + exponential; dashed lines) and residuals from fit in lower subpanel. The vertical dashed blue line marks inner ‘bulge=disc’ radius Rbd, i. (c) Ellipse fits to the SINFONI (red) and NICMOS3 (black) images; the two estimates for the outer-disc ellipticity (0.13 and 0.22) are marked by the horizontal black and grey lines. (d) Deprojected, folded stellar rotation curve divided by local velocity dispersion Vdp/σ along the galaxy major axis. Data from Shapiro et al. (2003, black), GMOS IFU kinematics of Gerssen et al. (2006, green) and SINFONI IFU kinematics of Davies et al. (2007, red).
As in the other galaxies, the Vdp/σ profile shows dispersion-dominated stellar kinematics in the inner r < Rbd, i region: Vdp/σ reaches a maximum of only ∼0.7.
Is the innermost component a compact classical bulge, or is it something more disc-like? Davies et al. (2007) argued for a disc, and suggested (based on indirect arguments about the estimated M/L of the inner component) that its stellar population was relatively young: ∼300 Myr. If we adopt an inclination of 31° for the galaxy, then the inner ellipticity of ∼0.15 is consistent with that of a disc having a flattening similar to the outer disc's.
However, Crenshaw & Kraemer (2000) and Storchi-Bergmann et al. (2012) have both presented high-resolution spectroscopic evidence – including fits to the near-nuclear spectra – indicating that the r < 1 arcsec region is actually dominated by old stars, with an age of at least 2 Gyr according to Crenshaw & Kraemer's optical STIS spectroscopy, and an age of 5–15 Gyr according to the near-IR spectroscopy of Storchi-Bergmann et al. If we combine this with the dispersion-dominated kinematics and assume an inclination of 40° for the galaxy, then the central stellar component is rounder than a disc, kinematically hot, and made up of old stars – a good case for a classical bulge, albeit one with a nearly exponential profile.
A7 Possible case: NGC 1543
NGC 1543 is something of a borderline case, primarily because we do not have a good handle on the stellar kinematics. The galaxy is so close to face-on that it is difficult to determine the major axis with any accuracy, and thus long-slit data cannot really be used. (We need to know the major axis accurately in order to properly deproject the observed velocities to their major-axis, edge-on values.) The only available stellar kinematics are two long-slit observations by Jarvis et al. (1988). Since both their ‘major-axis’ and ‘minor-axis’ profiles (at PA of 90° and 0°, respectively) show stellar rotation, all we really can say is that the major axis is not close to 0° or 90°. Thus we are unable to perform a proper kinematic analysis for NGC 1543.
None the less, the morphology of the galaxy is very suggestive of a composite-bulge system (Fig. A13). Full details of the discy pseudo-bulge decomposition, including analysis of the structure of the inner bar, will be presented elsewhere (Erwin, in preparation a); see Erwin (2011) for a preliminary discussion. Because the major axis of the inner bar is relatively close to the minor axis of the outer bar, we use a profile along the PA of the inner bar for our decomposition (as in the case of NGC 2859; see Section A2).
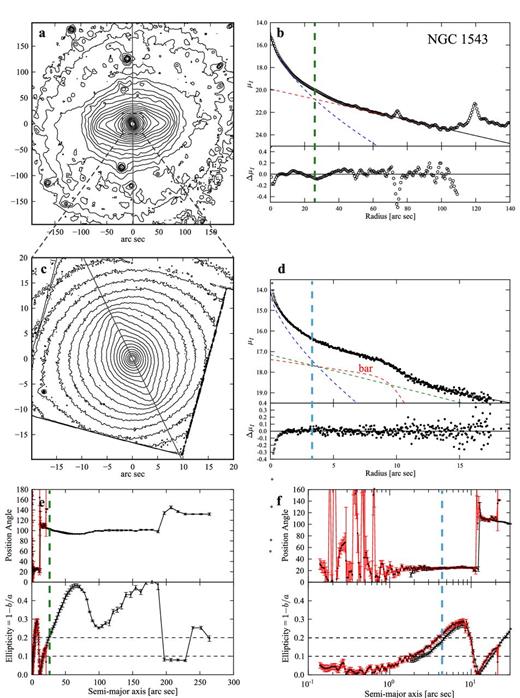
Photometric and morphological evidence for a possible composite bulge in the SB0 galaxy NGC 1543. (a) Logarithmically scaled isophotes from Spitzer IRAC2 image. (b) Bulge-disc decomposition of major-axis IRAC2 profile. The dashed lines represent Sérsic + exponential fit to the data, with residuals plotted in lower subpanel. The vertical dashed green line marks ‘bulge=disc’ radius Rbd. (c) Close-up of photometric-bulge region (WFPC2 F814W image). (d) Profile from WFPC2 image (r < 18 arcsec) and IRAC2 image (r > 18 arcsec) along the inner bar's major axis (PA =26°), fit using Sérsic + broken exponential (red, inner bar) + exponential fit (fit also includes outer-disc exponential component, not visible here); the vertical dashed blue line marks inner ‘bulge=disc’ radius Rbd, i. (e) Ellipse fits to Spitzer IRAC2 data (black) and HST-WFPC2 F814W data (red). (f) Same as panel (e), but on a logarithmic semimajor-axis scale.
Fig. A13 summarizes both the global, ‘naive’ bulge/disc decomposition (panel b) and the inner, composite-bulge decomposition (panel d). We construct our surface-brightness profile using an HST WFPC2 F814W image at small radii and a Spitzer IRAC2 image at large radii (we use the IRAC2 image instead of the IRAC1 image because the galaxy position on the former is slightly better for purposes of measuring the sky background). Excluding the broad outer ring (similar to those of NGC 2859 and NGC 3945), a decomposition of the inner ∼100 arcsec (panel a) yields a photometric bulge with n = 1.6, re = 9.4 arcsec and Rbd ≈ 26 arcsec; this is similar to, but slightly larger than, the ‘pseudo-bulge’ reported by Fisher & Drory (2010) from their 1D IRAC1 decomposition (n = 1.51, re = 6.5 arcsec). The photometric-bulge region thus defined (r ≲ 26 arcsec) is dominated by a very strong inner bar, with a very weak stellar nuclear ring surrounding it (Erwin, in preparation a). We take this as strongly suggestive evidence for a discy pseudo-bulge, though as noted above we lack the necessary kinematic data for full confirmation.
In the central regions, the isophotes become very round (panels c and f of Fig. A13), and there is a central excess of light above the inner bar. Simultaneous decompositions along the major and minor axes of the inner bar support the presence of an inner Sérsic component with n = 1.5, re = 2.7 arcsec and ellipticity ≲ 0.05 (panel d of the figure shows the decomposition along the inner bar major axis). So there is morphological and photometric evidence for a distinct, classical-bulge-like component in the centre of this galaxy as well. There is in addition evidence for a very compact, distinct feature inside the classical bulge, which is probably a NSC (see Erwin 2011; Erwin, in preparation a).
A8 The uncertain case of NGC 3489
Nowak et al. (2010) considered two cases of composite-bulge galaxies: the double-barred spiral NGC 3368 and the barred S0 galaxy NGC 3489. Although we confirm the previous classification of NGC 3368 (see Section A3, above), NGC 3489 has proved to be more ambiguous (Fig. A14).
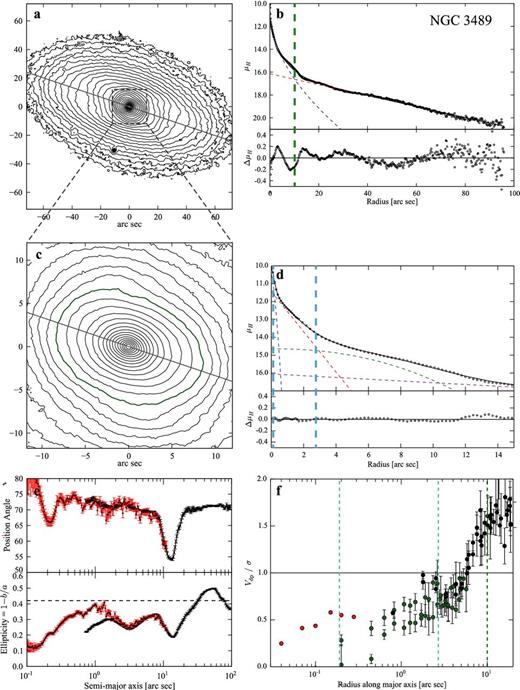
Possible kinematically hot, discy pseudo-bulge in the S0 galaxy NGC 3489. (a) Log-scaled INGRID H-band isophotes (smoothed with 9-pixel-wide median filter); grey line marks major axis (PA =71°). (b) Bulge-disc decomposition of major-axis profile, from H-band and WFPC2 F814W images. The dashed lines show Sérsic + exponential fit, with residuals in lower subpanel. The vertical dashed green line marks Rbd. (c) Close-up of photometric-bulge region; thick green contour shows approximate location of bar's projected B/P structure. (d) Decomposition of inner major-axis profile, using outer exponential + Sérsic (for B/P structure) + inner exponential + inner Sérsic; residuals from fit are in lower subpanel. The vertical dashed blue lines indicate Rbd for the inner exponential and the inner Sérsic components. (e) Ellipse fits to H-band image (black) and WFPC2 F814W image (red); horizontal dashed line indicates outer-disc ellipticity. (f) Deprojected stellar rotation velocity divided by local velocity dispersion Vdp/σ along the major axis, using SAURON data (black) from Emsellem et al. (2004), OASIS data (green) from McDermid et al. (2006) and SINFONI AO data from Nowak et al. (2010). The vertical dashed lines mark the previously identified photometric-bulge regions |R| < Rbd.
Careful analysis of the isophotes of NGC 3489 suggests that the broad, slightly boxy region inside the bar may well be an example of a projected B/P structure (outlined isophote in panel a of Fig. A14), even though Erwin & Debattista (2013) did not classify this galaxy as such. The presence of a B/P structure certainly does not prevent the simultaneous existence of a composite bulge in this galaxy – indeed, Section 8.4 argues that NGC 3368 has a clear B/P structure in addition to its composite bulge – but it does mean that the major-axis decomposition in Nowak et al. (2010) needs to be revised, since what they considered to be the inner-disc component, dominating the major-axis light from ≈4–12 arcsec, is more likely to be a combination of the B/P structure and the lens region immediately outside the bar.
For our revised inner decomposition (panel d of Fig. A14), we include the contribution from the outer-disc component (panel b) and treat the B/P structure as a separate component with a Sérsic profile; we also include an additional Sérsic component for the nuclear luminosity excess which Nowak et al. (2010) modelled with a Gaussian. The resulting fit has an inner exponential with scalelength ∼55 pc, corresponding to the original ‘classical-bulge’ component in Nowak et al. (2010), as well as an extremely compact Sérsic component with n = 0.7 and Re = 0.19 arcsec. The Rbd radii for these two components are 2.7 and 0.2 arcsec, respectively.
As shown by the ellipticity plot (panel e), the inner exponential component, which dominates the light at r ≲ 2.7 arcsec, is in fact highly elliptical – almost as elliptical as the outer disc. This is very similar to the discy pseudo-bulges identified in our other galaxies. On the other hand, the stellar kinematics in this region (panel f) are rather dispersion dominated, with Vdp/σ ∼ 0.7; even at the outer edge of this region, Vdp/σ is never larger than ∼0.9. So this structure is both flattened like a disc and at the same time kinematically hot, making it unlike any of the discy pseudo-bulges in the other galaxies of our sample.
The innermost (Sérsic) component is associated with rounder isophotes and a lower Vdp/σ value, but it is so small13 that it could more plausibly be classified as a NSC than as a genuine classical bulge.
We are thus left with a curiosity: our revised analysis identifies a structure in NGC 3489 which morphologically resembles a discy pseudo-bulge, but is kinematically hot, along with a distinct nuclear component that might best be classified as a NSC. NGC 3489 may thus be a kind of transition object, and an indication that the central regions of early-type disc galaxies can be even more diverse and complicated than our main ‘composite-bulge’ argument suggests.
APPENDIX B: WHT-ISIS SPECTROSCOPY
We obtained long-slit spectroscopy of NGC 2959 with the ISIS spectrograph of the WHT on 2000 December 13, using the blue arm with the R600B grating; further details of the observing setup are listed in Table B1. Because the galaxy was large enough to fill most of the slit, we obtained a separate 900 s exposure of the nearby blank sky, offset 6 arcmin to the east of the galaxy centre. We also observed two kinematic standard stars (HR941 and HR2660) with the same setup.
WHT-ISIS instrumental setup.
| Parameter | NGC 2859 | NGC 4371 |
|---|---|---|
| Date | 2000 Dec. 13 | 2001 June 4 |
| Grating (lines mm− 1) | R600B | R600B |
| Central wavelength (Å) | 5498 | 5498 |
| Detector | EEV12 | EEV12 |
| Pixel binning | 1 × 1 | 1 × 1 |
| Scale (arcsec pix−1) | 0.36 | 0.36 |
| Reciprocal dispersion (Å pix−1) | 0.45 | 0.45 |
| Slit width (arcsec) | 0.93 | 1.2 |
| Slit length (arcmin) | 4.0 | 4.0 |
| Slit PA (°) | 85 | 92 |
| Instrumental σ (km s−1) | 60 | 60 |
| Seeing FWHM (arcsec) | 1.0 | 1.0 |
| Galaxy exposure | 3×1200 s | 3000 s + |
| 2×2400 s | ||
| Sky exposure | 900 s | 1200 s |
Notes. Instrumental setup for the blue arm of the WHT-ISIS spectrograph, as used for observations of NGC 2859 and NGC 4371.
NGC 4371 was observed with an almost identical instrumental setup as part of ING service-time observations on 2001 June 4 (see Table B1). A separate 1200 s sky exposure was taken with a 3 arcmin offset to the north of the galaxy centre, and observations of four kinematic standard stars (HR5200, HR5966, HD5340 and HR5340) were also obtained.
Following standard midas14 reduction of the ISIS observations, including bias subtraction, flat-fielding and wavelength calibration using CuAr and CuNe+CuAr lamp exposures, the extracted galaxy spectra were analysed using the Fourier Correlation Quotient method (Bender 1990; Bender, Saglia & Gerhard 1994) in order to determine the stellar kinematics. The resulting kinematic values – radial velocity, velocity dispersion and the Gauss–Hermite coefficients h3 and h4 – are presented in Table B2.
WHT-ISIS majoraxis stellar kinematics for NGC 2859 and NGC 4371.
| Galaxy | PA | R | V | σ | h3 | h4 |
|---|---|---|---|---|---|---|
| (°) | (arcsec) | (km s−1) | (km s−1) | |||
| NGC 2859 | 85 | −14.70 | 1554.6 ± 39.5 | 203.1 ± 35.2 | −0.124 ± 0.081 | −0.072 ± 0.149 |
| NGC 2859 | 85 | −9.03 | 1586.1 ± 32.6 | 194.3 ± 28.1 | −0.125 ± 0.067 | −0.026 ± 0.120 |
| NGC 2859 | 85 | −6.03 | 1552.8 ± 13.4 | 160.4 ± 10.3 | −0.083 ± 0.050 | −0.019 ± 0.065 |
| NGC 2859 | 85 | −4.50 | 1575.0 ± 11.2 | 151.2 ± 8.2 | −0.076 ± 0.044 | 0.085 ± 0.057 |
Notes. Stellar kinematics along the major axes of NGC 2859 and NGC 4371, as determined from spectra obtained with WHT-ISIS; see Table B1 for the instrumental setup. This table is published in its entirety in the online edition of this paper; a sample is provided here for guidance in terms of form and content.
SUPPORTING INFORMATION
Additional Supporting Information may be found in the online version of this article:
Table B2. WHT-ISIS major-axis stellar kinematics for NGC 2859 and NGC 4371 (Supplementary Data).
Please note: Oxford University Press are not responsible for the content or functionality of any supporting materials supplied by the authors. Any queries (other than missing material) should be directed to the corresponding author for the paper.
