


Abstract
Several prognostic models for overall survival (OS) have been developed and validated in men with metastatic castration-resistant prostate cancer (mCRPC) who receive first-line chemotherapy. We sought to develop and validate a prognostic model to predict OS in men who had progressed after first-line chemotherapy and were selected to receive second-line chemotherapy.
Data from a phase III trial in men with mCRPC who had developed progressive disease after first-line chemotherapy (TROPIC trial) were used. The TROPIC was randomly split into training (n = 507) and testing (n = 248) sets. Another dataset consisting of 488 men previously treated with docetaxel (SPARC trial) was used for external validation. Adaptive least absolute shrinkage and selection operator selected nine prognostic factors of OS. A prognostic score was computed from the regression coefficients. The model was assessed on the testing and validation sets for its predictive accuracy using the time-dependent area under the curve (tAUC).
The nine prognostic variables in the final model were Eastern Cooperative Oncology Group performance status, time since last docetaxel use, measurable disease, presence of visceral disease, pain, duration of hormonal use, hemoglobin, prostate specific antigen, and alkaline phosphatase. The tAUCs for this model were 0.73 (95% confidence interval [CI] = 0.72 to 0.74) and 0.70 (95% CI = 0.68 to 0.72) for the testing and validation sets, respectively.
A prognostic model of OS in the postdocetaxel, second-line chemotherapy, mCRPC setting was developed and externally validated. This model incorporates novel prognostic factors and can be used to provide predicted probabilities for individual patients and to select patients to participate in clinical trials on the basis of their prognosis. Prospective validation is needed.
A number of therapeutic options that prolong life have been developed in the recent past for men with metastatic castration-resistant prostate cancer (mCRPC). Despite and, in fact, because of this, risk and prognosis assessment remain a critically important task ( 1–7 ).
Treatment choice is based on the clinical and biologic heterogeneity of the disease as well as the spectrum of comorbidities, age, and disease burden of men across a range of mCRPC disease states. Considerable effort has been dedicated to understanding tumor heterogeneity and developing prognostic models of clinical outcomes in men with CRPC who receive first-line chemotherapy ( 8–10 ). Several prognostic factors of overall survival (OS) in men with mCRPC who receive first-line chemotherapy have been identified, including lactate dehydrogenase (LDH), prostate-specific antigen (PSA), alkaline phosphatase, hemoglobin, performance status, presence of visceral or liver metastases, type of progression, Gleason score, age, albumin, pain, PSA doubling time, number of metastatic sites, and circulating tumor cell enumeration ( 8–12 ).
There is, however, scarce information concerning prognostic factors in men who have already received front-line chemotherapy and who subsequently go on to receive additional therapy. Armstrong and colleagues identified 10 prognostic factors of OS based on men who progressed after first-line systemic chemotherapy ( 11 ). Because this analysis was undertaken in a group of patients who largely predated the availability of standard second-line chemotherapy or other approved therapies such as enzalutamide, abiraterone acetate, or radium-223, the resultant model is less useful for patients being contemporarily treated, with a potential underestimation of OS estimates.
After front-line therapy with docetaxel, the standard (US Food and Drug Administration and European Medicines Agency approved) second-line chemotherapeutic approach is the use of cabazitaxel. Presently, there are no models that adequately assess the prognoses for patients with mCRPC who were previously treated with docetaxel and who are to be treated with cabazitaxel. The objective of this analysis was to develop and validate a prognostic model that could be used to predict OS probability in men with mCRPC who failed first-line chemotherapy. An independent dataset was used to externally validate this prognostic model.
Methods
Patients
Data from the TROPIC trial, a randomized, open-label, multicenter, phase III trial of 755 men with mCPRC who were previously treated with a docetaxel-containing regimen was used ( 1 ). Participants were randomly assigned to receive either 12mg/m 2 of mitoxantrone plus 10mg of oral prednisone daily (M+P) or 25mg/m 2 of cabazitaxel plus prednisone (C+P). Eligible patients had progressive mCRPC after treatment with a docetaxel-based regimen, an Eastern Cooperative Oncology Group (ECOG) performance status of 0 to 2, and adequate hematologic, hepatic, renal, and cardiac function. Details of the eligibility and baseline characteristics have been previously reported ( 1 ).
In addition, a subset of 488 men previously treated with docetaxel who were randomly assigned to satraplatin and prednisone or placebo and prednisone was also used for external validation. The SPARC trial was a double-blind, placebo-controlled study comparing the efficacy and safety of satraplatin plus prednisone vs placebo plus prednisone in men with mCRPC who were previously treated with one cytotoxic regimen ( 13 ). Additional information is published elsewhere ( 13 ). This analysis was approved by the Duke University Institutional Review Board.
Statistical Analysis
The primary endpoint of the analysis was OS, defined as the time from randomization to date of death of any cause. The TROPIC dataset was randomly divided into a 2:1 ratio with two-thirds of the patients assigned to the training (n = 507) set and one-third (n = 248) assigned to the testing set. In the training set, there were 507 patients, in addition to eight patients who were excluded from further analysis because they were missing more than 50% of baseline variables. Important predictors of OS were considered based on what is reported in patients who were first-line chemotherapy as well the common data elements between the two trials (TROPIC and SPARC). Seventeen variables were considered: race, age, body mass index, time on hormone, years since diagnosis, pain, ECOG performance status, presence of measurable disease, presence of bone metastases, presence of visceral metastases (defined as metastases in the lungs, liver, pancreas, and adrenal), PSA rise, PSA doubling time, time from docetaxel use to second-line chemotherapy less than 6 months (this was collected as a binary variable), number of prior chemotherapies received, hemoglobin, PSA, and alkaline phosphatase. Body mass index was defined as the ratio of weight (in kilograms) divided by the height squared (in meters). PSA doubling time was calculated as the ratio of natural log 2 /slope of log PSA by time. The slope is based on the least squares method. LDH was not evaluated because this was not collected in the TROPIC trial. Pain was measured with the present pain intensity scale, and analgesic score was computed from consumption normalized to morphine equivalents ( 14 ). Both the TROPIC and SPARC trials defined presence of pain if mean present pain intensity scale was two or greater and mean analgesic score was 10 or greater.
Seven of 17 variables had at least one missing value. We imputed missing covariables in the training set by borrowing the key notion from White and Royston but using a different modeling technique ( 15 ). Incomplete covariables depend on the observed survival time only through the cumulative baseline hazard ( 15 ). For categorical covariables, we treated the imputation problem as a classification problem and built a support vector machine model to predict the missing values. Support vector machine is preferred over logistic regression for several reasons, one of which is to avoid the choice of cutoff in logistic regression. PSA and alkaline phosphatase were highly skewed, and consequently the logarithm function was used to transform these variables.
Model Building.
Adaptive least absolute shrinkage and selection operator (ALASSO) penalty was considered for model building ( 16 , 17 ). The ALASSO was used not solely as a selection tool but also to estimate the hazard ratios (HRs) of the identified prognostic factors. Unlike other selection methods, the main advantage of ALASSO is its shrinkage property, which results in more stable variable selection ( 17 ). Furthermore, the identification of prognostic factors is not based on P values. Adaptive weights were given by the reciprocal of absolute parameter estimates from an unpenalized Cox’s model fitted with all 17 baseline covariables ( 17 ). The regularization parameter was chosen to minimize the Schwarz information criterion. The 95% confidence interval (CI) for the ALASSO was derived by adopting the perturbation method proposed by Minnier and extending their work to the Cox regression ( 18 ). We evaluated the final model for its discriminative ability in two ways. First, the time-dependent area under the curve (tAUC) was computed in the training sample ( 19 ). Second, we assessed the model for its calibration by plotting the predicted probability based on the final model vs the observed probability at 12, 15, 18, and 24 months ( 20 ). These time points were chosen because the median OS time in patients treated with cabazitaxel or abiraterone acetate is 15 months, whereas the median OS in patients treated on enzalutamide is 18 months. A risk score was computed for each patient in the training set from the estimated regression coefficients.
Validation.
To examine the prognostic ability of the fitted model, we applied the parameter estimates to the testing and validation sets. We calculated the risk score for every patient in the testing and validation sets based on the estimated regression parameters from the training set. We then evaluated its discriminative ability based on the tAUC ( 21 ). The 95% confidence interval for the tAUC was computed based on the bootstrapped method. The final model was validated with the risk score as a continuous variable.
We illustrate how the model can be used as a stratification factor at randomization or to select patients to be enrolled on a clinical trial. To assess how this model can be used as a stratification factor in randomization or to select patients in trials, different cut points from the risk score were computed from the training set based on the median (50th percentile) and tertiles (33rd and 67th percentiles).
We applied cut points of the risk score to the testing and validation sets, and patients were grouped in two ways: 1) low- (<−1.25) or high-risk groups (≥−1.25); or 2) low- (<−1.55), intermediate- (−1.55 to −1.0), or high- risk groups (≥−1.01). The final model was externally validated by the first author who did not have access to the training set. The log-rank statistic was used to test whether these two- or three-risk groups have different survival outcomes. The statistical analyses for model development and validation were performed using the R package. All test were two-sided, and results were considered statistically significant if the P value was less than .05.
Results
Table 1 presents the baseline characteristics of the 507, 248, and 488 patients in the training, testing, and validation sets, respectively. There were differences in age, presence of visceral metastases, and measurable disease between the two trials. The median age was 67 years in the TROPIC trial compared with 70 years in the SPARC trial. In addition, more patients in the TROPIC trial had measurable disease and visceral disease than patients enrolled on the SPARC trial. The median survival duration among these patients was 13.9 months (95% CI = 13.1 to 14.6), and 16.1 months (95% CI = 14.8 to 17.1) and differed statistically significantly between the TROPIC and SPARC datasets (two-sided log-rank P = .01) ( Figure 1 ). The percentages of censoring within 6 months were 0.7% and 4.9% in the TROPIC and the SPARC trials, respectively.
Baseline characteristics of patients by training, testing, and validation sets*
| Training (n = 507) | Testing (n = 248) | Validation (n = 488) | P † | |
|---|---|---|---|---|
| Age | <.001 | |||
| Median, y | 67 (62–73) | 67 (61–72) | 70 (63–75) | |
| Missing | 0 (0) | 0 (0) | 1 (0) | |
| Race | <.001 | |||
| White | 424 (84) | 207 (83) | 438 (90) | |
| Asian | 38 (7) | 20 (8) | 2 (0) | |
| Black | 27 (5) | 13 (5) | 26 (5) | |
| Other | 18 (4) | 8 (3) | 22 (3) | |
| Missing | 0 (0) | 0 (0) | 0 (0) | |
| ECOG PS | .93 | |||
| 0 | 173 (34) | 88 (35) | 175 (36) | |
| 1 | 294 (58) | 139 (56) | 260 (53) | |
| 2 | 40 (8) | 21 (8) | 47 (10) | |
| Missing | 0 (0) | 0 (0) | 6 (1) | |
| Visceral metastases | 125 (25) | 56 (23) | 82 (17) | .003 |
| Missing | 0 (0) | 0 (0) | 6 (1) | |
| Median PSA, ng/mL | 127.5 (44.6–399.9) | 164.4 (54.8–461) | 118 (40.3–370.2) | .57 |
| Missing | 9 (2) | 5 (2) | 8 (2) | |
| Measurable disease | 271 (53) | 134 (54) | 205 (42) | .003 |
| Missing | 0 (0) | 0 (0) | 0 (0) | |
| Pain‡ | 216 (43) | 94 (38) | 184 (38) | .001 |
| Missing | 82 (16) | 49 (20) | 28 (6) | |
| Progression on docetaxel <6 mo | 452 (89) | 223 (90) | 421 (86) | .16 |
| Missing | 0 (0) | 0 (0) | 0 (0) | |
| Hemoglobin, g/L | 121 (110–131) | 119 (108.5–131) | 122 (112–132) | .11 |
| Missing | 8 (2) | 5 (2) | 3 (1) | |
| Alkaline phosphatase, U/L | 139.5 (84–281.8) | 149 (88.5–283.5) | 135.5 (83.2–283.5) | .75 |
| Missing | 13 (3) | 5 (2) | 10 (2) | |
| Body mass index kg/m 2 | 27.4 (24.7–30.3) | 27.6 (24.9–30.4) | 27.2 (24.8–30.5) | .88 |
| Missing | 1 (0) | 1 (0) | 25 (5) | |
| Time on hormones, y | 3.6 (2.2–5.9) | 3.7 (2.4–5.8) | 4.2 (2.4–7.3) | <.001 |
| Missing | 17 (3) | 6 (2) | 6 (1) | |
| Time since diagnosis, y | 4.6 (2.7–7.8) | 4.4 (2.6–8) | 5.1 (2.8–8.3) | .44 |
| Missing | 39 (8) | 16 (6) | 52 (11) |
* Data are No. (%) or median (25th and 75th percentile). ECOG = Eastern Cooperative Oncology Group; PS = performance status; PSA = prostate-specific antigen.
† The P values are computed using analysis of variance F test if the covariable is continuous or χ 2 test if the covariable is categorical. All P values are two-sided.
‡ Presence of pain is indicated by a mean pain intensity score of two or greater and mean analgesic score of 10 or greater.
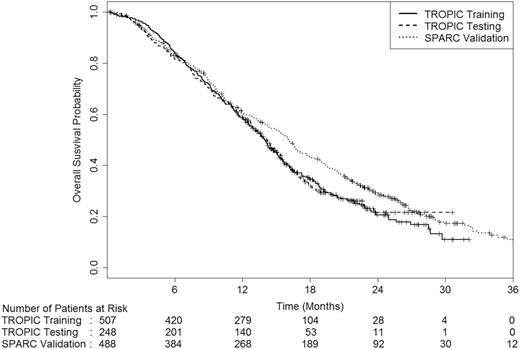
Survival distribution by the training, testing, and validation sets. The numbers of patients at risk in each group at various time points are given below the graph.
Multivariable Model
Training Sample.
Figure 2 presents the relationship between the prognostic factor and log hazard of death. There was an inverse relationship between hemoglobin and duration on hormone and death. The final model selected ECOG performance status, time since last docetaxel use, presence of measurable disease, presence of visceral disease, pain, duration of prior hormonal use, hemoglobin, PSA, and alkaline phosphatase ( Table 2 ). Patients who failed while on docetaxel therapy had a hazard ratio of dying of 1.78 vs patients who did not fail. In addition, ECOG performance status and pain were other important prognostic factors of OS.
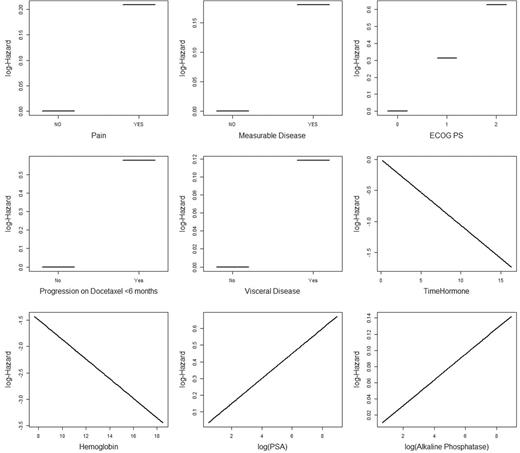
Relationship between variables in the model and log hazard of death. ECOG PS = Eastern Cooperative Oncology Group performance status; PSA = prostate-specific antigen.
Multivariable model predicting overall survival*
| Factor | Hazard ratio (95% CI) | P † |
|---|---|---|
| Pain, yes vs no | 1.23 (0.80 to 1.67) | .25 |
| Measurable disease, yes vs no | 1.20 (0.80 to 1.60) | .29 |
| ECOG PS, 2, 1, 0 | 1.37 (1.06 to 1.67) | .006 |
| Progression on docetaxel <6 mo, yes vs no | 1.78 (1.28 to 2.28) | <.001 |
| Visceral disease, yes vs no | 1.13 (0.92 to 1.33) | .21 |
| Duration on hormone, y | 0.90 (0.85 to 0.95) | <.001 |
| Hemoglobin | 0.83 (0.75 to 0.91) | <.001 |
| PSA | 1.08 (1.02 to 1.14) | .01 |
| Alkaline phosphatase | 1.02 (0.96 to 1.07) | .56 |
* CI = confidence interval; ECOG = Eastern Cooperative Oncology Group; PS = performance status; PSA = prostate-specific antigen.
† Two-sided Wald test P value.
Figure 3 presents a nomogram that is based on the continuous risk score and the estimated survival probability at 12, 15, 18, and 24 months. This model can be used to predict individual survival probability at time t. For example, consider a patient who was on hormones for 4 years, had an ECOG performance status of 0, and had alkaline phosphatase of 200, hemoglobin of 12, and PSA of 120. He did not, however, have any of the following prognostic factors: measurable or visceral disease, pain, or progress on docetaxel within 6 months. Under these conditions, his predicted survival probabilities at 18 and 24 months are 63.4% (95% CI = 35.1 to 69.1) and 47.1% (95% CI = 17.8 to 54.3), respectively. This model is available online at https://www.cancer.duke.edu/Nomogram/secondlinechemotherapy.html .
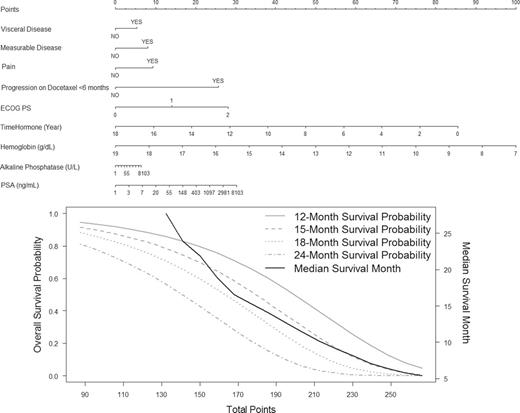
Prognostic model predicting overall survival probability. Start from the second top axis by identifying whether a patient has visceral disease. Draw a vertical line to the Points axis (top line) to represent the number of prognostic points the patients will receive for visceral disease. Do the same for the other prognostic variables. Once all prognostic points for the predictors have been determined, add up the prognostic points for each prognostic variable. Based on the total points, one can determine the 12-month survival probability by drawing a vertical line from the total points x-axis to the survival probability. The same process can be done to estimate the 15-, 18-, and 24-month survival probability or the median survival. ECOG PS = Eastern Cooperative Oncology Group performance status; PSA = prostate-specific antigen. This nomogram is available online at www.cancer.duke.edu/Nomogram/secondlinechemotherapy.html .
We evaluated the model for its discriminative ability, and the tAUC was 0.76 (95% CI = 0.75 to 0.77) in the training set. We also assessed the model for its calibration (internal validation). The predicted probabilities at 15, 18, and 24 months from the model were close to the observed probability of survival ( Figure 4 ).
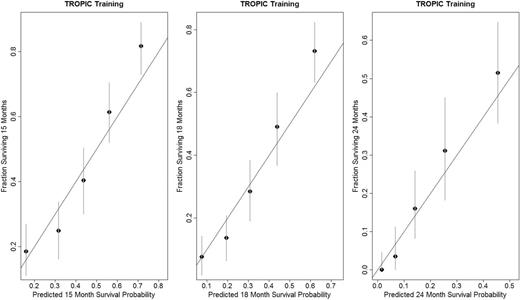
Calibration plots for the TROPIC training set at 15, 18, and 24 months.
Validation Datasets.
The final model was validated with the risk score modeled as a continuous variable in the Cox’s model in the testing and validation sets. Risk score was highly predictive of OS (two-sided Wald test P < .001), and the tAUCs for risk score were 0.73 (95% CI = 0.72 to 0.74) and 0.70 (95% CI = 0.68 to 0.72) in the testing and validation sets, respectively.
We illustrate how this risk score can be used as a stratification factor in randomization or to select patients using a categorical risk score. Applying a cutpoint of −1.25, which corresponds to 188 total points from the nomogram, patients in the testing and validation sets were classified into low- (<188 total points) and high-risk (≥188 total points) groups. There were 93 patients in the high-risk group and 102 patients in the low-risk group in the testing set, with median OS of 10.8 months (95% CI = 8.1 to 13.1) and 16.2 months (95% CI = 15.0 to 19.0), respectively (HR = 2.34; 95% CI = 1.66 to 3.32, two-sided log-rank P < .001) ( Figure 5A ). In the validation set, there were 166 and 253 patients in the high- and low-risk groups, respectively. The median OS rates were 10.5 months (95% CI = 9.5 to 12.8) and 20.1 months (95% CI = 17.9 to 21.9) in the high- and low-risk groups, respectively (HR = 2.00; 95% CI = 1.59 to 2.51, two-sided log-rank P < .001) ( Figure 5A ).
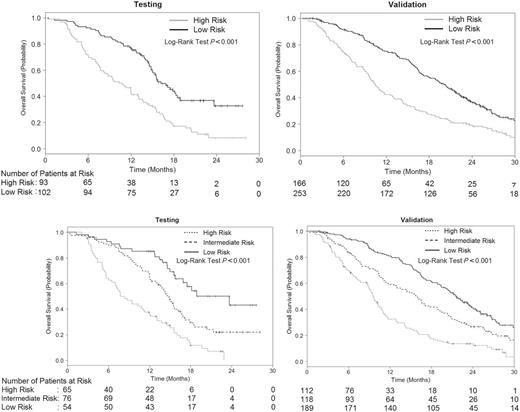
Kaplan–Meier survival curves by the two- and three-risk groups in the testing and validation sets. A ) Kaplan–Meier survival curves by the two-risk groups in the testing and validation sets B ) Kaplan–Meier survival curves by the three-risk groups in the testing and validation sets. The numbers of patients at risk in each group at various time points are given below the graphs.
Using a cut point of less than −1.55 (or <175 total points) and −1.01 and greater (≥198.81 total points), patients in the testing and validation sets were classified into low- (<175 points), intermediate- (175–198.80 points), and high-risk (≥198.81 total points) groups. There were 65, 76 and 54 patients, respectively, in the high-, intermediate-, and low-risk groups with associated median OS of 8.3 (95% CI = 7 to 12), 14.9 (95% CI = 13.2 to 16.6), and 23.7 months (95% CI = 16.9 to Not reached; two-sided log-rank P < .001) ( Figure 5B ). In the validation set, there were 112, 118, and 189 patients, respectively, in the high-, intermediate-, and low-risk groups with median OS of 9.7 (95% CI = 8.8 to 10.8), 15.9 (95% CI = 12.6 to 19.2), and 21.7 months (95% CI = 20.0 to 23.9; two-sided log-rank P < .001) ( Figure 5B ).
Finally, we wanted to evaluate the robustness of the risk score from the final model on the external set because some of the prognostic factors were not available in the TROPIC trial. Risk score was highly associated with other prognostic factors, in particular LDH in the validation set ( Figure 6 ).
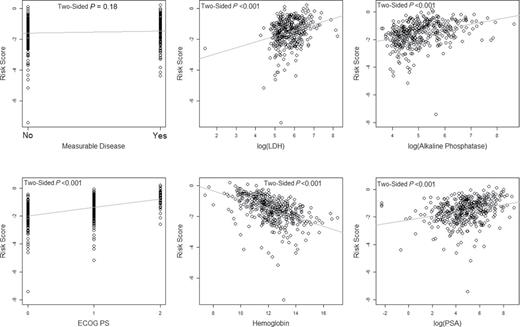
Relationship of risk score by the prognostic factors in the SPARC trial. The P values were computed by testing the regression coefficient in the respective simple linear regression model, except for the Eastern Cooperative Oncolgy Group progression status (ECOG PS) and measurable disease, which are based on the analysis of variance F test. LDH = lactate dehydrogenase; PSA = prostate-specific antigen.
Discussion
A prognostic model that can be used to stratify randomization in future randomized trials with mCRPC in the postdocetaxel setting has been developed and validated. Two new prognostic factors of OS in this group of patients have been identified: 1) time since docetaxel use and 2) duration of hormone therapy. These prognostic factors may reflect underlying tumor disease biology—more specifically broad disease sensitivity to anticancer therapies or specifically to antiandrogen therapies because taxanes are postulated to kill prostate cancer cells, at least in part, through their impact on androgen receptor signaling. This may be supported by the finding that the strongest single prognostic factor of OS was time since docetaxel use, with a hazard ratio of 1.78, followed by ECOG performance status and baseline pain. Other important prognostic factors identified were measurable disease, presence of visceral metastases, duration of hormone use, hemoglobin, PSA, and alkaline phosphatase.
Armstrong et al. developed and validated a prognostic model of OS in men who failed first-line chemotherapy ( 11 ). The Armstrong model included pre–front-line chemotherapy variables that were not collected in the TROPIC or SPARC datasets and thus cannot be evaluated. The Armstrong model was, however, developed on 63% of patients who were alive after progression on the TAX 327 trial. Although the model was internally validated, it was not externally or prospectively validated or evaluated in the context of cabazitaxel chemotherapy or other approved second-line agents such as enzalutamide, abiraterone acetate, or radium 223. Among the advantages of our model is that all patients who were prospectively randomized were included in this analysis and the data were assessed at the time of randomization and not based on historic data that may be less accurate at the time of consideration of postdocetaxel therapy. In addition, this data was externally validated and has a higher predictive accuracy than that of the Armstrong model.
This study confirms that baseline pain, alkaline phosphatase, visceral metastases, type of progression, hemoglobin, and performance status are important prognostic factors of OS ( 11 ). The difference in the parameters in the final models of these datasets may have arisen from different patient populations, different sample sizes, and different sets of assumptions made in model development. Nevertheless, both models selected variables that are representative of host factors and tumor burden. Of note, neither the Armstrong model nor this model included serum LDH levels or circulating tumor cell enumeration because these prognostic factors were not uniformly collected in the trials comprising the training or testing sets. Despite this, using the SPARC dataset indicates that LDH is highly associated with risk score.
Prognostic models will continue to be used to address important questions concerning patient survival and finding appropriate treatment strategies ( 21 ). In addition, prognostic models are often, and will continue to be, used in the design, conduct, and analysis of clinical trials ( 22–24 ). In 2013, in addition to second-line chemotherapy with cabazitaxel, there are several treatment options available for patients with mCRPC that have prolonged survival ( 1–7 ). It is anticipated that the same patient may need different prognostic models at different stages of his care pathway as more prognostic information, which may be treatment specific, accumulates.
There are several strengths of our prognostic model. First, rigorous statistical methodology was employed that included all potential variables common to both datasets in the modeling process. Penalized regression methods were used that modeled all 17 variables simultaneously and selected important prognostic factors based on their estimate of the associated regression coefficients with OS. In addition, the identification of prognostic factors was not selected based on P values. The final model was validated in a robust fashion, using a portion of the TROPIC data, and then was externally validated using the SPARC trial. Finally, the model incorporated a large number of patients with metastatic CRPC treated with contemporary standard chemotherapy.
The major limitation of this prognostic model is the fact that not all previously identified risk factors, such as LDH, were collected in these datasets and consequently were not available to be considered as a potential prognostic factor. Second, even though the censoring proportion was slightly higher in the SPARC trial compared with the TROPIC trial, it was relatively low and as such did not affect the estimation of the predictive accuracy in the validation set. Finally, it is acknowledged that there were a number of potential biological markers of survival, including circulating tumor cell count, that were also not collected and therefore not incorporated into the model.
In summary, this model has been constructed and validated within the TROPIC trial and used an external subset of data from men enrolled on SPARC trial. The prognostic factors identified are routinely collected in clinical practice and should be readily available to derive a prognostic score. For patients with mCRPC who are appropriate candidates for second-line chemotherapy, this model can be used in a clinical setting to obtain individual survival probability as well as to classify patients in risk groups based on validated cut points in future trials.
Funding
This research was supported in part by the National Institutes of Health (grant 155296-1A1).
The study sponsor had no role in the design of the study; the collection, analysis, and interpretation of the data; the writing of the manuscript; and the decision to submit the manuscript for publication.
We thank Drs Robert Sands, Evelyne Ecstein-Fraisse, and Karin Blakolmer from sanofi for providing the TROPIC data and their support.
The analysis was presented at the 2013 ASCO GU Meeting as a poster presentation (February 15, 2013; Orlando; FL) and at the 2013 Annual ASCO Meeting as a poster with discussion (Saturday June 1, 2013; Chicago, IL).
References

