


Abstract
HCV disproportionately affects marginalized communities such as homeless populations and people who inject drugs (PWID), posing a challenge to traditional health services. The HepFriend initiative in London is a model of care utilizing HCV outreach screening and peer support to link vulnerable individuals to HCV treatment in secondary care.
To assess the cost-effectiveness of the HepFriend initiative from a healthcare provider perspective, compared with standard-of-care pathways (consisting of testing in primary care and other static locations, including drug treatment centres, and linkage to secondary care).
Cost-effectiveness analysis using a dynamic HCV transmission and disease progression model among PWID and those who have ceased injecting, including housing status and drug treatment service contact. The model was parameterized using London-specific surveillance and survey data, and primary intervention cost and effectiveness data (September 2015 to June 2018). Out of 461 individuals screened, 197 were identified as HCV RNA positive, 180 attended secondary care and 89 have commenced treatment to date. The incremental cost-effectiveness ratio (ICER) was determined using a 50 year time horizon.
For a willingness-to-pay threshold of £20000 per QALY gained, the HepFriend initiative is cost-effective, with a mean ICER of £9408/QALY, and would become cost saving at 27% (£10525 per treatment) of the current drug list price. Results are robust to variations in intervention costs and model assumptions, and if treatment rates are doubled the intervention becomes more cost-effective (£8853/QALY).
New models of care that undertake active case-finding with enhanced peer support to improve testing and treatment uptake amongst marginalized and vulnerable groups could be highly cost-effective and possibly cost saving.
Introduction
HCV is a bloodborne virus that results in significant morbidity. Globally, 71 million individuals are living with chronic HCV infection and 700000 people die from HCV-related liver disease every year.1 In Europe, the number of chronic infections was recently estimated at 14 million,1 with 210000 in the UK.2,3 Early disease is asymptomatic and therefore individuals with chronic HCV present for care at late stages of the disease, which have lower survival rates due to complications such as hepatocellular carcinoma and decompensated cirrhosis.4
In 2016, the WHO called for an end to the public health threat of viral hepatitis by 2030, by reducing new infections by 90% and mortality by 65%. New direct-acting antivirals (DAAs) are highly curative [sustained viral response (SVR) >95%], short duration (8–12 weeks) and have few side effects. Since their introduction, HCV-related mortality has decreased in the UK.4 Additionally, curing HCV in people who inject drugs (PWID) could prevent further HCV transmission,5,6 making early treatment of PWID a priority that could be highly cost-effective.7
HCV disproportionately affects vulnerable and marginalized communities: not just PWID, but also prisoners and the homeless. Among these groups, travel for accessing treatment can be expensive and impractical, whilst mistrust in the health system and difficulty in navigating hospital-based care pathways are significant barriers to engaging in care.8,9 Emerging evidence focused on TB (which affects similar groups) suggests that community- and primary care-based models of treatment are effective in locating and engaging vulnerable groups through bringing health services to them that are responsive to their needs.10,11 Whilst there has been increased HCV testing in community settings in the UK, and an increase in community treatment clinics, linkage to care remains an issue. Indeed, a recent trial of a peer-based intervention found that even with peer support only 36.5% of their ‘hard-to-reach’ cohort engaged with treatment services.12
HepCare is a new model of care that links primary, secondary, outreach and community care and treatment for at-risk populations in the EU. In London, the University College London Hospital (UCLH) NHS Trust and homeless charity Groundswell are collaborating to deliver two components of HepCare: HepCheck and HepFriend. In this setting, HepCheck involves active case-finding through outreach activities to identify homeless individuals with HCV infection. HepFriend then builds on HepCheck by incorporating peer support to help individuals navigate the testing and treatment pathway from outreach to secondary care. Henceforth the intervention will be described as HepFriend.
There are a few cost-effectiveness analyses of HCV case-finding interventions,13–15 but none has included street-based outreach. This study evaluates the cost-effectiveness of the HepFriend intervention in London in addition to the standard-of-care pathway, compared with the standard-of-care pathway only.
Methods
Description of comparators
Standard-of-care pathway
The comparator testing and care pathway for vulnerable individuals in this setting would be diagnosis at a GP or drug treatment centre with either a nurse or GP undertaking dried blood spot (DBS) laboratory testing, with reflex RNA testing being done if the sample is antibody positive. Referral to hospital for specialist care and assessment for HCV treatment would then occur if the sample was RNA positive. There would also be multiple appointments for on-treatment monitoring with a specialist nurse and a post-treatment appointment to determine treatment success (sustained virological response, SVR).
HepFriend intervention pathway
The HepFriend Team, comprising two nurses and a peer worker from Groundswell (a homeless charity), undertook active case-finding for HCV via outreach activities, visiting homeless hostels, drug treatment centres and street locations (Figure S1, available as Supplementary data at JAC Online). The team visited locations either by public transport or with the specialized Find & Treat mobile screening unit. The team spent time with potential patients, building relationships, raising awareness of HCV, and then offering the opportunity of an HCV assessment. If patients accepted, risk factors were assessed and an HCV antibody (Ab) point-of-care test (POCT) was performed. If positive, then a FibroScan and DBS test were performed. If the patient had advanced fibrosis but was not RNA positive, then they were referred to their GP. Conversely, if they were RNA positive, then the patient was followed up through their mobile phone, key worker, visiting their hostel, visiting the pharmacy where they receive prescriptions or visiting street locations to find them. Once located, the team encouraged the patient to make a referral appointment at the hospital, which was done quickly to the minimize loss to follow-up. If necessary, the peer worker then accompanied the patient to hospital visits and would observe them taking their treatment, directly, over the phone or by video.
Costing analysis
The analysis was undertaken from a UK NHS and Personal and Social Services perspective, with all costs in 2018 British pounds (£1 = $1.30 USD). Costs from previous years were inflated to 2018 costs using the Health and Community Hospital Service pay and prices index.
Healthcare costs relating to HCV disease stages were taken from previous economic analyses (Table S2).7,16 For the standard of care, screening costs in primary care and drug treatment centres were taken from literature (Table 1).17,18 Costs relating to the treatment pathway in hospitals using DAAs were based on the treatment protocol for a London hospital with unit costs obtained from the NHS reference cost database (Table 1 and Table S4). Costs for opioid substitution therapy (OST) prescriptions only included drug costs.19 DAA treatments were assumed to cost the full list price.
Costs for testing, engagement and treatment in standard-of-care comparator arm
| Step in pathway of care | Baseline cost | Source |
|---|---|---|
| Costs for each test (includes staff time and test costs) | ||
| Ab negative | £46.26 (staff cost) + £7.61 (Ab test cost) | 17 |
| Ab positive | £46.26 + £7.61 + £66.00 (RNA test cost) | |
| previous known SVR (Ab positive) | £46.26 + £66.00 | |
| Costs for engagement (includes staff referral costs and preliminary blood tests and FibroScan at the hospital) | ||
| from diagnosed | £334.96 (at hospital) + £77.10 (referral cost) | 17 and personal communication, G. Foster (HCV Clinical Lead for England) |
| from lost to follow-up | 0 (no engagement from lost to follow up at baseline) | assumption |
| Costs for each treatment | ||
| treatment monitoring | £395.82 | personal communication, G. Foster (HCV Clinical Lead for England); see Supplementary data for details |
| weekly drug cost | £3248.00 | 43 |
Financial and economic costs for HepFriend for 2017/18 were collected from a provider perspective and classified as capital or recurrent. Data were gathered from UCLH and Groundswell’s financial records, salary grades and through staff interviews to record spending on capital buildings, vehicles, training and equipment costs, recurrent staff, supplies, and training costs. Both UCLH and Groundswell had already calculated the overheads used by HepCare in the development of funding applications. These figures were varied in sensitivity analyses.
Costs were then allocated to the designated ‘activities’ of HepFriend: management and administration, research, outreach sessions and mobile van outreach sessions, POCTs, RNA tests, FibroScans, follow-up of RNA positive or RNA negative clients, and peer support for different hospital visits. A bottom-up, ingredients approach was used to estimate costs for each person tested, based on recorded resource use including staff time (nurses, peer workers), van use, and diagnostic and clinical tests. Van mileage was not available, so the number of sessions that the mobile screening unit was used for HepFriend as a proportion of all sessions undertaken was used to allocate its costs to the intervention. Top-down analysis apportioned costs associated with administration and management time to activities based on measures such as staff time.
Mathematical model description
The cost-effectiveness analysis was conducted using a dynamic model that incorporates HCV transmission among PWID and disease progression in PWID and ex-injectors. The model is a deterministic compartmental model (see Supplementary data), stratified by infection, disease progression (Figure S2), treatment stages (Figure 1), injecting status (injecting or no longer injecting), whether on OST, and homelessness status (rough sleeping or in a hostel within the last year) (Figure 2).
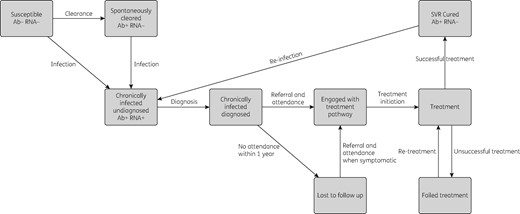
Model structure of the HCV infection and treatment processes.
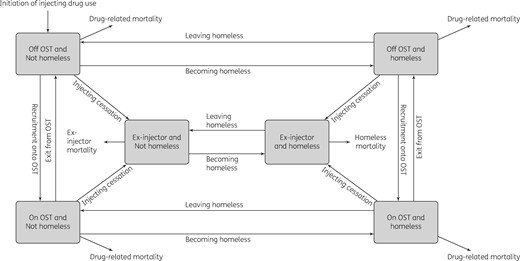
Model structure for categories of PWID and homeless individuals.
Briefly, an individual enters the model as susceptible, not homeless or on OST and can become infected at a rate dependent on the prevalence of chronic infection in the population. New infections either spontaneously clear and move to the exposed category or develop chronic infection. Chronically infected individuals can be diagnosed, and then either enter the treatment pathway or are lost to follow-up (with disease progressing over time). Engagement in the treatment pathway includes all appointments between diagnosis and initiating treatment (FibroScan, liver function tests etc.). Only those engaged in the treatment pathway can start treatment. Upon successful treatment, individuals enter a susceptible SVR state with equivalent disease progression. Re-infection can occur if they have not ceased injecting. Those who fail treatment are re-treated.
Movement between homeless and OST categories occurs at specific rates. Upon cessation of injecting, individuals become ex-injectors but may remain homeless. PWID experience drug-related mortality and the mortality of ex-injectors is dependent on their homeless status.
Model parameterization and calibration for current standard-of-care comparator
To model the cost-effectiveness of the HepFriend intervention, the first step is to parameterize the model for the current standard-of-care pathway, and following that to incorporate the effects of the intervention. The model was parameterized and calibrated to a London-specific epidemiological scenario with an estimated 41% HCV chronic prevalence among a PWID population of about 16700.4,20,21 It was assumed that 78% of PWID are on OST and 33% have been homeless in the last year.22 Data suggest OST coverage, HCV prevalence and homelessness have been stable over recent years, and so this was assumed in the model calibration.4,22 Based on a recent Cochrane review, currently being on OST was assumed to reduce the risk of HCV transmission by 59%,23 whereas recent homelessness increases the risk of HCV transmission 2.1-fold.24 Other demographic and epidemiological parameters are shown in Table 2.
Model parameters and calibration data common to comparator and intervention
| Parameter | Value | Source |
|---|---|---|
| HCV transmission | ||
| chronic HCV prevalence in 2016 | 41% (36%–46%) | Adjusted from 55% seroprevalence (50%–60%)44 assuming some have spontaneously cleared their infection. |
| risk ratio for HCV transmission and acquisition while on OST | 0.40 (0.22–0.75) | 23 |
| risk ratio for HCV transmission and acquisition while homeless | 2.10 (1.41–3.24) | 24 |
| HCV transmission rate when not homeless or on OST | varied to give HCV prevalence in 2016 | Assume HCV prevalence is stable in the population of PWID. |
| Testing | ||
| percentage of current injectors diagnosed for standard of care | 57% (52%–62%) | 44 |
| factor increase in testing rate in OST compartment compared with not being on OST | 1.22 (1.10–1.35) | Data analysed from needle exchange surveillance initiative in Scotland.25 |
| testing rate in non-OST and ex-injector compartments | varied to give proportion diagnosed shown above (57%) | Assume proportion of injectors diagnosed is stable. |
| Engagement and treatment | ||
| engagement rate from diagnosis for standard of care pathway in all compartments | 0.13 (0.09–0.18) per year | Proportion 0.12 (0.08–0.17) engaged in treatment before intervention (data from HepFriend study initial interviews). Assume this is all in the last year to get yearly rate. |
| treatment rate from engaged per year for standard-of-care pathway in all compartments | 0.34 (0.17–0.59) | Treatment rate among engaged patients from recent UK HepCATT study.18 |
| percentage of treatments that attain SVR | 93% (88%–97%) | SIMPLIFY trial among PWID.26 |
| transition rate from treatment to SVR per year | 1/(12/52) | Treatment assumed to last 12 weeks.26 |
| Demographics | ||
| population size of injectors | 16700 (12525–20875) | Operational Delivery Network Profile Tool developed by PHE.21 |
| cessation rate of injectors | 0.088 (0.053–0.125) per year | Assume mean duration 11 (8–15) years in UK.45 Assumes OST does not affect cessation rate. |
| rate of initiation of injecting | used to fit population size estimates | Assume stable population size. |
| percentage of injectors that are homeless | 33% (26%–40%) | Unlinked anonymous monitoring survey data for London.22 |
| transition rate (not homeless to homeless) | varied to give the sampled proportion of injectors that are homeless | Assume stable proportion of homeless individuals in the population. |
| transition rate (homeless to not homeless) | 1.16 (0.83–1.64) per year | Scottish cohort study found 78/145 homeless PWID were no longer homeless after 8 months.46 Transition probability sampled from β distribution (α=78, β=67) and converted into yearly rate. |
| percentage of PWID on OST | 78% (73%–83%) | Unlinked anonymous monitoring survey data for London.22 |
| transition rate (on OST to not on OST) | 1.48 (1.00–2.98) per year | Duration on OST was 8 months (4–12 months) in a cohort of PWID in UK.47 |
| transition rate (not on OST to on OST) | varied to give proportion of PWID on OST | Assume proportion of PWID on OST is stable. |
| current injector and homeless mortality | same as drug-related death rate | Meta-analysis of mortality in homeless individuals, prisoners and individuals with substance use disorders gave similar mortality ratios for individuals with drug use disorders and individuals who are homeless.48 |
| ex-injector death rate | 0.023 (0017–0.032) per year | 1/(life expectancy–age at initiation of injecting–injecting duration). |
| ex-injector homeless death rate | 0.043 (0.026–0.089) per year | Calculated as for ex-injector death rate with 19 (16–22) years less life expectancy than those who are not currently homeless.38 |
We assumed 57% of chronically infected PWID are diagnosed at the start of the HepFriend intervention,4 with current OST assumed to increase the annual likelihood of being tested by 22%.25 The testing rate amongst those not on OST was estimated though model calibration. Data collected during the HepFriend study estimated that 12% of previously diagnosed individuals had engaged with the treatment pathway, which was used to estimate an engagement rate. The subsequent standard-of-care treatment rate (28% within year of engagement) came from baseline data from a recent UK study.18 Because no SVR data were available from HepFriend, an SVR rate of 93% was assumed for sofosbuvir and velpatasvir based on data from the SIMPLIFY trial, which treated people with recent injecting drug use.26
All model parameters had uncertainty distributions associated with them (Table 2). For the model calibration, 1000 parameter sets were sampled from these distributions. For each parameter set, the model was calibrated to sampled data on the HCV chronic prevalence amongst current PWID, OST coverage and proportion diagnosed (prior to intervention), through varying the infection rate, OST recruitment rate and testing rate. Further details on the calibration process can be found in the supporting information. Each calibrated model fit was used to simulate the standard-of-care and intervention scenarios.
Intervention scenario parameterization
We modelled the intervention scenario for three years (2016–18), during which the number of people diagnosed or identified (200), engaged with the treatment pathway (198) and commencing treatment (99) was increased based on results from the HepFriend intervention (Figure 3). HepFriend data on screening dates were used to determine when people were diagnosed and engaged with the treatment pathway. Data collected at screening were used to categorize whether the screened and treated individuals were on OST, homeless or currently injecting, and their current stage of disease (determined through fibrosis score;27 see Supplementary data for details).
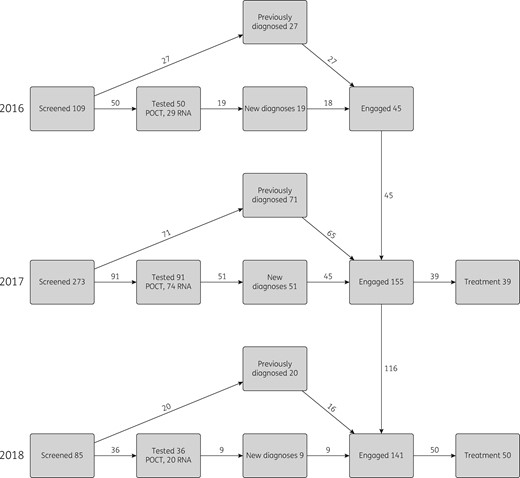
Screening and treatment done by the intervention each year. Definitions: Screened, individuals approached by the Find & Treat team, not all of whom needed testing; Tested, individuals who had a test undertaken (either POCT for antibodies or DBS test for RNA, which was sent to a laboratory); New diagnoses, found to be RNA positive through testing; Previously diagnosed, identified as already known RNA positive; Engaged, attended specialist clinic at hospital; Treatment, individuals who have commenced treatment. Numbers of individuals chronically infected were split by OST/homeless/injecting status and Metavir stage, according to responses in the screening questionnaire, to use as inputs in the mathematical model.
Utility values
Parameter estimates for health utilities and HCV disease progression rates were taken from the literature (Table S1).7,28–31 Early disease progression parameters, from Metavir state F0 through to F4, use data from a meta-analysis of studies monitoring disease progression in PWID to incorporate the higher disease progression seen in this population compared with the general population.28,31 The reduced disease progression rates once SVR is attained came from studies of IFN-based therapy as recent evidence suggests DAA-induced SVR results in changes in disease progression similar to those for IFN-induced SVR.32 We assumed that susceptible homeless PWID have the same utility as other PWID (mean 0.73).33 PWID that cease injecting are assumed to have a higher health utility than active PWID (mean 0.85 versus 0.73), whereas homeless individuals remain with a lower health utility (mean 0.76).34 Those who become infected then have health utilities related to their disease stage multiplied by their uninfected health utility. Costs and health utilities were attached to each model state and discounted at 3.5% per year.35 Health utilities are summed for the population over the time horizon to give quality-adjusted life years (QALYs).
Cost effectiveness analysis
The analysis used a 50 year time horizon (to 2066, 3 years of intervention and 47 years of follow-up) to capture long-term effects of HCV infection as well as population prevention benefits associated with treating HCV. The incremental cost-effectiveness ratio (ICER) was calculated as the difference in costs divided by the difference in QALYs between the HepFriend intervention and standard-of-care scenarios. Cost-effectiveness was determined using the UK willingness-to-pay (WTP) threshold of £20000 per QALY saved.35 The numbers of infections and disease-related deaths averted by the intervention were also calculated.
Probabilistic sensitivity analysis
Probabilistic sensitivity analysis (PSA), varying demographic and epidemic parameters, healthcare costs and health utilities randomly across specified distributions, was used to form a joint distribution of the differences in cost and QALYs for the intervention. The mean ICER was calculated using the PSA outputs. ANCOVA was conducted to determine which model parameter’s uncertainty contributed most to the variability in the incremental costs, QALYs and infections averted by the intervention.36
Sensitivity analyses
Two sensitivity analyses were conducted to test the effect of model assumptions on our cost-effectiveness projections. Firstly, we assumed all individuals identified by the intervention were newly diagnosed, rather than some being diagnosed previously and lost to follow-up. Secondly, we assumed all individuals in the model were current injectors, rather than either injectors or ex-injectors. Sensitivity analyses also tested the effect of assumptions made in the costing analysis. These included doubling or tripling overhead costs, due to the difficulty in estimating the overhead costs for this kind of intervention. Intervention start-up costs were annualized over 5 years in the base-case analysis, and we tested annualizing over 3 and 7 years in sensitivity analyses. We also tested how our projections would vary if we assumed all screening sessions used the Find & Treat mobile screening unit (50% in base case) or a smaller van used by the Hepatitis C Trust. Further sensitivity analyses tested other assumptions: 0% and 6% discount rate (3.5% in base case), 100 year time horizon (50 years in base case), and no HCV care costs for diagnosed individuals in Metavir stages F0–F3 or F0–F4 (included for all diagnosed individuals in base case). We also assessed the effect of future (from 2016) increases in engagement (increased 2-fold) and treatment uptake (increased 2-fold) in the standard-of-care pathway on the cost-effectiveness of HepFriend.
Lastly, due to ongoing reductions in HCV treatment drug costs, a threshold analysis was conducted to determine the drug treatment cost where the mean ICER for HepFriend becomes cost saving.
Results
Costing analysis
The costing analysis estimated the HepFriend intervention costed £128136 for the year 2017/18 (Table 3): this comprised costs for the intervention itself, including start-up costs, staff time, test costs, a proportion of administration, management and finance allocated to HepFriend, and peer-support costs. Management, administration and finance support accounted for 36% of these costs. It does not include the cost of HCV treatment or hospital-related costs. Start-up costs were relatively small (8% of costs), due to UCLH and Groundswell already functioning with existing infrastructure. Peer support for hospital visits accounted for 34% of the total costs of HepFriend, requiring ∼2 days a week of peer-worker time: this cost included the peer worker’s time, materials, related travel and subsistence costs, management and administration support (Table S3). Using patient numbers from 2017 gives the following costs per patient: £501 per chronically infected patient diagnosed, £330 per patient engaged on the treatment pathway and £786 per patient supported through treatment to SVR.
Costs of HepFriend intervention activities for financial year 2017/18
| Activities for financial year 2017/18 | Base case cost (£) 2017/18 | Model input | |
|---|---|---|---|
| Total cost | 128136.70 | ||
| Total cost of outreach activities (includes staff time, travel, training and a proportion of overheads) | in outreach location | 16202.85 | total cost of diagnosis (1 year), £61132.55 |
| in mobile health unit (includes capital and recurrent vehicle costs) | 24454.91 | ||
| informing HCV patients of their status | 4999.31 | ||
| Total cost of tests (includes administrative and management, staff time, medical supplies and test costs) | POCT (98 tests for the year) | 6942.41 | |
| DBS RNA (62 tests for the year) | 8533.07 | ||
| FibroScan (includes staff time and capital cost) | 15142.15 | total cost of engagement (1 year), £36338.79 + hospital clinic costs | |
| Engagement of RNA+ patients (follow-up of RNA+ tests) | 7908.27 | ||
| Peer support for evaluation visit in hospital | peer support costs | 13288.37 | |
| Peer support for initiating treatment and subsequent treatment visits 0, 2, 4, 6, 8, 10 weeks | peer support costs | 14111.91 | total cost of treatment for 1 year (not including cost of DAA drugs), £30665.35 + hospital clinic costs + DAAs |
| Adherence support | 8289.22 | ||
| Peer support for post-treatment visits at 12 weeks and 1 year | peer support costs | 8264.22 | |
From UCLH and Groundswell records.
When calculating costs over 3 years of the intervention, the direct costs of HepFriend came to £270284. When also including the cost of DAAs, hospital staff time, equipment for individuals treated through HepFriend, the cost of HepFriend increased to £3594772. This did not include cost savings due to prevention benefits or averted healthcare costs. The costs of HepFriend accounted for 92% of the total incremental costs (Table 4). However, when compared with the standard-of-care scenario, the HepFriend intervention lowered HCV-related care over the time horizon.
Breakdown of discounted costs (£) over the time horizon of 50 years
| Category | Comparator mean | Intervention mean | Mean difference |
|---|---|---|---|
| Healthcare | 224884794 | 223019030 | −1865764 |
| HCV treatment of ex-injectors for standard care pathway | 52330974 | 52473116 | 142142 |
| HCV treatment of PWID for standard care pathway | 31578218 | 33519332 | 1941114 |
| Testing and engagement for standard care pathway | 6039715 | 6041750 | 2035 |
| HepFriend intervention costs (includes testing, engagement and treatment peer support) | 0 | 270284 | 270284 |
| HCV treatment cost for HepFriend (drug costs only) | 0 | 3324488 | 3324488 |
| OST provision | 919817795 | 919876344 | 58549 |
| Total | 1234651496 | 1238524344 | 3872848 |
Cost-effectiveness analysis
The 89 treatments undertaken by HepFriend over 3 years resulted in 51 [95% Credible Interval (CrI) 18–89] infections averted in the modelled PWID and ex-PWID population [0.10% (95% CrI 0.03%–0.24%) of all infections] over the time horizon, and 31 (95% CrI 19–46) disease-related deaths averted; 1.5% (95% CrI 1.0%–2.1%) of all disease-related deaths. All model runs in the PSA resulted in positive incremental QALYs, meaning the intervention always improved health benefits for the population. In terms of cost-effectiveness, the intervention resulted in an additional 412 QALYs saved and cost an additional £3.9 million (Table 5; the £3594772 cost of HepFriend plus added costs of HCV treatment for those indirectly benefiting less a reduction in disease-related healthcare), giving a mean ICER of £9531 per QALY saved, which is cost-effective at the WTP threshold of £20000 per QALY. In the PSA, 98% of simulations were below the WTP threshold, and 5% were cost saving (Figure 4).
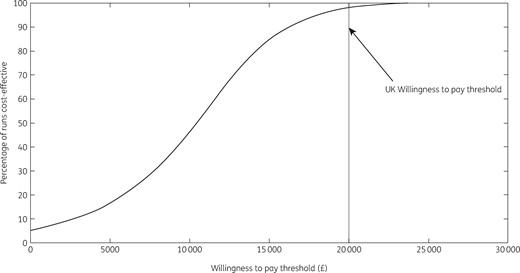
Cost-effectiveness acceptability curve.
Cost-effectiveness analysis
| Total costs (£) | Incremental costs (£) | Total QALYs | Incremental QALYs | mean ICER/QALY (£) | NMB (£) | |
|---|---|---|---|---|---|---|
| Standard of care | 1234600679 | 590434 | ||||
| HepFriend in addition to standard of care | 1238524344 | 3872848 | 590846 | 412 | 9408 | 4 360 457 |
| Total costs (£) | Incremental costs (£) | Total QALYs | Incremental QALYs | mean ICER/QALY (£) | NMB (£) | |
|---|---|---|---|---|---|---|
| Standard of care | 1234600679 | 590434 | ||||
| HepFriend in addition to standard of care | 1238524344 | 3872848 | 590846 | 412 | 9408 | 4 360 457 |
NMB, net monetary benefit.
Probabilistic sensitivity analysis
The ANCOVA sensitivity analysis showed that uncertainty in the HCV-related disease care costs contributed most to variability in the incremental costs (Figure S2). Conversely, uncertainty in the health utilities for successfully treated individuals contributed most to variability in the incremental QALYs (43% of variation), while uncertainty in the chronic HCV prevalence in 2016 accounted for 88% of the variability in the number of infections averted; fewer infections are averted at higher HCV prevalence.
Sensitivity analyses
At 27% of the list price for sofosbuvir and velpatasvir (£10525 per course), the intervention becomes cost saving on average, with 38% of all simulations being cost saving (Figure 5). Sensitivity analyses considering effects of changes in the intervention costing assumptions (two and three times the overhead costs, costs annualized over 3 or 7 years instead of 5, all screening sessions using either Find & Treat mobile screening unit or dedicated HCV mobile van) had very little impact on the cost-effectiveness of the intervention (Tables S5–S10), as did changes to other intervention assumptions [all individuals assumed to be current injectors or all individuals assumed to be new diagnoses; ICER varied from £8348 to £9439 per QALY (Table S11)]. Other sensitivity analyses considering changes in general assumptions (100 year time horizon, 0% and 6% discount rate, no disease-related healthcare costs in F0–F3 or F0–F4 disease stages in undiagnosed individuals) were all cost-effective at the £20000 per QALY threshold (Figure 6). Changes in the discount rate had the biggest effect on the ICER because the intervention accumulates impact over a long time horizon. Lastly, increasing the standard-of-care treatment rate in both the comparator and intervention arm slightly improved the mean ICER to £8853 per QALY, as did increasing the engagement rate, giving a mean ICER of £8829 per QALY.
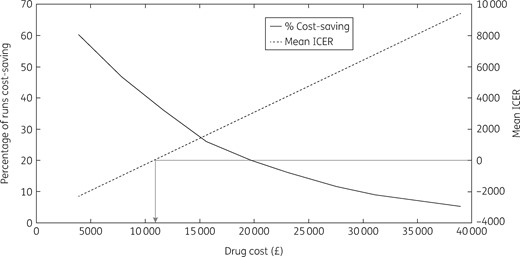
Threshold analysis of drug cost. The arrow shows at what drug cost the intervention becomes cost saving.
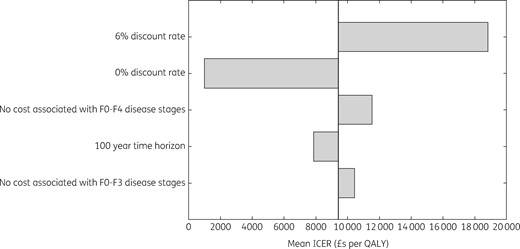
General sensitivity analysis. F0 to F4 are Metavir stages of liver disease.
Discussion
Main findings
The introduction of a novel care pathway for homeless PWID based on a mobile testing unit with peer support for HCV case-finding and treatment facilitation is likely to be a highly cost-effective strategy to improve treatment uptake amongst PWID and homeless people. Importantly, the intervention is likely to become cost saving when drug treatment costs decrease below £10525 per course, as may have already occurred in the UK.37
Strengths and limitations of the study
The key strength of this analysis is the dynamic transmission modelling of the at-risk population, capturing the prevention benefit of HCV treatment among those who are still injecting. Additionally, the use of primary cost data and intervention effectiveness data enabled a robust estimation of the cost-effectiveness under a range of parameter values and assumptions.
However, there are several limitations to our study. Firstly, we assumed low treatment uptake rates for the current standard-of-care comparator. Treatment rates in PWID were low in the pre-DAA era, with only 10% of individuals ever diagnosed in drug treatment services receiving treatment in a recent study from the UK.17 Uptake rates have improved since then, as used in this analysis, but they are still relatively low (17% within 2 years of diagnosis). Because treatment rates are likely to rise, we undertook a sensitivity analysis that doubled engagement and treatment rates in both comparator and intervention arms from 2016, which suggested that the cost-effectiveness of the intervention would improve with treatment scale-up.
Secondly, for some parameters, we had to use data from other countries because of a lack of UK data. For example, data on homeless mortality are sparse and so we used data from a Danish study to parameterize the model.38 Although it is possible that these data may not be comparable with the situation in the UK, uncertainty in this and other parameters did not contribute to the variability in the cost-effectiveness projections.
Thirdly, the model did not incorporate the additional benefits of other interventions carried out by the mobile unit, including flu vaccination, other bloodborne virus tests and TB screening, and therefore our estimates of cost-effectiveness are likely to be conservative. To account for shared costs, we only allocated a proportion of the mobile screening unit costs to HepFriend in line with the proportion of time the HCV team used it.
Comparison with other studies
Few studies have evaluated the cost-effectiveness of increased HCV case-finding amongst high-risk groups including PWID, with some being based on interventions done prior to the availability of new DAA treatments.15,39–41 For instance, evaluations from the UK (DAA)40 and Netherlands (not DAA)15 found that case-finding in drug treatment centres and prisons could be highly cost-effective if there is sufficient linkage to treatment. Our analysis adds to existing studies by considering an intervention that uses outreach to target homeless individuals and peer workers to aid linkage to new DAA treatments; no cost-effectiveness analysis has considered such an intervention before.
Conclusions and implications
Our analysis indicates that using a mobile nurse-led and peer-based model of outreach for increasing case-finding for HCV and treatment among PWID is highly cost-effective and could be cost saving with ongoing reductions in HCV treatment prices. This has relevance for the UK developing strategies to scale up treatment for reaching the WHO targets for eliminating HCV as a public health threat by 2030.42 It suggests that the HepFriend intervention should be scaled up to improve case-finding and treatment among vulnerable groups, including homeless individuals, in the UK. Although UK focused, the findings will also be relevant to other high-income settings where there is a close connection between injecting drug use and homelessness. For these countries, this intervention could have an important role in reaching PWID who are not in contact with other services. Despite evidence for the cost-effectiveness of this intervention, future improvements to this pathway of care could still occur, including the use of point-of-care RNA tests to remove delays in diagnosis, as well as the initiation and provision of treatment through the outreach van. Both these strategies could reduce any potential loss to follow-up and improve the uptake of treatment.
Acknowledgements
We thank Public Health England for the additional analysis of UAM data for the study.
Funding
This work was supported by the European Commission through its European Union Third Health Programme (Grant Agreement Number 709844) and National Institute of Health Research (Grant Number R133221-101).
Transparency declarations
M.H. has received honoraria from Gilead, MSD and Abbvie for presenting at conferences and expert meetings. Z.W. has received funds for other research from Janssen. P.V. has received unrestricted research funding from Gilead and honoraria from Merck. All other authors: none to declare.
This article forms part of a Supplement sponsored by the HepCare Europe Project.
References
World Health Organisation. Global Hepatitis Report,
Public Health England. Hepatitis C in the UK 2018 Report.
Public Health England. Hepatitis C in England 2018 Report.
London Joint Working Group. Practical Steps for Elimination of HCV: A Consensus for London.
PSSRU. Unit Costs of Health & Social Care 2013.
Public Health England. People Who Inject Drugs: HIV and Viral Hepatitis Unlinked Anonymous Monitoring Survey Tables (Pyschoactive): 2016 Update.
Information Services Division Scotland. Injecting Equipment Provision in Scotland Survey 2013/14.
World Health Organization. Combating Hepatitis B and C to Reach Elimination by 2030.
Field Epidemiology Service South East and London. Hepatitis C Epidemiology in London: 2015 Data.
Author notes
Zoe Ward and Linda Campbell authors contributed equally to the manuscript.
