Abstract

Quality problem

The gap between evidence-based guidelines and practice of care is reflected, in low- and middle-income countries, by high rates of maternal and child mortality and limited effectiveness of large-scale programing to decrease those rates.

Choice of solution

We designed a phased, rapid, national scale-up quality improvement (QI) intervention to accelerate the achievement of Millennium Development Goal Four in Ghana. Our intervention promoted systems thinking, active participation of managers and frontline providers, generation and testing of local change ideas using iterative learning from transparent district and local data, local ownership and sustainability.

Implementation

After 50 months of implementation, we have completed two prototype learning phases and have begun regional spread phases to all health facilities in all 38 districts of the three northernmost regions and all 29 Catholic hospitals in the remaining regions of the country. To accelerate the spread of improvement, we developed ‘change packages’ of rigorously tested process changes along the continuum of care from pregnancy to age 5 in both inpatient and outpatient settings.

Lessons learned

The primary successes for the project so far include broad and deep adoption of QI by local stakeholders for improving system performance, widespread capacitation of leaders, managers and frontline providers in QI methods, incorporation of local ideas into change packages and successful scale-up to approximately 25% of the country's districts in 3 years. Implementation challenges include variable leadership uptake and commitment at the district level, delays due to recruiting and scheduling barriers, weak data systems and repeated QI training due to high staff turnover.

Quality problem

The gap between evidence-based guidelines and practice in health care is particularly wide in low- and middle-income countries (LMICs), where maternal and child mortality rates are high, despite the availability of cost-effective interventions [1]. In 2010, only 19 of 68 countries were on track to achieve Millennium Development Goal Four (MDG 4) (two-third reduction in mortality in children less than 5 years old from 1990 to 2015) [2–5], despite the availability of cost-effective interventions [6]. Child survival programs in sub-Saharan countries have not had the expected effect, due in part to implementation challenges [7–9]. Ghana's maternal mortality rate is between 380 and 580 per 100 000 live births [2, 10, 11], while the mortality rates in neonates, infants and children under-five are estimated at 30, 50 and 80 deaths per 1000 live births, respectively [10]. In 2008, the top three causes of under-five mortality were malaria (33%), neonatal conditions (29%) and pneumonia (15%) [12].

Initial assessment

The national maternal, newborn and child health (MNCH) program of the Ministry of Health spans promotive, preventive and curative care. Although this program was operational nationwide, implementation was highly variable at the district level. This was due to health system challenges, including leadership, management, use of local data for decision making and patient-centeredness and community challenges that were primarily sociocultural, geographic and financial barriers to accessing health care. The financial constraint was substantially reduced in July 2008, when national health insurance was provided free of charge for maternity and early infant care.

Choice of solution

In July 2008, the Institute for Healthcare Improvement (IHI), the National Catholic Health Service (NCHS) and the Ghana Health Service (GHS) partnered to establish ‘Project Fives Alive!’. GHS provides about 70% of health care in the public sector, whereas NCHS provides about 25%; both are service delivery agencies of the Ministry of Health. IHI is a US-based non-governmental organization that uses quality improvement (QI) methods to improve health outcomes. The project sought to test the effectiveness of QI as a means of accelerating the achievement of MDG 4 through broad and reliable implementation of the national MNCH program, not to test the effectiveness of the specific interventions themselves. The QI methods used in this project are based on the model for improvement (MFI) [13] and the IHI improvement collaborative model [14]. The MFI requires the development of clear and ambitious aims that are shared within a given system, transparent and frequent monitoring of data to determine the effect of changes to the system and ideas for improvement followed by a plan-do-study-act (PDSA) cycle for testing, learning and continuous improvement [13]. The improvement collaborative model brings together health staff from different facilities who share and learn from each other to accelerate improvement across the network. We also designed a scale-up strategy that promoted the rapid spread of locally tested effective innovations and developed local QI capacity at all levels of the health system to promote local ownership and sustainability at large scale (Fig. 1 and Table 1). To further promote sustainability, we relied on GHS's routine health information system (RHIS) for project monitoring data and minimized the introduction of new indicators; this necessitated a separate QI collaborative for data quality, which included the health information officers in the hospitals and the district and regional health offices.

Table 1

Indicators for measuring the progress of project implementation

Collaborative networkChange ideasLocal ownership and sustainability
  1. Number of learning sessions

  1. Number of change ideas tested

  1. Three-fold increase in the number of project staff in Phase 2 by scaling up the number of QI teams by more than 10-fold as we relied more heavily on the change agents

  • (2) Number and frequency of site visits (project staff, change agents, combined visits)

  • (2) Dates testing of a change idea began and ended

  • (2) Joint facilitation of learning sessions and site visits by the project staff and the change agents

  • (3) Number and frequency of site visits by health information officers for data QI

  • (3) Dates on which change ideas were modified

  • (3) Convening of learning sessions by the regional, district and diocesan health leaders independently of the project staff

  • (4) Percentage of district health performance review meetings where QI presentations and discussions were included

  • (4) Observations and insights gained from the testing

  • (4) Quarterly review meetings for the change agents led by the regional health leadership team, to review progress, successes and challenges

  • (5) Funding and integration of change agents' QI coaching site visits into routine monitoring and supervision of their MNCH work

  • (6) Inclusion of QI presentations and discussions in the twice-yearly performance review meetings at the district and regional levels

Figure 1

Sequential scale-up of QI initiative in Ghana

Implementation

Each health facility in the network formed a 4- to 10-member multidisciplinary, locally selected QI team to lead their improvement work and to attend 2- to 3-day structured workshops (‘learning sessions’) every 4–6 months. Although QI teams were given time to meet and discuss QI at their facilities and attend the workshops, they were not provided additional compensation. The project covered the cost of transport, board and lodging associated with workshops. In health centers, the QI team was typically led by a midwife, whereas in hospitals, it was typically a doctor.

At learning sessions, project facilitators used the MFI [13] to help health staff to identify process failures or implementation gaps in their facility and/or catchment area, and the reasons for these challenges, and to develop and plan the testing of specific changes that they believed were likely to lead to improvement using existing resources to the extent possible. The project provided training in facilitation and QI methods for two members of each district health management team (DHMT) and regional health management team (RHMT) (‘change agents’). Change agents—typically public health nurses, disease control officers and health information officers—were selected by the DHMT or RHMT for skills (facilitation, data) and attributes (willingness to learn, innovate and adapt and credibility and respect for frontline providers).

In between learning sessions, project facilitators accompanied change agents in visiting QI teams to assist in developing, testing and evaluating the ideas generated in the learning sessions and to reinforce key QI concepts. The interval between site visits varied from 4 to 12 weeks, depending on the pace of improvement demonstrated by the QI team and the rate of learning by the change agents. As the change agents developed more competence in QI, they conducted site visits every 4–6 weeks independent of the project staff, ideally integrated into other district field supervisory activities. In between site visits, the project facilitators and the change agents provided additional technical support as needed to the QI teams by telephone.

The project facilitators initially received an intensive 2-day introduction to QI methods in a classroom setting, followed by 3–6 weeks of real-time coaching and mentoring during site visits. They subsequently enrolled in a formal QI professional development program from IHI, which included three sets of 4-day workshops in Ghana spread over 10 months, with monthly telephone conference calls for shared learning and coaching on a specific improvement initiative, which was a subset of their project work. All the facilitators had a minimum of a masters' degree; their prior experience varied across public health, health services administration and health information systems.

Leadership engagement of the GHS and NCHS was a key implementation strategy. We sought guidance on the design, implementation and monitoring at national, regional and district/diocesan levels throughout. The selection of the initial districts and dioceses for Phase 1 was made jointly by all three institutions. For Phase 2, NCHS and GHS signed a memorandum of understanding to clearly outline roles and responsibilities in implementation, monitoring and governance. Several senior leaders from the GHS regional health offices and the NCHS national and diocesan offices also received the same level of QI training as the project staff and regularly facilitated the work of the QI teams.

Throughout the project, we continued to build and maintain interest and support at multiple levels. We provided regular feedback sessions with the frontline providers and their managers after each round of coaching visits and learning sessions. We disseminated the project results at GHS's performance review meetings at district, regional and national levels, and at national and international conferences. In Phase 3, the NCHS's management meetings and annual conferences served as the main venues for building will with the leadership and the frontline. Finally, the QI work was summarized into technical reports and newsletters and circulated to all stakeholders in print or electronic media two to three times a year.

We collected three types of data: project implementation indicators, change ideas that were evaluated for inclusion in the change package (Table 1) and health process and outcome indicators (Table 2). In Phase 1, we reconstructed data from the paper-based clinical registers at each facility every month. In Phase 2, we extracted most of the data from the summaries submitted to the RHIS, whereas in Phase 3, the process data were reconstructed from clinical registers. A few new indicators were developed either from existing measures in the clinical registers or de novo (e.g. interval between identification of a sick child and initiation of definitive treatment). QI teams also collected context-specific indicators based on the change ideas they were testing (e.g. monthly number of telephone calls to the midwife from women in labor). In addition, we collected data from GHS's community-based surveillance volunteer data that report community births, deaths and notifiable diseases to the health centers each month.

Table 2

Detailed description of health processes and outcome indicators reported in the RHIS

No.IndicatorMeasurementNumeratorDenominator
Maternal risk identification
  • 1

  • ANC registration coverage

  • Rate of care seeking for ANC at least once before delivery

  • No. of ANC Registrants

  • No. of expected pregnancies

  • 2

  • Early registration for ANC (first trimester)

  • Percentage of ANC registrants in first trimester at registration

  • No. of ANC registrants in first trimester at registration

  • No. of ANC registrants

  • 3

  • Frequent and regular ANC visits before delivery (≥4)

  • Rate of ANC clients making their fourth visit per expected pregnancies

  • No. of ANC clients making fourth ANC visits before delivery

  • No. of expected pregnancies

Maternal risk management
  • 4

  • Anemia management

  • 4a. Percentage of ANC clients who are anemic (<11 g/dl) at registration (for hospitals only)

  • 4a. No. of ANC clients who are anemic (<11 g/dl) at registration

  • 4a. No. of ANC clients who had HB checked at registration

  • 4b. Percentage of ANC clients who are anemic (<11 g/dl) at 36 weeks of gestation (for hospitals only)

  • 4b. No. of ANC clients who are anemic (<11 g/dl) at 36 weeks of gestation

  • 4b. No. of ANC clients who had HB checked at 36 weeks of gestation

  • 5

  • Malaria prevention

  • 5. IPT3 coverage in ANC clients

  • No. of ANC clients receiving IPT3 before delivery

  • No. of expected pregnancies

Skilled delivery
  • 6

  • Skilled delivery coverage

  • Percentage of total deliveries that are attended by skilled health personnel

No. of total deliveries that are attended by skilled health personnelNo. of total deliveries (both skilled and unskilled)
  • 7

  • Institutional maternal mortality

  • Rate of institutional maternal deaths per 100 000 institutional live births

No. of institutional maternal deathsNo. of institutional live births
  • 8

  • Still births

  • 8a. Rate of still births following skilled delivery

8a. Total no. of still births following skilled delivery8a. No. of skilled deliveries
  • 8b&c. Type of still birth as percentage of total still births

8b. No. of fresh still births as outcome of skilled delivery8b. Total no. of still births following skilled delivery
8c. No. of macerated still births as outcome of skilled delivery8c. Total no. of still births following skilled delivery
Neonatal survival
  • 9

  • Overall PNC coverage

  • 9. Percentage of neonates that are registered for PNC

  • 9. Total no. of PNC registrants

  • 9. Total no. of deliveries (both skilled and unskilled)

  • 10

  • Early PNC coverage

  • 10a. Percentage of PNC registrants receiving PNC within 2 days of birth

  • 10a. No. of PNC registrants receiving PNC within 2 days of birth

  • 10a. Total no. of PNC registrants

  • 10b. Percentage of PNC registrants receiving follow-up PNC on Day 6 or 7 after birth

  • 10b. No. of PNC registrants receiving follow-up PNC on Day 6 or 7 after birth

  • 10b. Total no. of PNC registrants

  • 11

  • Neonatal mortality

  • 11a. Institutional neonatal mortality rate

  • 11a. No. of neonatal deaths in health facilities

  • 11a.Total no. of deliveries (both skilled and unskilled)

  • 11b. Community-based neonatal mortality rate

  • 11b. No. of neonatal deaths in communities

  • 11b. Total no. of deliveries (both skilled & unskilled)

Postneonatal infant survival
  • 12

  • Postneonatal institutional infant mortality

  • 12a. Rate of infant (1–11 months) deaths in communities

  • 12a. No. of infant (1–11 months) deaths in communities

  • 12a. Expected no. of infants 1–11 months old

  • 12b. Rate of institutional deaths in infants 1–11 months

  • 12b. No. of deaths in infants 1–11 months old in health facility

  • 12b. No. of deaths in infants 1–11 months old admitted to health facility

  • 13

  • Institutional infant morbidity

  • Rate of infants (0–11 months) reporting sick to health facility

  • No. of infants 0–11 months old reporting sick to health facility

  • Expected no. of infants 0–11 months old

  • 14

  • Institutional infant malaria morbidity

  • Percentage of sick infants 0–11 months old reporting to health facility with malaria

  • No. of infants 0–11 months old reporting to health facility with malaria

  • No. of infants 0–11 months old reporting sick to health facility

  • 15

  • Institutional infant malaria case fatality rate

  • Rate of infants 0–11 months old diagnosed with malaria who die in health facility

  • No. of infants 0–11 months diagnosed with malaria who die in health facility

  • No. of infants 0–11 months old admitted due to malaria

  • 16

  • Immunization coverage

  • Percentage of infants (0–11 months old) who receive PENTA3 vaccine

  • No. of infants (0–11 months old) who receive PENTA3 vaccine

  • No. of 0–11 month old attendees at child welfare clinics

  • 17

  • Infant malnutrition

  • Percentage of infants (0–11 months old) with severe malnutrition

  • No. of infants (0–11 months old) with recorded weight <60 weight-for-age

  • No. of infants (0–11 months old) who had their weights checked

Older child survival
  • 18

  • Institutional older child morbidity

  • Rate of children 12–59 months reporting sick to health facility

  • No. of children 12–59 months reporting sick to health facility

  • Expected no. of children 12–59 months

  • 19

  • Institutional older child malaria morbidity

  • Percentage of sick children 12–59 months old reporting to health facility with malaria

  • No. of children 12–59 months old reporting to health facility with malaria

  • No. of children 12–59 months old reporting sick to health facility

  • 20

  • Institutional older child malaria case fatality

  • Rate of children 12–59 months old diagnosed with malaria who die in health facility

  • No. of children 12–59 months diagnosed with malaria who die in health facility

  • No of children 12–59 months old admitted due to malaria

  • 21

  • Institutional older child all-cause mortality

  • Rate of institutional deaths in children 12–59 months old

  • No. of deaths in children 12–59 months old in health facility

  • No. of deaths in children 12–59 months olds admitted to health facility

  • 22

  • Older child malnutrition

  • Percentage of infants (12–59 months old) with severe malnutrition

  • No. of infants (12–59 months old) with recorded weight <60 weight-for-age

  • No. of infants (12–59 months old) who had their weights checked

Overall under-5 survival
  • 23

  • Overall under-5 mortality

  • Rate of deaths in children under-5 in health facility

  • No. of deaths in children under-5 in health facility

  • No. of live births, emergency detentions and admissions on the ward in children under-5

ANC, antenatal care; HB, hemoglobin; IPT3, third dose of intermittent preventive treatment for malaria in pregnant women; PENTA3, third dose of pentavalent vaccine that protects against diphtheria, tetanus, pertussis, hepatitis B and poliomyelitis; PNC, postnatal care; Under-5, children less than 5 years old.

All project implementation process, health process and health outcome data were assessed by time series analysis [15, 16]. The health process and outcome data were analyzed by health facility, district and region. We aggregated the data from facilities testing the same change idea, applied run chart rules [17] to define trends toward improvement [17]. These include six or more consecutive points above or below the median, five or more consecutive points increasing or decreasing. Qualitative data documented by the QI teams and the project staff were used to establish the exact nature of the change, when it was initiated or modified and when it was terminated.

Ethics

No institutional review board approval was required for this work, as the implementation and monitoring of the QI interventions were considered part of the established and ongoing national MNCH program that is based on existing policies of the Ghanaian Ministry of Health. Our evaluation used routinely collected deidentified aggregate data of process performance and outcomes.

Evaluation

Using Thomas W. Nolan's ‘will-ideas-execution’ framework for achieving system-wide improvement [18], we evaluated the project in three areas: (i) endorsement and local ownership by health system leaders and independent undertaking of QI work (‘will’), (ii) generation of ‘ideas’ to promote improvements in processes and outcomes and (iii) effectiveness of the ‘execution’ of the project design. An external independent evaluation of the effectiveness and cost-effectiveness of the QI intervention in improving processes of care and outcomes will be reported at a later date.

Will building

During Phase 2, all learning sessions were convened by the RHMT and were co-facilitated by the project staff and the change agents, and all site visits by project staff were conducted in conjunction with the district change agents. However, not all change agents' site visits that were supposed to be independent of the project staff were undertaken, due to a variety of competing demands and logistic challenges. At the halfway point in Phase 2, QI content was routinely integrated into regional health review meetings but was variable at the district level depending on the prioritization placed on QI by the DHMT. For the data QI initiative, as of December 2011, 26 out of 38 (68%) districts were actively involved. Again, the non-participation of the other 12 districts was due primarily to insufficient prioritization by the DHMT.

For Phases 3a and 3b, local ownership and progress toward sustainability have been variable, depending mostly on the engagement of the hospital management teams and rapid turnover of QI team members. The change agent model was slow to be implemented in the NCHS system because of lower staffing levels of the diocesan health office versus the district office. However leadership engagement of QI was boosted when NCHS developed a plan to use QI as the primary mechanism for transforming the performance of the organization beyond its involvement in the project; this plan is currently being implemented.

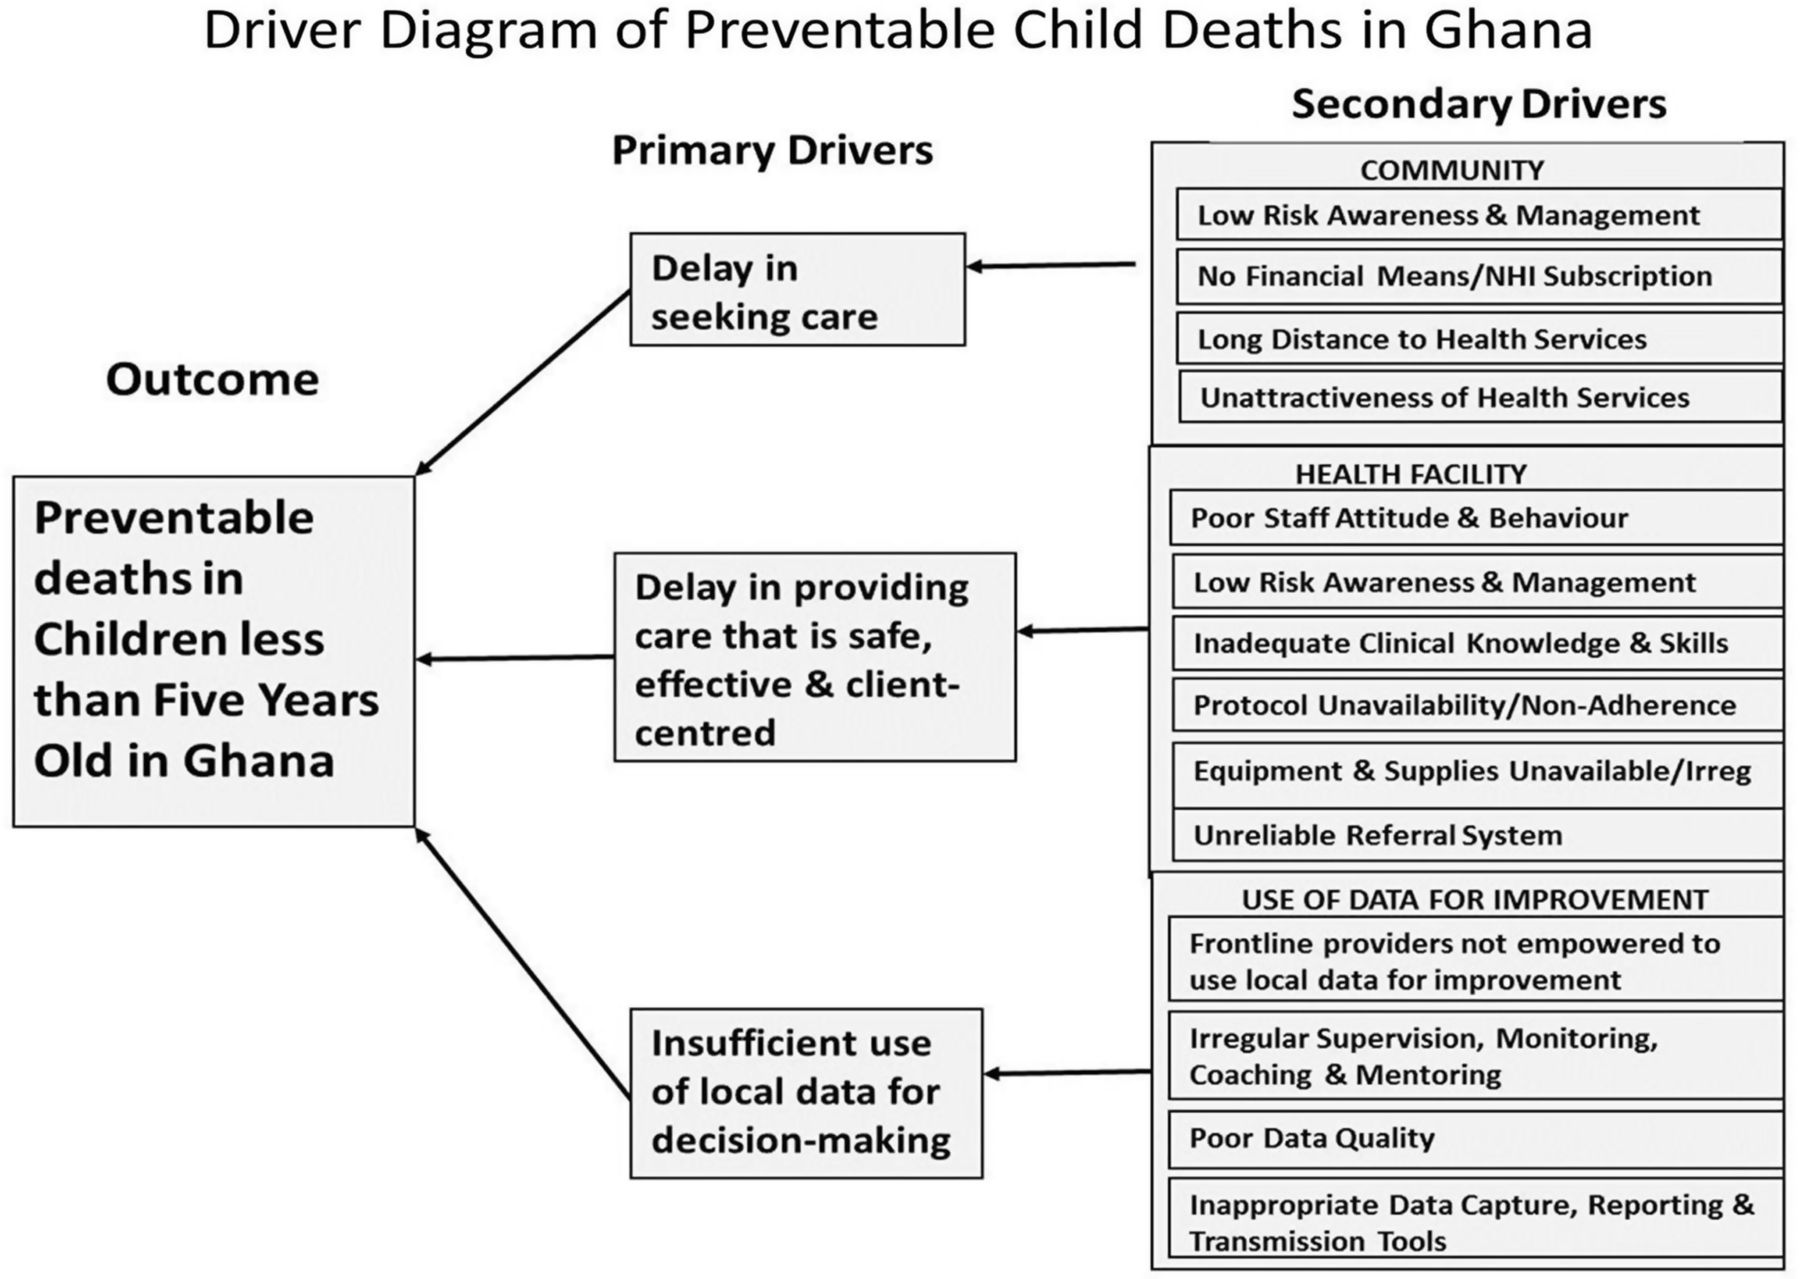
Development of change ideas

We used a ‘driver diagram’ (Fig. 2) to anchor the development of the change ideas to be tested, adapted or implemented in the project. We assembled the primary drivers––the underlying causes of under-five mortality––in the rural Ghanaian context, each of which became a focal point for the development of change ideas to be tested. This driver diagram was initially based on the available published data and the findings of the contextual assessment conducted in Phase 0. It underwent significant iterative changes during subsequent phases of the project, as the QI teams verified the relevance of the drivers and the associated change ideas.

Figure 2

Driver diagram of preventable child deaths in Ghana

By the end of Phase 1, the 27 QI teams had tested specific change ideas 104 times using the PDSA cycle. By month 12, there was sufficient evidence of improvements (using run chart rules [17]) in antenatal, perinatal and postnatal care processes to develop the first ‘change package’ (Table 3). This ‘change package,’ which was focused on primary care, was promoted to Phase 1 QI teams and new QI teams in Phase 2. These teams were encouraged to adopt or adapt changes from the change package according to how well the changes were suited to their local context.

Table 3

Summary of changes found to be effective in improving processes of care for the antenatal, perinatal and postnatal periods after Phase 1

Care pathway
Successfula change idea(s)Facility type
Antenatal
  1. Registration in first trimester

  • 1A. Community stakeholder meetings with opinion leaders and other influential groups about the importance of early and regular ANC

C
  • 1B. Community stakeholder meetings followed by registration of pregnant women by community volunteers on a monthly basis

C
  1. At least four visits before delivery

  • 2A. Increase number of days ANC is offered at static site and re-design clinic processes to reduce visit duration per client to <1 h

C & H
  • 2B. Offer ANC as outreach service as well as at static site and re-design clinic processes to reduce visit duration per client to <1 h

C
Perinatal
  1. Skilled delivery and immediate postnatal care

  • 3A. Video show in communities on the risks of labor and delivery

C
  • 3B. Male advocacy group in communities to promote skilled delivery

C
  • 3C. TBA engagement on risks of unskilled delivery and provide incentives

C
  • 3D. Use ANC register to identify women at 36+ weeks of gestation for home visits to remind them and family members about skilled delivery and confirm transport plan

C
  • 3E. Provide domiciliary delivery if, on notification by mobile phone, labor too advanced, woman has no means of transport from community or health staff cannot arrange transport from clinic or hospital

C
  • 3F. Create a welcoming, patient-friendly environment in health facility for laboring women

C & H
  • 3G. Create systems to ensure consistent and correct use of partographs

C & H
  • 3H. Create systems for reliable neonatal resuscitation

C & H
Postnatal
  1. Care on Day 1 or 2

  • 4A. If facility skilled delivery––detain for observation for ≥24 h if possible. If not, discharge after minimum of 6 h and follow-up on Day 2 with facility or home visit

C & H
  • 4B. If domiciliary skilled delivery––follow-up on Day 2 with facility or home visit.

C
  • 4C. If unskilled delivery––ask family members or volunteers to notify health staff immediately by mobile phone/bicycle/motorbike. Woman comes to facility on Day 1 if possible or health staff follow-up with home visit on Day 1 or 2

C
  1. Care on Day 6 or 7

  • 5A. During Day 1/2 visit, make appointment for Day 6/7 visit at facility or home. Use reminder systems at community, clinic/hospital to improve reliability.

C & H
  • 5B. If woman lives in different sub-district or distant community within CHPS zone, refer to other sub-district or CHO for Day 6/7 visit. Contact CHO to follow up if no show

C & H
  • 5C. If woman lives in distant community without CHO and return facility visit not possible and health staff home visit not possible, train IMCI volunteers to provide Day 6/7 care

C

C, Health center, clinic or health post; CHO, community health officer; CHPS, community-based health planning and services; H, hospital; IMCI, integrated management of childhood illness; TBA, traditional birth attendant.

aA successful change idea was as a change in a process that led to a shift or a trend in a particular indicator as defined by run chart rules [17].

A similar process took place in Phase 3a: during the 18-month period, the 9 hospital QI teams tested 47 specific change ideas that focused on early care seeking, prompt treatment and adherence to clinical protocols. Eleven of these ideas led to improvements as determined by run chart rules [17] and, thus, were summarized into our second change package (Table 4), which was more focused on hospital-based care. This package was promoted to the remaining 20 NCHS hospitals in the South (Phase 3B) and all the 36 hospitals in Phase 2 that were already using the first change package.

Table 4

Summary of changes found to be effective in improving processes of care in the hospital outpatient and inpatient setting after Phase 3a

DriverArea of clinical/community careChange conceptPackage numberDescription of successfula change ideas
Delay in seeking careCare-seeking behaviorTargeted health education
  • 1A

  • Targeted health education on early care seeking using interactive platforms (e.g. radio)

  • 1B

  • Community engagement and education via durbar or place of worship

ReferralEngaging primary providers
  • 1C

  • Engagement with health providers (both traditional and allopathic) on the need for early referral and early warning signs

Delay in providing carePrompt diagnosis and treatmentTriage
  • 2A

  • Triage system for screening and emergency treatment of critically ill children

Fast track
  • Separate under-5 OPD services from adult OPD service

  • Prioritize under-5 outpatient care

  • Prioritize under-5 inpatient care

Non-adherence to protocolsAdherence to protocolsTraining/coaching/ mentoring
  • 3A

  • Training staff on protocols followed by regular coaching and mentoring that include ad hoc testing on site with immediate feedback

  • 3B

  • Training postpartum women and other care givers on hygienic cord care through demonstration, practice and immediate feedback

  • 3C

  • Mother-to-mother support group on food choices and frequency of feeding while on admission under mentoring of nurses

Task shifting
  • 3D

  • Empowering nurses to start acting on standard treatment protocols before doctor arrives

OPD, outpatient department.

aA successful change idea was as a change in a process that led to a shift or a trend in a particular indicator as defined by run chart rules [17].

Execution according to the project design

The timing and length of the project phases were modified in response to local realities. Phase 0 was extended by 2 months to allow more time to engage stakeholders at all levels of the health system and to respond to their inputs. Phases 1 and 3a were extended by 6 months to allow sufficient time for QI teams to develop, test and reflect on new change ideas over time.

For Phase 1, to generate interest and establish a unified aim, the project launch was combined with the first learning session and included health staff from all three districts and a Catholic diocese. The three subsequent learning sessions were decentralized to the district level to enable greater participation by frontline providers, local ownership by the DHMT and reduced travel time for the health staff. The number and frequency of learning sessions, facility visits and ideas tested are provided in Table 5. The mean number of site visits during this phase was 14.6 per QI team, with a mean interval of 4 weeks between visits (Table 5).

Table 5

Implementation progress of phases 1, 2, 3a and 3b of the QI interventions as of December 2011

PhaseDescription of phaseDuration
No. of health facilities
No. of districtsLearning sessions as of December 2011
Site visits as of December 2011
Planned (months)Actual (months)Health posts/centersHospitalsTotalTotal no. of sessionsMean no. of participants per sessionMean interval between sessions (months)Total no. of visitsMean no. of visits per QI teamMean interval between visits (weeks)
0Contextual assessment, project design, hiring, partnership building, stakeholder engagement68
1Innovation and testing in Catholic and government facilities on a small scale in North12182522731085239414.64
2District-based scale-up throughout the North18tbd54036576383554614245.56
3aInnovation and testing on a small scale in Catholic hospitals in the South12180994356778.66
3bScale-up to all Catholic hospitals in the South18tbd029293474.3541.99.5
3cScale-up to all Catholic health centers in the South12tbd
4Scale-up to all government facilities in the South24tbd

tbd, to be determined.

To allow project staff to support sites scattered over a large area, Phase 2 was launched with staggered start times over an 8-month period. During this phase, the average frequency of site visits by the project staff was 5.5 per QI team (versus 14.6 in Phase 1), whereas the interval between site visits increased from 4 to 6 weeks. This reflected the decreased emphasis on innovation versus spread in Phase 2 when compared with Phase 1 and increasing QI skills of the district-based change agents. It also accommodated the limited capacity of the project officers to visit the greatly expanded number of facilities (29.8 QI teams per project officer in Phase 2 versus 13.5 in Phase 1) across difficult terrain and long distances. Two years after the launch of Phase 2, we had fully scaled up the QI intervention and the first change package to all 38 districts in the North. This represented a more than 10-fold increase in districts supported as compared to Phase 1 (Table 5).

Phase 3a had four learning sessions, with a mean number of participants of 35 per session and a mean interval of 6 months between sessions, a mean number of 8.6 visits per QI team and a mean interval of 6 weeks between visits. The mean number of participants in the learning sessions increased from 35 to 47 (Table 5) in Phase 3b, due to the expansion of the team to include an hospital administrator to enable greater management support of the QI teams. During the first 6 months of Phase 3b, the intensity of visits decreased to 1.9 per QI team and the site visit interval increased to 9.5 weeks.

Lessons learned

We describe how we used QI methods to design, test and scale up improvements across a large part of Ghana, in a complex health system program aimed at improving health outcomes in children under-five. In contrast to many projects in LMICs that get stuck at the pilot or demonstration stage and are never scaled up [7–9], we used a design that was flexible enough to adapt to local context, did not require substantial resources for scale-up and promoted sustainability by engaging local and regional leadership and capacitating leaders, managers and frontline staff to use QI methods. Our design addressed other scale-up challenges, including supervision, monitoring, evaluation and accountability––all of which are weaknesses of LMIC health systems [19].

The primary successes for the project so far include the breadth and depth of local stakeholder engagement, as evidenced by the uptake of data-driven assessment and decision making at multiple levels of the health system, wide adoption of a QI approach as a means to improve health system performance, widespread capacitation of leaders, managers and frontline providers in QI methods through longitudinal training, coaching and peer learning networks, generation of change packages to improve MNCH, which are relevant to a variety of local contexts, while adhering to an overall national program and the successful scale-up of the QI intervention to approximately 25% of the country's districts in 3 years.

The principal challenges to the project so far are similar to those encountered in other resource-constrained environments. In all three regions, the rollout of the project took significantly longer than expected. Most of these delays were due to difficulty in finding appropriate times to schedule workshops because of competing priorities with other programs. Delays also resulted from difficulty in recruiting project staff. The interval between learning sessions was also longer than planned due to similar scheduling challenges and delays in reporting from GHS to NCHS as agreed in the memorandum of understanding. In Phase 3, the project was delayed by health staff transfers or loss of staff returning to school for additional training, both of which necessitated duplication of QI training content during site visits and learning sessions. We also encountered challenges with data accuracy, completeness and timeliness that have been well documented in similar settings [20]. Finally, the transition of longitudinal QI coaching of the frontline providers from the project staff to the change agents is progressing more slowly than planned, due to lack of available change agents and, for existing change agents, competing priorities in the districts.

The evolution of adaptive driver diagrams proved to be effective in accelerating our understanding of the key drivers that thwart child survival, as they focus on specific changes in specific settings that could lead to improvement. This tool can be used iteratively to guide evaluators to systematically monitor changing dynamics in project implementation and identify contextual variation across sites [21]. The field-tested version that we report may provide a secure starting point for others who are interested in replicating a QI intervention in a similar setting.

Although the initial evaluation of the project is promising, its impact will not be known until further evaluation by the project's independent evaluator. The effectiveness of our design to promote sustainability will only be known after the project support has been withdrawn.

In conclusion, we have demonstrated the feasibility of implementing a large-scale QI initiative in support of a national health program in a low-resource setting, starting with a small-scale prototype and rapidly scaling up successful interventions over a large area. The lessons learned to date may help others to improve the design and implementation of large-scale initiatives in similar settings.

Funding

This work was supported by the Bill & Melinda Gates Foundation (grant number 48930).

Conflict of Interest

None declared.

Acknowledgements

We would like to express our immense gratitude to Patrick Ansu and Linda Azumah for data collection and analysis and to Jane Roessner for copy-editing.

References

1
Haines
A
Kuruvilla
S
Borcher
M
Bridging the implementation gap between knowledge and action for health
Bull World Health Organ
2004
, vol. 
82
 (pg. 
724
-
32
)
2
Hogan
MC
Foreman
KJ
Naghavi
M
, et al. 
Maternal mortality for 181 countries, 1980-2008: a systematic analysis of progress towards Millennium Development Goal 5
Lancet
2010
, vol. 
375
 (pg. 
1609
-
23
)
3
Rajaratnam
JK
Marcus
JR
Flaxman
AD
, et al. 
Neonatal, postneonatal, childhood, and under-5 mortality for 187 countries, 1970-2010: a systematic analysis of progress towards Millennium Development Goal 4
Lancet
2010
, vol. 
375
 (pg. 
1988
-
2008
)
4
Bhutta
ZA
Chopra
M
Axelson
H
, et al. 
Countdown to 2015 decade report (2000–10): taking stock of maternal, newborn, and child survival
Lancet
2010
, vol. 
375
 (pg. 
2032
-
44
)
5
Lawn
J
Are the millennium development goals on target?
BMJ
2010
, vol. 
341
 pg. 
c5045
 
6
Darmstadt
GL
Bhutta
ZA
Cousens
S
, et al. 
Evidence-based, cost-effective interventions: how many newborn babies can we save?
Lancet
2005
, vol. 
365
 (pg. 
977
-
88
)
7
Bryce
J
Gilroy
K
Jones
G
, et al. 
The Accelerated Child Survival and Development programme in west Africa: a retrospective evaluation
Lancet
2010
, vol. 
375
 (pg. 
572
-
82
)
8
McCannon
CJ
Berwick
DM
Massoud
MR
The science of large-scale change in global health
JAMA
2007
, vol. 
298
 (pg. 
1937
-
9
)
9
Paina
L
Peters
DH
Understanding pathways for scaling up health services through the lens of complex adaptive systems
Health Policy Plan
2012
, vol. 
27
 (pg. 
365
-
73
)
10
Ghana Statistical Service, Ghana Health Service, Macro International Inc
Ghana Demographic and Health Survey 2008
2009
Calverton, MD, USA
Ghana Statistical Service, Ghana Health Service and Macro International Inc.
11
Ghana Statistical Service, Ghana Health Service, Macro International Inc
Ghana Maternal Health Survey 2007
2009
Calverton, MD, USA
Ghana Statistical Service, Ghana Health Service and Macro International Inc.
12
World Health Organization Child Health Epidemiology Reference Group
Countdown to 2015: Maternal, Newborn & Child Survival: The 2008 report
2008
Geneva
World Health Organization
 
Available from www.cherg.org
13
Langley
GJ
The Improvement Guide: A Practical Approach to Enhancing Organizational Performance
2009
2nd edn
San Francisco
Jossey-Bass
14
Institute for Healthcare Improvement
The Breakthrough Series: IHI's Collaborative Model for Achieving Breakthrough Performance
2003
Cambridge, MA, USA
Institute for Healthcare Improvement
 
Available from: www.ihi.org
15
Biglan
A
Arry
DV
Wagenaar
AC
The value of interrupted time series experiments for community intervention research
Prev Sci
2000
, vol. 
1
 (pg. 
31
-
49
)
16
Benneyan
JC
Lloyd
RC
Plsek
PE
Statistical process control as a tool for research and health care improvement
Qual Saf Health Care
2003
, vol. 
12
 (pg. 
458
-
64
)
17
Perla
RJ
Provost
LP
Murray
SK
The run chart: a simple analytical tool for learning from variation in healthcare processes
BMJ Qual Saf
2011
, vol. 
20
 (pg. 
46
-
51
)
18
Nolan
TW
Execution of Strategic Improvement Initiatives to Produce System-Level Results
2007
Cambridge, MA, USA
Institute for Healthcare Improvement
19
World Health Organization
Everybody's Business: Strengthening Health Systems to Improve Health Outcomes: WHO's Framework for Action
2007
Geneva
WHO Press
20
Mate
KS
Bennett
B
Mphatswe
W
, et al. 
Challenges for routine health system data management in a large public programme to prevent mother-to-child HIV transmission in South Africa
PLoS One
2009
, vol. 
4
 pg. 
e5483
 
21
Svoronos
T
Mate
K
Evaluating large-scale health programmes at a district level in resource-limited countries
Bull World Health Organ
2011
, vol. 
89
 (pg. 
831
-
7
)

Supplementary data