


Abstract
We conducted a case-controlled study of the associations of CCR5-Δ32 heterozygosity with human immunodeficiency virus type 1 (HIV-1) reservoir size, lymphocyte activation, and CCR5 expression in 114 CCR5Δ32/WT and 177 wild-type CCR5 AIDS Clinical Trials Group participants receiving suppressive antiretroviral therapy. Overall, no significant differences were found between groups for any of these parameters. However, higher levels of CCR5 expression correlated with lower amounts of cell-associated HIV-1 RNA. The relationship between CCR5-Δ32 heterozygosity, CCR5 expression, and markers of HIV-1 persistence is likely to be complex and may be influenced by factors such as the duration of ART.
Human immunodeficiency virus type 1 (HIV-1) engages CCR5 and/or CXCR4 as coreceptors for cell entry. CCR5 serves as the principle coreceptor during viral transmission and early infection. A 32–base pair deletion in 1 copy of the CCR5 gene (CCR5Δ32/WT) leads to reduced surface expression of functional coreceptor and has been associated with protection from HIV-1 infection [1–5]. A CCR5Δ32/WT genotype has also been associated with lower plasma HIV-1 RNA levels before initiation of antiretroviral treatment (ART) and slower HIV-1 disease progression in the absence of ART [3–5]. However, less is known about the effects of CCR5-Δ32 heterozygosity on the size and activity of the latent HIV-1 reservoir.
Previous reports suggest that cell-associated HIV-1 DNA levels are lower in CCR5Δ32/WT patients as compared to CCR5WT/WT individuals [6, 7], but those studies had relatively small sample sizes or were performed in untreated patients. A more recent cross-sectional study of 18 individuals heterozygous for CCR5 did not demonstrate lower HIV-1 DNA levels in CCR5Δ32/WT subjects but did identify significantly lower cell-associated RNA levels, cell-associated RNA to DNA ratios, and frequency of detectable HIV 2-long terminal repeat (2-LTR) circular DNA in CD4+ T cells from CCR5Δ32/WT patients as compared to those from wild-type (WT) individuals [8]. Owing to the paucity of data on the effects of the variant CCR5 allele on HIV-1 persistence, a controlled study involving a larger number of patients receiving long-term suppressive ART is needed. We therefore conducted a case-controlled study of HIV-1 DNA levels in 114 CCR5Δ32/WT and 177 WT CCR5 participants receiving long-term suppressive ART from Adult AIDS Clinical Trials Group (ACTG) studies. In addition, levels of cell-associated HIV-1 RNA, 2-LTR circles, T-cell activation, and CCR5 surface expression were compared in a random subset of 40 CCR5Δ32/WT cases and 40 WT controls.
METHODS
Samples were obtained from participants in 4 ACTG trials of ART-naive individuals (ACTG 384, A5095, A5142, and A5202) and the ACTG Longitudinal Linked Randomized Trials (ALLRT) cohort, members of which had existing CCR5 genotypic data from a prior genome-wide association study of HIV-1 progression and host factors [9]. Samples from participants who did not achieve viral suppression by 24 weeks after ART initiation or who had subsequent persistent low-level viremia (defined as ≥3 consecutive measurements of ≥50 copies/mL), a confirmed viral load of ≥200 copies/mL, or viral blips of ≥1000 copies/mL were excluded. Tests were performed on samples collected from 114 CCR5Δ32/WT cases and 177 WT controls frequency matched in a 1:1.5 ratio by sex, initial ART regimen, and time of study sample collection after ART initiation (128, 144, or 160 weeks). Cryopreserved peripheral blood mononuclear cells (PBMCs) from a random subgroup of 40 CCR5Δ32/WT cases and 40 WT controls were used for RNA and 2-LTR assays and for characterization of cell surface markers by flow cytometry.
DNA and RNA were extracted from cryopreserved PBMCs by using the AllPrep kit (Qiagen, Valencia, California) and were quantified using a real-time polymerase chain reaction (PCR) assay as described previously [10, 11]. This assay targets a conserved LTR/gag region that is specific to nearly all HIV-1 group M sequences; each sample was tested in triplicate [10, 11]. Unspliced cell-associated RNA was quantified by a real-time PCR assay, using the same primers and probes as used for HIV-1 DNA; HIV-1 DNA and RNA levels were normalized to cell count, using a conserved region of the CCR5 gene not influenced by the Δ32 mutation, as described elsewhere [10, 11]. The 2-LTR circles were quantified from PBMC DNA by real-time quantitative PCR as described previously [11]. A 149–base pair sequence of the human mitochondrial gene ND4 was quantified to estimate the efficiency of episome extraction [11]; the results of 2-LTR amplification were normalized to the number of input PBMCs.
Thawed, cryopreserved PBMCs were stained with Fixable Blue Dead Cell Stain, anti-CD3 (Invitrogen, Eugene, Oregon), anti-CD4 (eBioscience, San Diego, California), anti-CCR5 (BioLegend, San Diego, California), and anti-CD8, anti-CD38, anti-HLA-DR, anti-CD57, anti-CD25, and anti-CD69 (BD Biosciences, San Jose, California). Following surface staining, cells were fixed, permeabilized, and stained for intracellular anti-Ki-67 (BD). Selected samples were stained for intracellular CCR5 to verify the efficiency of antibody binding. Samples were analyzed on a BD LSRII flow cytometer, using FACSDiva software (BD). Cytometer settings were kept consistent by tracking laser voltages, using UltraRainbow Fluorescent Particles (Spherotech, Lake Forest, Illinois). Compensation settings were assessed using CompBead particles (BD). Samples were analyzed using FlowJo (Tree Star, Ashland, Oregon). Only live cells were included in the flow cytometry analyses.
Conditional logistic regression models appropriate for the case-control design were used to compare measures of reservoir size, CCR5 expression, and lymphocyte activation between cases and controls, with and without adjustment for pre-ART HIV-1 plasma RNA load and CD4+ T-cell count (SAS, version 9.2). In addition to measures of cell-associated DNA and RNA levels, CD4+ T-cell counts were also analyzed by adjusting the total copy numbers by the CD4+ T-cell percentages at the time of sampling. Spearman rank correlation analysis was used to identify associations between CCR5 expression, T-cell activation, and cell-associated HIV-1 DNA and RNA levels. A significance level of 5% was used, with no correction for multiple comparisons.
RESULTS
Owing to case-control matching, sex, initial ART regimen, and time of study sample collection after ART initiation were similar between the 114 CCR5Δ32/WT and 177 WT individuals. Pre-ART demographic and disease characteristics of participants are shown in Supplementary Table 1. Samples were obtained from 97% of participants with HIV-1 suppression due to ART for 144 or 160 weeks, with the remainder obtained at 128 weeks. A higher percentage of white, non-Hispanic individuals were CCR5Δ32/WT as compared to black and Hispanic participants. Median pre-ART plasma HIV-1 RNA levels were the same for CCR5Δ32/WT and WT groups (4.8 log10 copies/mL); the median pre-ART CD4+ T-cell count was 281 cells/mm3 for CCR5Δ32/WT cases and 244 cells/mm3 for controls (P = .26). A higher proportion of CCR5Δ32/WT cases than WT controls maintained plasma HIV-1 RNA levels of <50 copies/mL after starting ART (69% vs 61%, respectively), although the difference was not statistically significant.
Median HIV-1 DNA levels were similar in CCR5Δ32/WT and WT individuals after 128–160 weeks of suppressive ART (1.79 and 1.84 log10 copies/106 PBMCs, respectively; Table 1). No significant associations between total HIV-1 PBMC DNA and CCR5Δ32/WT genotype were identified in unadjusted regression analysis or in models that adjusted for pre-ART CD4+ T-cell counts and plasma HIV-1 RNA levels (Table 1).
Human Immunodeficiency Virus Type 1 (HIV-1) DNA, Cell-Associated RNA, and 2–Long Terminal Repeat (LTR) Circles in CCR5Δ32/WT and Wild-Type Study Populations on Antiretroviral Therapy
| Variable | CCR5-Δ32 | CCR5 WT | Total | Unadjusted OR (95% CI)a | Adjusted OR (95% CI)b |
|---|---|---|---|---|---|
| Total population | |||||
| Subjects, no. | 114 | 177 | 291 | … | … |
| HIV-1 DNA, log10 copies/106 PBMCs | 1.79 (1.46–2.11) | 1.84 (1.48–2.17) | 1.83 (1.48–2.15) | 0.92 (.61–1.38) | 1.01 (.65–1.55) |
| CD4+ T-cell percentage at time of sampling | 30 (24–38) | 30 (22–38) | 30 (23–38) | … | … |
| HIV-1 DNA load, log10 copies/106 CD4+ T cellsc | 2.31 (1.96–2.72) | 2.40 (2.01–2.75) | 2.37 (1.98–2.74) | 0.89 (.61–1.30) | 1.00 (.65–1.53) |
| Random subset | |||||
| Subjects, no. | 40 | 40 | 80 | … | … |
| HIV-1 reservoir | |||||
| Detectable 2-LTR circles | 4 (10) | 7 (18) | 11 (14) | 0.53 (.14–1.96) | 0.55 (.14–2.13) |
| Detectable HIV-1 cell-associated RNA | 35 (88) | 33 (83) | 68 (85) | … | … |
| HIV-1 cell-associated RNA load | |||||
| Log10 copies/106 PBMCsd | 2.41 (1.91–2.87) | 2.46 (1.83–2.95) | 2.46 (1.87–2.92) | 0.82 (.47–1.44) | 0.84 (.47–1.48) |
| Log10 copies/106 CD4+ T cellsc,d | 2.87 (2.36–3.35) | 2.96 (2.43–3.46) | 2.93 (2.41–3.42) | 0.78 (.44–1.38) | 0.79 (.44–1.43) |
| HIV-1 cell-associated RNA/DNA ratio | 4.8 (1.0–11.9) | 5.3 (1.9–11.2) | 4.9 (1.1–11.7) | 0.96 (.50–1.84) | 0.92 (.47–1.81) |
| Activation and proliferation markers | |||||
| CD38 and HLA-DR expression | |||||
| Among CD4+ T cells, % | 1.8 (1.0–3.1) | 2.3 (1.2–4.6) | 2.0 (1.1–3.4) | 0.98 (.86–1.10) | 0.98 (.86–1.11) |
| Among CD8+ T cells, % | 0.5 (0.3–1.0) | 0.6 (0.4–1.2) | 0.5 (0.3–1.1) | 1.13 (.81–1.58) | 1.12 (.80–1.56) |
| CD69 expression | |||||
| Among CD4+ T cells, % | 1.0 (0.8–1.5) | 0.9 (0.7–1.1) | 1.0 (0.8–1.2) | 2.65 (.89–7.89) | 2.65 (.90–7.84) |
| Among CD8+ T cells, % | 1.8 (1.1–2.2) | 1.4 (1.1–1.9) | 1.5 (1.1–2.0) | 1.43 (.80–2.54) | 1.44 (.81–2.58) |
| Ki67 expression | |||||
| Among CD4+ T cells, % | 8.1 (4.7–10.4) | 8.0 (5.3–12.2) | 8.0 (5.2–10.6) | 0.99 (.91–1.08) | 1.00 (.91–1.09) |
| Among CD8+ T cells, % | 7.8 (4.0–10.6) | 8.3 (5.3–10.0) | 8.3 (4.8–10.1) | 1.01 (.90–1.14) | 1.01 (.90–1.14) |
| CD57 expression | |||||
| Among CD4+ T cells, % | 11.4 (5.4–14.9) | 13.1 (7.8–15.0) | 11.8 (6.7–14.9) | 0.96 (.90–1.03) | 0.96 (.90–1.03) |
| Among CD8+ T cells, % | 37.0 (24.1–53.6) | 44.6 (28.6–60.1) | 42.0 (27.1–55.8) | 0.98 (.96–1.01) | 0.98 (.96–1.01) |
| CCR5 | |||||
| Expression | |||||
| Among CD4+ T cells, % | 2.9 (1.9–4.1) | 2.9 (2.2–6.8) | 2.9 (2.0–5.0) | 0.91 (.79–1.05) | 0.91 (.78–1.06) |
| Among CD8+ T cells, % | 1.5 (1.3–2.1) | 2.1 (1.5–3.2) | 1.7 (1.3–2.6) | 0.86 (.60–1.24) | 0.86 (.60–1.24) |
| MFI | |||||
| Among CD4+ T cells | 3.0 (2.2–3.9) | 3.8 (2.8–6.7) | 3.3 (2.4–5.0) | 0.91 (.77–1.07) | 0.91 (.77–1.07) |
| Among CD8+ T cells | 2.8 (2.0–3.5) | 4.5 (3.0–5.7) | 3.3 (2.6–5.0) | 0.65 (.46–.91)e | 0.65 (.46–.90)e |
Data are no. (%) of subjects or median value (interquartile range).
Abbreviations: ART, antiretroviral therapy; CI, confidence interval; MFI, mean fluorescence intensity; OR, odds ratio; PBMC, peripheral blood mononuclear cell; WT, wild type.
a Data are from conditional logistic regression models (reference, CCR5 WT).
b ORs were adjusted for pre-ART plasma RNA (log10 copies/mL) and CD4+ T-cell counts (square-root transformed) in conditional logistic regression models (reference, CCR5 WT).
c Calculated from total PBMC DNA and CD4+ T-cell percentage at the time of sampling.
d Undetectable cell-associated RNA was imputed at half the lower limit of detection.
e Statistically significant (P = .01).
Baseline characteristics in the random subset of 40 CCR5Δ32/WT and 40 WT individuals for whom flow cytometry, cell-associated RNA quantification, and 2-LTR circle quantification were performed were comparable to those of the study participants overall. No significant differences in the proportion of individuals with detectable 2-LTR circles or detectable cell-associated RNA were identified between CCR5Δ32/WT and WT patients in this subset analysis. Furthermore, no significant differences in log10 RNA copies per 106 PBMCs, log10 RNA copies per 106 CD4+ T cells, or RNA to DNA ratio were observed (Table 1).
There were no significant differences between CCR5Δ32/WT and WT individuals with respect to markers of CD4+ or CD8+ lymphocyte activation (CD38, HLA-DR, CD25, or CD69), maturity (CD57), or proliferation (Ki67). CCR5 mean fluorescence intensity (MFI) on CD8+ T cells was significantly lower in samples from CCR5Δ32/WT participants (odds ratio, > 0.65; P = .01), but there were no significant differences between CCR5Δ32/WT and WT individuals with respect to the percentage of CD4+ T cells expressing CCR5 or the CCR5 MFI (Table 1). Overall, CCR5 expression was low for both CCR5Δ32/WT and WT samples.
We identified significant positive correlations between activated CD38/HLA-DR–expressing CD4+ T cells and the frequency and level of CCR5 expression (P < .001 and P = .018, respectively; Figure 1). Interestingly, lower levels of HIV-1 cell-associated RNA were correlated with a higher percentage of CCR5-expressing PBMCs (R = −0.27; P = .019) and a higher CCR5 MFI for both PBMCs (R = −0.30; P = .009) and CD4+ T cells (R = −0.24; P = .043; Figure 1). No significant associations were identified between markers of CD4+ T-cell activation and cell-associated RNA levels.
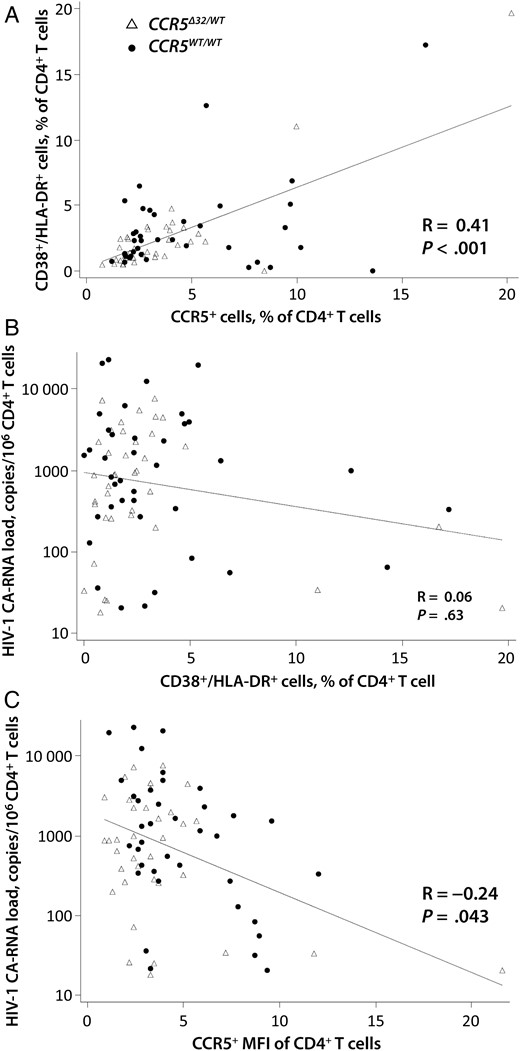
Relationships between human immunodeficiency virus type 1 (HIV-1) cell-associated RNA (CA-RNA) levels and CD4+ T-cell markers of activation and CCR5 expression. A significant positive correlation was observed between the percentage of CCR5-expressing CD4+ T cells and the frequency of activated (CD38+/HLA-DR+) CD4+ T cells (A), but not between the frequency of CD38+/HLA-DR+ CD4+ T cells and HIV-1 cell-associated RNA copies (B). Lower levels of HIV-1 cell-associated RNA were correlated with a higher CCR5 mean fluorescence intensity (MFI) of CD4+ T cells (C). Correlation coefficients (R) and P values were obtained by Spearman rank correlation analysis. Trend lines were generated using linear regression models.
DISCUSSION
In this study, involving one of the largest cohorts of CCR5Δ32/WT individuals receiving long-term suppressive ART, HIV-1 DNA and cell-associated RNA levels and the frequency of detectable RNA and 2-LTR circles were similar between CCR5Δ32/WT and WT individuals. Furthermore, there were no significant differences in markers of lymphocyte activation or proliferation between CCR5Δ32/WT and WT individuals after long-term ART. However, CCR5 expression as measured by MFI was significantly lower on CD8+ T cells from CCR5Δ32/WT individuals. Expression of CCR5 has been shown to decline for 36 months after ART initiation [12] and because of PBMC cryopreservation. We observed a low frequency of surface CCR5-expressing T cells in both CCR5Δ32/WT and WT individuals. The low numbers of CCR5-expressing cells may explain the lack of observed significant differences in the frequency of CCR5 expressing CD4+ T cells between the CCR5Δ32/WT and WT groups.
HIV-1 reservoirs, as measured by low-level, residual plasma viremia and cell-associated HIV-1 DNA, demonstrate biphasic decay after ART initiation [13, 14], with a faster HIV-1 DNA decay rate in the first year and slower decay phase thereafter [13]. It is possible that differences in HIV-1 cell-associated RNA levels between CCR5Δ32/WT and WT individuals are greater during the initial 1–2 years following ART initiation and become less pronounced after longer-term ART. Of note, odds ratios in our regression models for cell-associated RNA levels, RNA/DNA ratio, and the frequency of LTR circles were <1.0, consistent with the possibility of a protective effect of CCR5-Δ32 heterozygosity and HIV-1 reservoir size. However, none of the odds ratios reached statistical significance.
Interestingly, higher levels of CCR5 expression on PBMCs and CD4+ T cells from both CCR5Δ32/WT and WT individuals were associated with lower levels of HIV-1 cell-associated RNA. This finding is counterintuitive as it has been postulated that decreased CCR5 expression may lead to a reduction in the level of residual replication in the setting of ART [8]. Maraviroc intensification therapy has also been shown to increase HIV-1 reactivation through higher CCR5-ligand expression and upregulation of the nuclear factor κB pathway [15]. However, a prior study of CCR5Δ32/WT individuals did not find any evidence of decreased nuclear factor κB signaling in Δ32 heterozygous individuals [8]. We also observed a significant positive correlation between CD4+ T-cell markers of activation and CCR5 expression but not between activation markers and HIV-1 transcription. None of our study participants were exposed to maraviroc therapy.
Our findings are in contrast with a smaller, prior study of 18 CCR5Δ32/WT patients in whom cell-associated RNA levels were significantly correlated with the level of CCR5 expression on CD4+ T cells [8]. In that study, CD4+ T cells from CCR5Δ32/WT patients had significantly lower cell-associated RNA levels, RNA/DNA ratios, and frequency of detectable 2-LTR circles as compared to WT individuals [8]. The reasons for divergent results between our investigation and the prior study may be explained, in part, by differences in the quantitative PCR assays used, the makeup of the patient cohort, the duration of ART, and the study design. For example, the prior study used samples from patients receiving ART for 1.4–1.8 years, whereas our patients were all treated with suppressive ART for >2.6 years, allowing them to reach stabler HIV-1 cell-associated RNA and DNA levels.
It is also possible that early ART initiation influences the relationship between reservoir size and CCR5 expression. However, the prior study described above identified significant differences between CCR5Δ32/WT and WT individuals treated during chronic infection. Although we lacked information regarding the timing of ART initiation, a large majority of our participants were likely treated during chronic infection, given the low median pretreatment CD4+ T-cell counts observed. A limitation of our study is that HIV-1 nucleic acids were extracted from frozen PBMC pellets or cryopreserved PBMCs. Therefore, we did not measure HIV-1 reservoirs from purified CD4+ T cells; direct measures of these parameters in purified CD4+ T cells may have yielded different results. In addition, low levels of CCR5 expression secondary to cryopreservation may have led to the lack of observed differences between our case and control groups. However, the prior positive study also relied on cryopreserved cells.
In summary, the relationship between CCR5-Δ32 heterozygosity, CCR5 expression, and markers of HIV-1 persistence is likely to be complex and may be influenced by factors such as duration of ART. Further longitudinal studies are needed to fully understand the impact of CCR5Δ32/WT on viral transcription and reservoir size.
Notes
Disclaimer. The content is solely the responsibility of the authors and does not necessarily represent the official views of the National Institute of Allergy and Infectious Diseases (NIAID) or the National Institutes of Health (NIH).
Financial support. This work was supported by the NIAID (award U01AI068636 and grants 1K23AI098480-01A1, UM1 AI068636 [to the AIDS Clinical Trials Group Virology Support Laboratory], UM1 AI068634 [to the AIDS Clinical Trials Group Statistical and Data Management Center], UM1 AI068636 [to the AIDS Clinical Trials Group], UM1 AI106701 [to the ACTG Virology Specialty Laboratory], and P30 AI060354 [to the Harvard CFAR Program in Therapeutics]), the National Institute of Mental Health, and the National Institute of Dental and Craniofacial Research, NIH; and the Foundation for AIDS Research (ARCHE grant).
Potential conflicts of interest. D. R. K. is a consultant to and has received honoraria from Bristol-Myers Squibb, Gilead, InnoVirVax, Merck, and ViiV; grant support from Gilead and Merck; and speaking honoraria from Gilead and Merck. All other authors report no potential conflicts. All authors have submitted the ICMJE Form for Disclosure of Potential Conflicts of Interest. Conflicts that the editors consider relevant to the content of the manuscript have been disclosed.
References
Author notes
Present affiliation: Division of Experimental Medicine, University of California–San Francisco.

