


Abstract
Background Single questions on self-reported morbidity are commonly used in social or health surveys. It has been suggested that these may underestimate socioeconomic gradients in health because more disadvantaged social groups may have higher thresholds for defining illness.
Method Face-to-face interviews by research nurses with community-based respondents in the West of Scotland, using a specially designed suite of prompts following up on responses to the UK General Household Survey (GHS) long-standing illness question. Participants were 858 respondents born in the early 1930s and 852 respondents born in the early 1950s (mean age at interview 59 and 40, respectively) classified by occupational social class and area deprivation.
Results Adjusted for age and sex, the Relative Index of Inequality (RII) for reporting any condition in response to the GHS question was 2.14 (95% CIs 1.49–3.08) for social class and 2.01 (1.41–2.87) for Depcat. Among those not reporting any conditions to the GHS question, the RII for reporting conditions to any further prompts was 1.54 (0.87–2.70) for social class and 0.86 (0.50–1.46) for Depcat. The RIIs for reporting any condition after the initial question and all prompts were 2.16 (1.40–3.33) for social class and 1.50 (0.98–2.29) for Depcat. Across a range of conditions defined as more serious, and conditions classified by different ICD categories, socioeconomic status (SES) gradients after the initial question and all prompts were similar to, or less steep than, those produced by the GHS question alone.
Conclusions These data do not support the hypothesis that poorer social groups are more stoical and more likely to need detailed prompting in order to elicit morbidity. Nor do they support the hypothesis that SES gradients in morbidity are underestimated by using the GHS question rather than more detailed questioning. This suggests that responses to this type of question can be used in epidemiology and health needs assessment without major socioeconomic bias.
Introduction
Gradients in mortality and morbidity by socioeconomic status (SES) have consistently been observed in all developed countries: persons with lower SES have poorer health and are more likely to die early, this relationship being a graded one across SES groups.1,2 In assessing the prevalence of ill health by individual or area SES, simple self-reported measures of chronic illness are often preferred to mortality rates. This is because: accurate estimates of mortality rates may only be available around the time of national censuses, which provide denominator data by sociodemographic variables (whereas self-reported illness and SES data can be collected by postal or interview surveys); chronic illness is a better marker of need for health care resources; and mortality rates are low at younger ages. Chronic illness (health status) is usually preferred to measures of acute or recent illness (health state) because it is assumed to measure more stable characteristics of individuals and to provide better estimates of need for care.3 In Britain the most widely used questions are one on long-standing illness (LSI), used in the General Household Survey (GHS) since 1972,4 and one on limiting long-term illness (LLTI) first used in the 1991 census.5 Both questions produce marked socioeconomic gradients and variations between small areas and regions: for example, in 2002 rates of LSI varied from 25% among those in households headed by a higher professional to 44% among those in households headed by a worker in a routine occupation.4
It has been suggested that responses to such questions may be influenced by social factors. An analysis of LLTI measured in the 1991 census found that after taking into account a wide range of sociodemographic variables, residents in Wales overreported LLTI while residents in Scotland underreported it, suggesting that there may be regional/cultural differences in proneness to claiming limiting illness.6 Rates of LSI have increased steadily in the GHS (from 21% in 1972 to 35% in 2002) during a period of declining mortality rates, leading to the suspicion that thresholds for reporting LSI may be changing.4
It has variously been suggested that gradients in LSI or LLTI might overestimate or underestimate socioeconomic gradients in the burden of disease. Responses to an LSI question asked in face-to-face home interviews in Finland were compared with the results of a health examination at a mobile clinic. Controlling for sex and age, there was more ‘overreporting’ among lower educational groups, and the authors suggest that the health interview method might, therefore, lead to overestimates of socioeconomic differences in chronic morbidity.7 A Swedish study of social class differences in the social consequences of illness suggested that the prevalence of LLTI may be overestimated in manual workers because this might limit work capacity more than it would among non-manual workers.8
In contrast several authors have suggested that self reports may underestimate SES gradients because of lower expectations of health, and therefore higher thresholds of perceiving ill health, among more socially disadvantaged groups; and because of greater severity of disease, and more co-morbidity, among low SES groups. Several studies have shown that socially disadvantaged groups have more stoical attitudes to defining themselves as ill than more advantaged groups.9–12 Blaxter found that among manual social classes, those who defined their health as poor had high rates of illnesses and disabilities, while among non-manual social classes some who defined their health as poor had no disease or disability.3 In The Netherlands self reports of chronic lung disease, heart disease, diabetes, and cancer generated lower prevalence estimates than diagnostic questionnaires in the same survey, diagnoses by the respondents' general practitioners, and cancer registries, this underreporting being particularly marked among respondents with lower education.13,14
Several studies have shown greater severity of disease and co-morbidity among lower SES groups. Manual social classes not only have higher rates of LSI but they also have more long-term illnesses, and experience these with a greater intensity and frequency.15 Studies of specific conditions (such as asthma and hip pain) have reported an inverse relationship between severity and SES.16,17 In the British Health and Lifestyle survey, among respondents reporting LSI those in lower income groups were significantly more likely to report this as a result of disabling or life-threatening conditions, to have more conditions, and to have worse respiratory and cognitive functioning.18
Although there are suggestions that there might be SES differences in response to questions about chronic illness, few studies have directly examined this issue (and the two that did reached opposite conclusions7,18). This paper aims systematically to explore this issue in relation to LSI, using a suite of questions designed to supplement the GHS question. Our hypotheses were that more prompts would be required to elicit any conditions from lower SES respondents; that SES gradients would be steeper after all the prompts; that lower SES respondents would initially report more serious conditions, and less serious ones only in response to prompts; and that lower SES respondents might require more prompting to report particular types of conditions (such as mental health problems).
Methods
The sample
The data are from The West of Scotland Twenty-07 Study, a prospective survey of health inequalities following three age groups (born in the early 1930s, 1950s, and 1970s) from 1987/88. It is based on a two-stage stratified random sample within the Central Clydeside Conurbation, a predominantly urban area in the West of Scotland with a population of 1.5 million (around one-third of the Scottish population) in 1991. This area has generally poor health, and had an all-cause standardized mortality ratio (SMR), relative to Scotland, of 109 in 1981; however, the SMRs of the 52 postcode sectors forming the primary sampling units ranged from 62 to 147, so a full range of variation in health status is represented. These postcode sectors were selected to represent the range of social advantage/disadvantage as measured by employment rates and proportion in low income socioeconomic groups at the 1981 census. Further details of the design are described elsewhere.19,20 Each sweep of fieldwork was approved by the University of Glasgow's Ethics Committee for non-clinical research on human subjects.
We use data collected in 1991 because: this was the first time we applied a special module on chronic illness to both the older two cohorts; contemporary data are available from census on area level deprivation and on the SES representativeness of our sample; and we have previously published an analysis of responses to this module in that year in relation to gender.21 The response rate to this second sweep of data collection was 82% in the older and 87% in the middle cohort. The achieved sample size with data on LSI was 858 in the older cohort (mean age = 59.1, SD = 0.56), and 852 in the middle one (mean age = 40.0, SD = 0.76). They were broadly representative in SES characteristics of those of similar age in the study area at the 1991 Census.22
The measures
Face-to-face home interviews were conducted by trained nurse interviewers. Respondents were asked the standard question (referred to subsequently as the GHS question): ‘Do you have a long-standing illness, disability or infirmity? By long-standing I mean anything that has troubled you over a period of time or that is likely to affect you over a period of time?’.4 This question was followed by a series of additional prompts as follows: The nurses asked ‘is there anything else?’ after the initial GHS question and after each prompt, and recorded the name of each condition reported and the question that had elicited it. After recording the names of all chronic conditions named in response to all four questions the nurses went back to ask a more detailed set of questions about each condition (covering limitation, duration, and pain or discomfort). All the reported conditions were categorized into three levels of seriousness, using the UK Royal College of General Practitioners' (RCGP) classification of ‘serious, intermediate, and trivial’ conditions.25
‘Do you have any other health problems or conditions which seriously affect your health now or which you think will seriously affect your health in the future and which you haven't already told me about?’ (‘serious’ prompt)
‘Do you suffer from anxiety or depression, or do you have any mental problems, phobias, panics or nervous disorders which you haven't already told me about?’ (‘mental’ prompt)
‘I am going to show you two cards showing lists of conditions people suffer from. I would like you to tell me whether you suffer from any of them. Some of them may be conditions which you have already told me about.’ (‘card’ prompt). The card presented 35 conditions. Their selection was based on the most frequent causes of death in 1987 in Scotland,23 the conditions most frequently consulted for in the 1981 National Morbidity Survey,24 and the conditions mentioned by more than 25 of the respondents in the oldest cohort in the first sweep of the Twenty-07 study.
We classified as relatively severe conditions that were: We also classified the conditions into five broad groups: mental, vascular, respiratory, digestive, and musculoskeletal, using the International Classification of Diseases 9th revision.26
non-trivial (i.e. RCGP intermediate or serious)
had lasted longer than a year
limited activities quite a lot or a very great deal, or
caused pain or discomfort quite a lot of the time or all the time.
We use the two measures of SES, which are most frequently used in the UK: occupational social class of head of household, using the UK Registrar General's 6-fold classification27; and Depcat, the 1991 version of the 7-fold classification of the Carstairs–Morris deprivation score for the postcode sector of residence,28,29 based on proportions of: overcrowded households, unemployed males, heads of household in social classes IV and V, and non-owner occupied properties. This ecological measure is commonly used in needs assessment and resource allocation calculations in the UK. Of those responding to the chronic illness module there were no missing data on age, sex, or Depcat, and 15 cases with missing data on social class.
Analysis strategy
The analysis is person-based rather than condition-based. We dichotomized the subjects in three different ways. The first was according to whether or not they reported a condition to the GHS question alone. This was to check that the expected SES gradients were, indeed, present in the data. We then subdivided those who did not report a condition to the GHS questions according to whether or not they reported one to the additional prompts. The test for an SES gradient in this additional reporting is the test of our main hypothesis. Finally, we divided people into whether they reported a condition to either the GHS question or the additional prompts, in order to show the effect on the SES gradient of including the prompts. The classification by ‘seriousness’ categories and ICD codes was similarly based on whether or not the subject reported a condition in that category.
As a summary measure for the SES gradient in reporting of chronic conditions we chose the Relative Index of Inequality (RII).30 This is derived by ranking the subjects on each of the SES measures, social class, and Depcat. As both measures are discrete, the mean rank of each social class, or each Depcat category, is assigned to all its members. Dividing the resulting ranks by the sample size, gives an index that varies between 0 and 1, and takes into account both the different number of categories and the number of subjects in each category. The RII can be interpreted as the ratio of reported chronic illness of the most deprived relative to the most advantaged.
For each of the dichotomies described, we used logistic regression to estimate the RII and repeated this for each SES measure and each classification of conditions. All of these analyses were adjusted for age and sex. We tested for two-way interactions between SES and cohort on the grounds that there might be stronger SES gradients in the 1930s cohort; these were not significant so are not included in the models.
Results
Of the respondents 58% said ‘yes’ to the GHS question (47% in the 1950s and 71% in the 1930s cohorts). An additional 20% said ‘yes’ to one or more subsequent prompts, giving an overall prevalence of 78% after all prompts (Table 1). Thus almost half (48%) who had said ‘no’ to the GHS question said ‘yes’ to a subsequent prompt.
Numbers (%) saying ‘yes’ to initial GHS question; of those saying no to initial GHS question, numbers (%) saying ‘yes’ or ‘no’ to any further prompts; and prevalence after GHS and all prompts: by (a) social class, and (b) Depcat
| No to GHS: response to any prompt | ||||||||||||||||||
|---|---|---|---|---|---|---|---|---|---|---|---|---|---|---|---|---|---|---|
| Yes to GHS | Yes | No | Prevalence after all prompts | |||||||||||||||
| Total n | n | % | n | % | n | % | n | % | ||||||||||
| (a) Social class | ||||||||||||||||||
| I | 128 | 70 | 55 | 28 | 48 | 30 | 52 | 98 | 77 | |||||||||
| II | 417 | 208 | 50 | 87 | 42 | 122 | 58 | 295 | 71 | |||||||||
| IIIn | 260 | 145 | 56 | 62 | 54 | 53 | 46 | 207 | 80 | |||||||||
| IIIm | 593 | 350 | 59 | 120 | 49 | 123 | 51 | 470 | 79 | |||||||||
| IV | 212 | 146 | 69 | 37 | 56 | 29 | 44 | 183 | 86 | |||||||||
| V | 85 | 67 | 79 | 9 | 50 | 9 | 50 | 76 | 89 | |||||||||
| Total | 1695 | 986 | 58 | 343 | 48 | 366 | 52 | 1329 | 78 | |||||||||
| (b) Depcat | ||||||||||||||||||
| 1 | 173 | 89 | 51 | 41 | 49 | 43 | 51 | 130 | 75 | |||||||||
| 2 | 123 | 61 | 50 | 25 | 40 | 37 | 60 | 86 | 70 | |||||||||
| 3 | 238 | 118 | 50 | 65 | 54 | 55 | 46 | 183 | 77 | |||||||||
| 4 | 411 | 243 | 59 | 80 | 48 | 88 | 52 | 323 | 79 | |||||||||
| 5 | 265 | 161 | 61 | 54 | 52 | 50 | 48 | 215 | 81 | |||||||||
| 6 | 281 | 167 | 59 | 51 | 45 | 63 | 55 | 218 | 78 | |||||||||
| 7 | 219 | 155 | 71 | 30 | 47 | 34 | 53 | 185 | 85 | |||||||||
| Total | 1710 | 994 | 58 | 346 | 48 | 370 | 52 | 1340 | 78 | |||||||||
As expected, those in lower SES groups were more likely to say ‘yes’ to the initial GHS question (OR = 2.14, CI = 1.49–3.08 for class and 2.01, 1.41–2.87 for Depcat). However, contrary to hypothesis, among those who said ‘no’ to the GHS question there was no significant difference by class (1.54, 0.87–2.70) or Depcat (0.86, 0.50–1.46) in the likelihood of reporting any conditions to the further prompts. Combining the response for the GHS question and all prompts, therefore, led to an odds ratio for class (2.16, 1.40–3.33) very similar to that initially observed for the GHS question. For Depcat the odds ratio for all questions combined was non-significant and lower (1.50, 0.98–2.29) than observed for the GHS question alone (Figures 1 and 2).
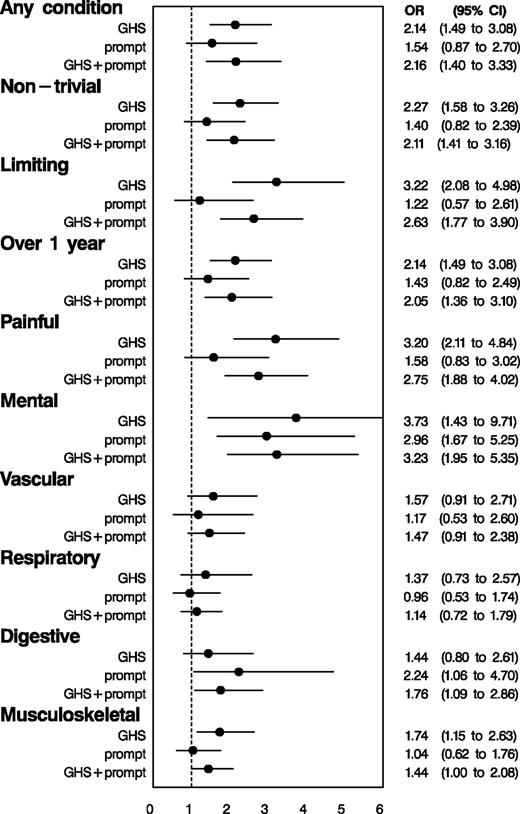
Relative Index of Inequality (RII) (with 95% CIs), of responses to the initial GHS question and to further prompts among those who said no to the GHS question, and overall prevalence, by social class
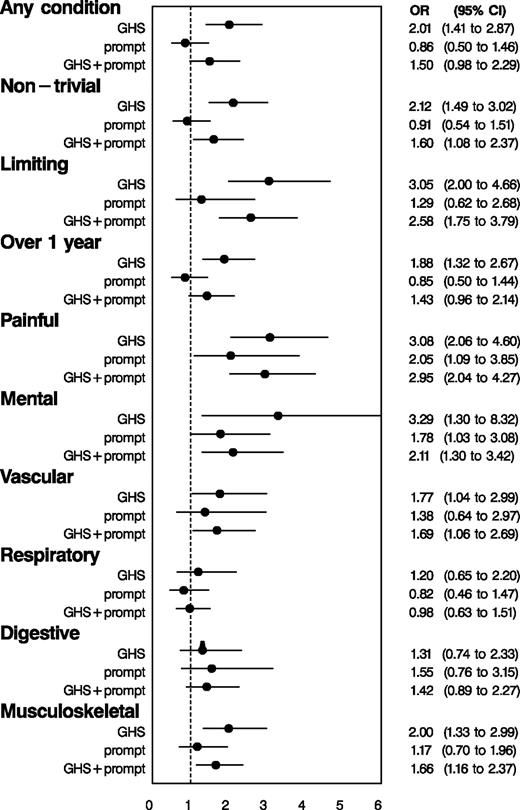
RII (with 95% CIs), of responses to the initial GHS question and to further prompts among those who said no to the GHS question, and overall prevalence, by Depcat
For ‘non-trivial’ conditions there was little SES differentiation by social class or Depcat in response to the GHS question, responses to the prompts among those who had said no to the GHS question, or the combined prevalence (Figures 1 and 2; Supplementary Table 2). For the other more severe classifications (limiting, long duration and painful conditions), the ‘yes’ responses to the GHS question were more strongly patterned by both social class and Depcat than responses to any of the prompts among those who said no to the GHS question (only one of which, painful conditions by Depcat, was statistically significant). In consequence the prevalence from the combined questions was less strongly socially graded than that observed from the GHS question.
For conditions grouped into ICD categories (Figures 1 and 2; Supplementary Table 3), only the responses to the mental prompt reached statistical significance (by class and Depcat) among those who said no to the GHS question. For all condition groups except digestive, the social gradient by class and Depcat for the GHS question alone was steeper than for the GHS question plus prompts.
Discussion
The prevalence of LSI elicited by the GHS question, was, as expected, strongly patterned by SES. Our findings of steep SES gradients, and of particularly steep SES gradients for long duration, painful and limiting conditions among lower SES respondents, are consistent with those of other studies.15–18 The high prevalence in this study is consistent with other reports of high chronic illness prevalence in the West of Scotland.31
As we have previously reported, additional prompting raises the reported prevalence of LSI substantially, the prompts have a dramatic effect on the reported prevalence of mental conditions (from 4 to 14.5%), and the majority of the extra conditions resulted from presenting the respondents with cards showing named conditions.21 This mirrors findings from the GHS itself. In 1977 and 1978 the GHS used a different method for measuring chronic illness.32,33 Respondents were shown a card with ‘common health problems or symptoms’, and were asked whether they had any of these ‘Health problems that are recurring or that you have all the time’. They were also asked to report whether they had any other problems not listed on the card. In response to this question format, prevalence of chronic illness rose from 25% the previous year to 56% among men, and from 26 to 70% among women.
Our data do not, however, support the hypothesis that those in poorer social circumstances are more likely to fail to report significant morbidity in response to the GHS question and need additional prompting to elicit chronic health problems. There was no significant SES gradient in reporting conditions among those who had not reported any to the initial GHS question. Nor do they support the hypothesis that SES gradients in morbidity are underestimated by using the GHS question rather than more detailed questioning. Rather they suggest the opposite is more often the case: steeper gradients did not emerge in response to detailed further prompting, even for mental health conditions that previous literature suggests might not be considered ‘real illness’ by poorer groups. The only exception was for digestive disorders, for which we have no explanation.
The observed gradients for the additional yield from the extra prompts among those who said no to the GHS question should be treated with some caution. These analyses are all based on smaller numbers and, in cases where the GHS prevalence is high, there are few persons remaining in the lower social classes or more deprived areas. As a result, the estimates tend to be less reliable than those of the GHS prevalence or that of the GHS plus the additional prompts. Given the high initial prevalence by the GHS question alone, the scope for generating steeper SES gradients is constrained.
This analysis is limited in that there is no gold standard by which we can assess ‘real’ prevalence and therefore ‘real’ levels of underreporting or overreporting. It is also limited in that it only includes two narrow age groups rather than a representative sample of all age groups, and it is located in only one region of the UK, the West of Scotland. The extent to which these findings are generalizable to other age groups and places is an empirical question that requires similar studies to be undertaken on other samples. However, it might be expected that relatively disadvantaged people born in the 1930s in the West of Scotland would have particularly stoical attitudes towards illness and high thresholds for defining themselves as ill given the high rates of material, social, and health disadvantage experienced in this area during the depression and war years. To a lesser extent one would also expect this among those born in the 1950s. The fact that we did not observe a greater extra yield among the more socioeconomically disadvantaged in this region is particularly surprising because it runs counter to expectations from studies of lay concepts of illness, which report more stoicism in lower social class because of higher levels of co-morbidity, lower expectations of health and functioning, and more adverse life events.
Given the widespread use of the GHS question (and its census counterpart) in research and policy on inequalities in health, it is surprising how few studies have directly examined SES differences in the way people respond to such questions and the sort of conditions they fail to capture. In the absence of such research it is commonly assumed that they either overestimate or underestimate SES gradients. This study suggests that neither is the case, but we would urge further research to provide firmer evidence on this important point.
Supplementary data
Supplementary data are available at IJE Online.
Declaration of Interest
The authors have declared no conflict of interest.
It has been suggested that because of higher thresholds for defining illness among socially disadvantaged people, self-reported morbidity may underestimate SES gradients in health.
We tested this in an adult sample in Scotland by adding additional prompts to a standard question on long-standing illness.
There were no SES differences in the additional ‘yield’ from extra prompts, and SES gradients after all prompts were similar to or less steep than in response to the standard question.
Graeme Ford designed the suite of questions, jointly had the idea for this paper, and worked on an earlier analysis before taking retirement because of ill health. Michele Robertson undertook extensive preliminary data sorting and analysis. All authors discussed the analysis strategy and drafts of the paper. G.D. did the analysis reported here. S.M. jointly had the idea for the paper, reviewed the literature, and wrote the first and final drafts. S.M. is guarantor. We are grateful to all participants and survey staff working on the Twenty-07 Study, and to Fiona McDonald and Laura McKay for working on the tables. The West of Scotland Twenty-07 Study is funded by the UK Medical Research Council, as are S.M. and G.D. J.N. was employed at the Robertson Centre for Biostatistics, University of Glasgow, at the time of this analysis.
References
Blaxter M. Self-definition of health status and consulting rates in primary care.
Rickards L, Fox K, Roberts C, Fletcher L, Goddard E. Living in Britain no 31: Results from the 2002 General Household Survey. London: TSO,
Senior ML. Area variations in self-perceived limiting long term illness in Britain, 1991: Is the Welsh experience exceptional?
Heliovaara M, Aromaa A, Klaukka T, Knekt P, Joukama M, Impivaara O. Reliability and validity of interview data on chronic disease: the mini-Finland health survey.
Lindblom C, Burstrom B, Diderichsen F. Class differences in the social consequences of illness?
Blaxter M, Paterson E. Mothers and Daughters; A Three Generational Study of Health Attitudes and Behaviour. London: Heinemann,
Cornwell J. Hard-earned Lives: Accounts of Health and Illness from East London. London: Tavistock,
Koos E. The Health of Regionville: What the People Thought and did about it. New York: Hefner Publishing Co.,
Mackenbach J, Looman C, van der Meer JBW. Differences in the reporting of chronic conditions, by level of education: the effect on inequalities in prevalence rates.
Schrijvers C, Stronks K, van de Mheen D, Coebergh J, Mackenbach J. Validation of cancer prevalence data from a postal survey by comparison with cancer registry records.
Blank N, Diderichsen F. Social inequalities in the experience of illness in Sweden: a "double suffering".
Strachan D, Anderson H, Limb E, O'Neill A, Wells N. A national survey of asthma prevalence, severity and treatment in Great Britain.
Eachus J, Chan P, Pearson N, Propper C, Davey Smith G. An additional dimension to health inequalities: disease severity and socioeconomic position.
O'Donnell O, Propper C. Equity and the distribution of UK National Health Service resources.
Macintyre S, Annandale E, Ecob R et al. The West of Scotland Twenty-07 study; health in the community. In: Martin C, McQueen D, editors. Readings for a New Public Health. Edinburgh: Edinburgh University Press,
Ford G, Ecob R, Hunt K, Macintyre S, West P. Patterns of class inequality throughout the lifespan; class gradients at 15, 35 and 55 in the West of Scotland.
Macintyre S, Ford G, Hunt K. Do women ‘over-report’ morbidity? Men's and women's responses to structured prompting on a standard question on long standing illness.
Der G. A Comparison of the West of Scotland Twenty-07 Study Sample and the 1991 Census SARs. Glasgow: MRC Medical Sociology Unit,
Information and Statistics Division. Scottish Health Statistics 1988. Edinburgh: Common Services Agency for the Scottish Health Service,
Office of Population Censuses and Surveys. Morbidity Statistics from General Practice 1981–2: Third National Study. London: HMSO,
Royal College of General Practitioners. The Classification and Analysis of General Practice Data. London: Royal College of General Practitioners,
World Health Organisation. International Statistical Classification of Diseases, Injuries and Causes of Death, 9th revision. Geneva: World Health Organisation,
Office of Population Censuses and Surveys. Classification of Occupations 1980. London: HMSO,
Carstairs V, Morris R. Deprivation and Health in Scotland. Aberdeen: Aberdeen University Press,
McLoone P. Carstairs Scores for Scottish Postcode Sectors for the 1991 Census. Glasgow: Public Health Research Unit, University of Glasgow,
Wagstaff A, Paci P, von Doorslaer E. On the measurement of inequalities in health.
Shaw A, McMunn A, Field J (eds). The Scottish Health Survey 1998: Vol 1. Edinburgh: The Stationery Office,

