


Abstract
A high visit-to-visit variability in cholesterol levels has been suggested to be an independent predictor of major adverse cardiovascular events in patients with coronary artery disease (CAD). Because whether this notion applies to general population is not known, we aimed to investigate the associations between total cholesterol (TC) variability and the risk of all-cause mortality, myocardial infarction (MI), and stroke.
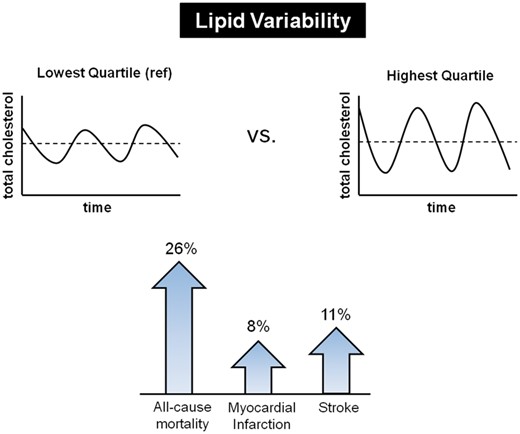
We identified 3 656 648 subjects without a history of MI and stroke who underwent ≥3 health examinations from 2002 to 2007 in the Korean National Health Insurance System cohort. Total cholesterol variability was measured using the coefficient of variation (CV), standard deviation (SD), and variability independent of the mean (VIM). There were 84 625 deaths (2.3%), 40 991 cases of MI (1.1%), and 42 861 cases of stroke (1.2%) during the median follow-up of 8.3 years. There was a linear association between higher TC variability and outcome measures. In the multivariable adjusted model, the hazard ratios and 95% confidence intervals comparing the highest vs. lowest quartiles of CV of TC were 1.26 (1.24–1.28) for all-cause mortality, 1.08 (1.05–1.11) for MI, and 1.11 (1.08–1.14) for stroke, which was independent of mean TC levels and the use of lipid-lowering agents. The results were consistent when modelling variability of TC using SD and VIM, and in various sensitivity analyses.
High variability in lipid levels is associated with adverse health-related outcomes. These findings suggest that lipid variability is an important risk factor in the general population.
Introduction
The intra-individual variability in various physiologic measures has been of increasing interest in recent years. For example, lower heart rate variability and higher blood pressure (BP) variability have been consistently linked to adverse outcomes such as vascular events, impaired cognition, and mortality.1–5 Recently, a high visit-to-visit variability in cholesterol levels was suggested to be an independent predictor of major adverse cardiovascular events (MACE).6–8 A post - hoc analysis from the Treating to New Target (TNT) trial evaluated patients with stable coronary artery disease (CAD) and showed that visit-to-visit low-density lipoprotein cholesterol (LDL-C) variability independently predicted any coronary event, any cardiovascular event, death, myocardial infarction (MI), and stroke.6 Another study evaluated the role of visit-to-visit LDL-C and high-density lipoprotein cholesterol (HDL-C) variability and showed that both indices were associated with increased occurrence of a 5-year MACE in patients presenting with ST-segment elevation MI.7 Higher intra-individual variation in LDL-C was also associated with lower cognitive performance and lower cerebral blood flow.8 While the benefit of lipid-lowering is well established and accepted as a key measure of cardiovascular disease prevention,9 , 10 a residual risk of adverse outcomes still remains.11 These studies raised an important question whether variability in cholesterol levels could be an additional risk factor. However, no study has evaluated the role of cholesterol variability as a determinant of cardiovascular or cerebrovascular events and mortality among the general population. Previous studies were restricted to specific or high-risk populations with relatively small sample size, or only assessed selected outcomes.6–8 Therefore, we conducted a large population-based study involving more than 3 650 000 Koreans who had at least three total cholesterol (TC) measurements to examine the prognostic significance of increased variability of TC on all-cause mortality, MI, and stroke during a median 8.3 years follow-up.
Methods
Data source and study population
The National Health Insurance System (NHIS) comprises a complete set of health information pertaining to 50 million Koreans, which includes an eligibility database (e.g. age, sex, socioeconomic variables, type of eligibility, and income level), a medical treatment database (based on the medical bills that were claimed by medical service providers for their medical expense claims), a health examination database (results of general health examinations and questionnaires on lifestyle and behaviour), and a medical care institution database (types of medical care institutions, location, equipment, and number of physicians).12–14 National Health Insurance Corporation (NHIC) is the single insurer, managed by the Korean government, to which approximately 97% of the Korean population subscribes. Enrollees in the NHIC are recommended to undergo a standardized medical examination at least every 2 years. Among 7 878 662 subjects (age ≥ 20 years) who underwent health examinations in 2007 (index year), 4 169 901 subjects underwent three or more health examinations from 1 January 2002 to 31 December 2007. We excluded 390 595 subjects with missing data on at least one variable. To avoid confounding by pre-existing diseases and minimize the possible effects of reverse causality, those who had a history of MI [International Classification of Disease, 10th Revision (ICD-10) codes: I21, I22] or stroke (ICD-10 codes: I63, I64) before the index year were also excluded (n = 122 658). Ultimately, the study population consisted of 3 656 648 subjects (see Supplementary material online, Figure S1). This study was approved by the Institutional Review Board of The Catholic University of Korea (No. KC16OISI0627). Anonymous and de-identified information was used for analysis and, therefore, informed consent was not obtained.
Measurements and definitions
Body mass index (BMI) was calculated as the subject’s weight in kilograms divided by the square of the subject’s height in meters. Obesity was defined as BMI ≥ 25 kg/m2. Information on current smoking and alcohol consumption was obtained by questionnaire. Regular exercise was defined as physical activity that was performed at least five times per week. Income level was dichotomized at the lower 10%. Blood samples for the measurement of serum glucose and TC levels were drawn after an overnight fast. Hospitals wherein these health examinations were performed were certified by the NHIS and subjected to regular quality control. The presence of diabetes mellitus was defined according to the following criteria: (i) at least one claim per year under ICD–10 codes E10–14 and at least one claim per year for the prescription of antidiabetic medication, or (ii) fasting glucose level ≥ 126 mg/dL. The presence of hypertension was defined according to the presence of at least one claim per year under ICD-10 codes I10 or I11 and at least one claim per year for the prescription of antihypertensive agents, or systolic/diastolic BP ≥ 140/90 mmHg. The presence of dyslipidaemia was defined according to the presence of at least one claim per year under ICD-10 code E78 and at least one claim per year for the prescription of a lipid-lowering agent, or TC ≥ 240 mg/dL.
Definition of cholesterol variability
Total cholesterol variability was defined as variability in TC values measured on health examinations. Three indices of variability were used: (i) coefficient of variation (CV), (ii) standard deviation (SD), and (iii) variability independent of the mean (VIM). Variability independent of the mean was calculated as 100 × SD/Meanbeta, where beta is the regression coefficient, on the basis of the natural logarithm of the SD over the natural logarithm of the mean. The number of TC measurements per subject ranged from 3 to 6: 3 measurements (n = 1, 518, 345, 42%), 4 measurements (n = 670, 241, 18%), 5 measurements (n = 580, 956, 16%), and 6 measurements (n = 887, 106, 24%).
Study outcomes and follow-up
The endpoints of the study were newly-diagnosed MI, stroke, or death. Myocardial infarction was defined as the recording of ICD-10 codes I21 or I22 during hospitalization or these codes having been recorded at least two times. Stroke was defined as the recording of ICD-10 codes I63 or I64 during hospitalization with claims for brain magnetic resonance imaging or brain computerized tomography. Although it was difficult to clearly define the subtype (ischaemic vs. haemorrhagic) of stroke, we attempted to exclude cerebral haemorrhage. Subjects without MI or stroke during their follow-up periods were considered to have completed the study at the date of their death or at the end of follow-up, whichever came first. The study population was followed from baseline to the date of death or cardiovascular events, or until 31 December 2015, whichever came first.
Statistical analysis
Baseline characteristics are presented as the mean ± SD or n (%). Participants were classified into four groups according to the TC variability quartiles. The incidence rate of primary outcomes was calculated by dividing the number of incident cases by the total follow-up duration (person-years). The survival and disease-free probability of primary outcomes according to the quartiles of TC variability was calculated by using Kaplan–Meier curves, and the log-rank test was performed to analyse differences among the groups. Hazard ratios (HR) and 95% confidence interval (95% CI) values of all-cause mortality, MI, and stroke were analysed using the Cox proportional hazards model for quartile or decile groups of TC variability. Proportional hazards assumption was evaluated by the Schoenfeld Residuals Test with the logarithm of the cumulative hazards function based on Kaplan–Meier estimates for quartile or decile groups of TC variability. There was no significant departure from proportionality in hazards over time. The multivariable-adjusted proportional hazards model was applied: Model 1 was adjusted for age, sex and BMI; Model 2 was further adjusted for alcohol drinking, smoking, regular exercise, and income status; Model 3 was further adjusted for the presence of diabetes mellitus and hypertension; and Model 4 was further adjusted for mean TC level and use of lipid-lowering agents. To avoid the possible effect of multi-collinearity caused by correlation between CV and mean TC, we also used baseline TC level instead of mean TC level in Model 4 of the Cox proportional hazards model. To eliminate the possible influence of the interval between measurements of TC levels, we performed separate analyses in subjects with different numbers of measurements. Sensitivity analyses were also performed, excluding subjects with endpoints occurring within 3 or 5 years of follow-up, excluding subjects with ischaemic heart disease (ICD-10 codes I20 or I23–25), myocarditis (ICD-10 codes I40–41), and cardiomyopathy (ICD-10 codes I42–43), or excluding subjects with hypertension, diabetes mellitus, and dyslipidaemia to account for the possibility of reverse causation. A time-dependent Cox regression analysis was performed in order to account for the changes in TC levels during the follow-up period (2008–2010). The potential effect modification by age, sex, obesity, diabetes mellitus, hypertension, malignancy, and use of lipid-lowering agents was evaluated through the stratified analysis and interaction testing using a likelihood ratio test. In subgroup analyses, HR (95% CI) of the highest quartile (Q4) group was compared with the lower three quartiles (Q1–3) as a reference group. Statistical analyses were performed using SAS version 9.4 (SAS Institute Inc., Cary, NC, USA), and a P-value < 0.05 was considered to indicate statistical significance.
Results
Baseline characteristics and study population
Characteristics of participants by quartiles of CV for TC are described in Table 1. Subjects in higher quartiles of TC variability were older, were more likely to be female, had a higher prevalence of co-morbid conditions, and used lipid-lowering agents more frequently. The mean TC levels were approximately 190 mg/dL in all four groups. The CV values of TC in the Q1–Q4 groups were 4.25 ± 1.36%, 7.48 ± 0.77%, 10.38 ± 0.97%, and 16.78 ± 4.65%, respectively. Similar patterns of baseline characteristics were noted by quartiles of SD (see Supplementary material online, Table S1) and VIM (see Supplementary material online, Table S2). For trend values, P < 0.0001 for all variables, owing to the large study population.
Baseline characteristics of subjects according to the total cholesterol variability (coefficient of variation)
| Q1 (n = 914 161) | Q2 (n = 914 163) | Q3 (n = 914 162) | Q4 (n = 914 162) | |
|---|---|---|---|---|
| Age (years) | 44.4 ± 12.7 | 44.0 ± 12.0 | 44.4 ± 12.2 | 46.8 ± 13.2 |
| Sex (male) | 617 004 (67.5) | 645 473 (70.6) | 631 752 (69.1) | 576 204 (63.0) |
| Body mass index (kg/m2) | 23.6 ± 3.1 | 23.6 ± 3.1 | 23.7 ± 3.0 | 23.8 ± 3.1 |
| Systolic BP (mmHg) | 122.4 ± 14.6 | 122.5 ± 14.4 | 122.8 ± 14.6 | 123.5 ± 15.2 |
| Diastolic BP (mmHg) | 76.8 ± 9.9 | 77.0 ± 9.8 | 77.1 ± 9.8 | 77.3 ± 10.1 |
| Fasting glucose (mg/dL) | 94.1 ± 19.8 | 94.3 ± 20.2 | 94.7 ± 21.2 | 96.8 ± 24.5 |
| Mean TC (mg/dL) | 192.3 ± 30.5 | 191.9 ± 30.2 | 191.7 ± 30.2 | 193.5 ± 31.0 |
| TC variability | ||||
| CV (%) | 4.25 ± 1.36 | 7.48 ± 0.77 | 10.38 ± 0.97 | 16.78 ± 4.65 |
| SD (mg/dL) | 8.18 ± 2.95 | 14.35 ± 2.70 | 19.89 ± 3.66 | 32.54 ± 10.82 |
| VIM (%) | 8.24 ± 2.64 | 14.49 ± 1.51 | 20.10 ± 1.90 | 32.47 ± 8.98 |
| Current smoker | 274 353 (30.0) | 288 685 (31.6) | 282 571 (30.9) | 253 577 (27.7) |
| Alcohol consumption | 511 493 (56.0) | 528 774 (57.8) | 517 862 (56.7) | 469 182 (51.3) |
| Regular exercise | 63 637 (7.0) | 61 414 (6.7) | 63 171 (6.9) | 70 640 (7.7) |
| Income (lower 10%) | 73 991 (8.1) | 69 926 (7.7) | 77 085 (8.4) | 94 455 (10.3) |
| Hypertension | 193 650 (21.2) | 191 354 (20.9) | 202 452 (22.2) | 255 726 (28.0) |
| Diabetes mellitus | 48 868 (5.4) | 50 103 (5.5) | 57 220 (6.3) | 89 942 (9.8) |
| Dyslipidaemia | 86 446 (9.5) | 95 875 (10.5) | 117 448 (12.9) | 209 373 (23.0) |
| On lipid-lowering agent | 42 894 (4.7) | 44 763 (4.9) | 56 918 (6.2) | 131 140 (14.4) |
| Any malignancy | 8413 (0.9) | 7947 (0.9) | 8939 (1.0) | 13 013 (1.4) |
Data are expressed as the mean ± SD, or n (%).
BP, blood pressure; CV, coefficient of variation; SD, standard deviation; TC, total cholesterol; VIM, variability independent of the mean.
All-cause mortality
There were 84 625 deaths (2.3%) during a median (5–95%) follow-up of 8.3 (8.0–8.8) years in the entire cohort. Incidence rate was approximately 60–70% higher in the CV Q4 group compared with other groups (Table 2, Figure 1). An incrementally higher risk of all-cause mortality was observed with higher CV quartiles compared with lowest quartile group in all models (see Supplementary material online, Table S3, Table 2). After adjusting for age, sex, BMI, alcohol consumption, smoking, regular exercise, income, presence of diabetes mellitus and hypertension, mean TC level, and use of lipid-lowering agents, the association between cholesterol variability and all-cause mortality still remained significant [HR (95% CI): Q2, 1.03 (1.00–1.05); Q3, 1.08 (1.06–1.10); Q4, 1.26 (1.24–1.28)] (Table 2). To determine the linear trends of the risk, we explored the HRs of all-cause mortality by TC variability decile groups, with the first decile serving as the reference category. The multivariable-adjusted HRs of all-cause mortality increased continuously and linearly, and statistical significance was observed from the fifth decile (D5) of CV group (Figure 2).
Hazard ratios and 95% confidence intervals of all-cause mortality, myocardial infarction and stroke by quartiles of total cholesterol variability (coefficient of variation)
| Events (n) | Follow-up duration (person- years) | Incidence rate (per 1000 person- years) | Adjusted HR (95% CI)a | |
|---|---|---|---|---|
| All-cause mortality | ||||
| Q1 | 18 557 | 7 609 048 | 2.4 | 1 (ref) |
| Q2 | 17 239 | 7 612 608 | 2.3 | 1.03 (1.00–1.05) |
| Q3 | 19 231 | 7 604 753 | 2.5 | 1.08 (1.06–1.10) |
| Q4 | 29 598 | 7 569 197 | 3.9 | 1.26 (1.24–1.28) |
| P for trend | <0.0001 | |||
| Myocardial infarction | ||||
| Q1 | 9294 | 7 574 752 | 1.2 | 1 (ref) |
| Q2 | 9032 | 7 579 280 | 1.2 | 1.02 (0.99–1.05) |
| Q3 | 9667 | 7 569 634 | 1.3 | 1.05 (1.02–1.08) |
| Q4 | 12998 | 7 521 513 | 1.7 | 1.08 (1.05–1.11) |
| P for trend | <0.0001 | |||
| Stroke | ||||
| Q1 | 9632 | 7 576 013 | 1.3 | 1 (ref) |
| Q2 | 9206 | 7 581 311 | 1.2 | 1.05 (1.02–1.08) |
| Q3 | 10008 | 7 570 911 | 1.3 | 1.07 (1.04–1.10) |
| Q4 | 14015 | 7 522 395 | 1.9 | 1.11 (1.08–1.14) |
| P for trend | <0.0001 | |||
Adjusted for age, sex, body mass index, alcohol consumption, smoking, regular exercise, income, diabetes mellitus, hypertension, mean total cholesterol level, and use of lipid-lowering agent (model 4). Models 1–3 are presented in the Supplementary material online, Table S3.
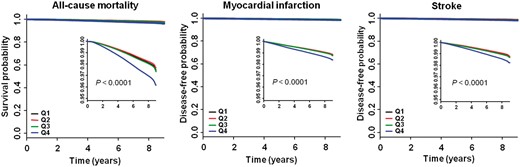
Kaplan–Meier estimates of survival and disease-free probability by quartiles of total cholesterol variability measured as coefficient of variation. High resolution images are shown as an inset.
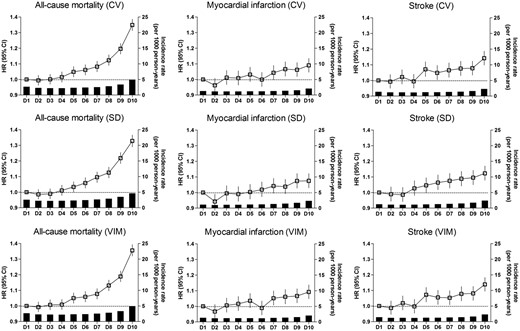
Incidence rates, hazard ratios, and 95% confidence intervals of all-cause mortality, myocardial infarction, and stroke by deciles of total cholesterol variability. Adjusted for age, sex, body mass index, alcohol consumption, smoking, regular exercise, income, diabetes mellitus, hypertension, mean total cholesterol level, and use of lipid lowering-agent.
Myocardial infarction and stroke
There were 40 991 cases of MI (1.1%) and 42 861 cases of stroke (1.2%) that were diagnosed during the follow-up period. Incidence rates of both outcomes were approximately 50% higher in the CV Q4 group compared with other groups (Table 2, Figure 1). An incrementally higher risk of both outcomes was observed with higher CV quartiles compared with lowest quartile group in all models, although the Q2 group showed borderline significance for MI (see Supplementary material online, Table S3, Table 2). Subjects in the CV Q4 group had an approximately 8% higher risk of MI and 11% higher risk of stroke compared with the CV Q1 group. Analysis according to decile groups revealed that the risk of MI significantly increased from the seventh decile (D7) of CV group, and the risk of stroke significantly increased from the CV D5 group (Figure 2).
Sensitivity analysis
The results were consistent when the variability of TC was determined using SD and VIM. Total cholesterol variability as measured by SD or VIM was also an independent predictor of all-cause mortality, MI, and stroke even after full multivariable adjustment (see Supplementary material online, Tables S4 and S5, Supplementary material online, Figures S2 and S3, Figure 2). The results were nearly identical when baseline TC level was used instead of mean TC level in model 4 of the Cox proportional hazards model (data not shown). When the variability index was used as a continuous variable, 5% increase in CV was associated with significantly increased risk for outcomes after full multivariable adjustment [HR (95% CI): all-cause mortality, 1.09 (1.08–1.09); MI, 1.03 (1.02–1.04); stroke, 1.03 (1.03–1.04)]. Excluding subjects with ischaemic heart disease, myocarditis, and cardiomyopathy (see Supplementary material online, Table S6), or excluding subjects with hypertension, diabetes mellitus, and dyslipidaemia (see Supplementary material online, Table S7) did not attenuate the association between TC variability and outcomes. Additionally, similar results were observed when subjects with endpoints that occurred within 3 or 5 years of follow-up were excluded (see Supplementary material online, Tables S8 and S9). Analysis confined to subjects with yearly measurements of TC also revealed similar results with higher HRs for all-cause mortality and stroke compared with the original analysis (see Supplementary material online, Table S10). Our observation was largely consistent independent of the numbers of TC measurement (data not shown). Incorporation of follow-up TC levels as time-varying covariates showed similar trends with even higher HRs in the Q4 group compared with the original analysis (see Supplementary material online, Table S11).
Subgroup analysis
Stratified analysis by age, sex, presence or absence of obesity, diabetes mellitus, hypertension, and use of lipid-lowering agents was conducted. The Q4 group of TC variability remained predictive of worse survival in all subgroups compared with the Q1–3 group. Higher adjusted HRs of all-cause mortality were observed among the subgroups of younger age, male, absence of obesity, absence of hypertension, and not taking lipid-lowering agent (Figure 3). These findings were common with other indices of variability (see Supplementary material online, Figures S4 and S5). The significant association between TC variability Q4 group and the incidence of MI and stroke was also present in various subgroups, except in subjects with diabetes or those using lipid-lowering agents. To account for the possible influence on survival, we performed the subgroup analysis according to the history of malignancy. The associations between TC variability and all-cause mortality were consistent in subjects with or without malignancy. Because the older subjects had higher TC variability compared with younger subjects (see Supplementary material online, Table S12), we further conducted a stratified analysis where age groups were used as stratum. Significant associations between higher TC variability and higher risk of all-cause mortality and stroke were observed in all age groups (see Supplementary material online, Tables S13 and S14). However, the association between higher TC variability and the risk of MI was lost in the youngest age (20–39) group (see Supplementary material online, Table S15). Taking lipid-lowering agents can greatly affect the lipid variability both by the initiation of the medication and by the drug compliance. Therefore, we performed detailed analysis according to the use of lipid-lowering agents. Whereas subjects without lipid-lowering therapy showed similar results with total cohort (see Supplementary material online, Table S16), the association between TC variability and all-cause mortality was attenuated in subjects on lipid-lowering therapy (see Supplementary material online, Table S17). Of note, TC variability Q4 group had lower risk of stroke compared with Q1 group in subjects on lipid-lowering therapy.
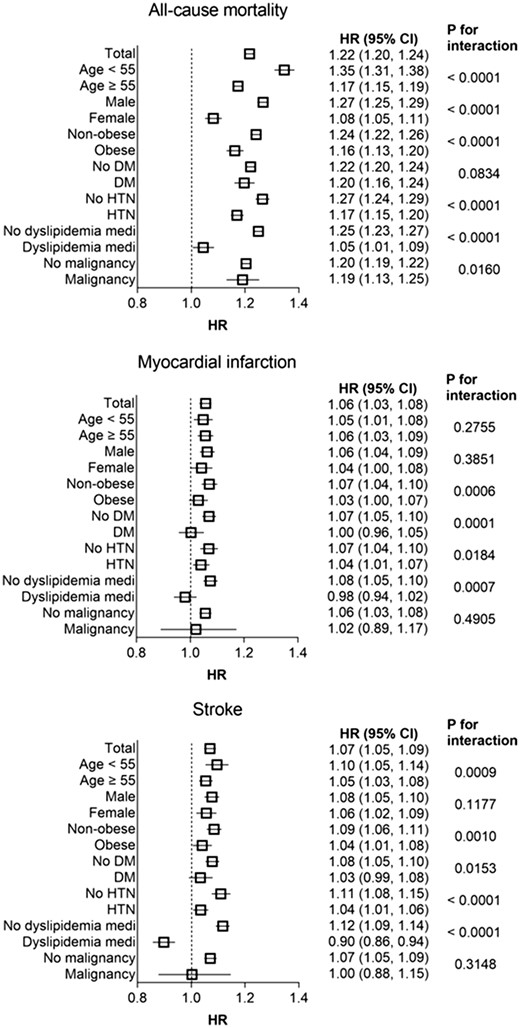
Hazard ratios and 95% confidence intervals of all-cause mortality, myocardial infarction, and stroke in the highest quartile vs. lower three quartiles of total cholesterol variability (coefficient of variation) in subgroups. Adjusted for age, sex, body mass index, alcohol consumption, smoking, regular exercise, income, diabetes mellitus, hypertension, mean total cholesterol level, and use of lipid lowering-agent.
Discussion
Interpretation
In this large-scale and long-term follow-up study, we examined the association between lipid variability and the risk of all-cause mortality, MI, and stroke in the Korean population. We found that TC variability is an independent predictor of these adverse events, even after adjusting for possible confounding factors including mean TC level. There was a linear association between the increase in TC variability and outcome measures. The results were consistent with different indices of variability and by various sensitivity analyses. Our study also demonstrated a greater impact of lipid variability on low-risk subjects, such as younger age, non-obese groups or individuals without metabolic diseases.
Variability in biological parameters has been recognized as a new biometric that has clinical relevance in patients with CAD.1–4 Depressed heart rate variability was found to be a marker of malignant arrhythmia and sudden cardiac death in patients with a history of MI.4 Visit-to-visit BP variability was found to be a significant indicator of underlying vascular dysfunction and adverse cardiovascular events in patients with CAD.1 , 3 Only a small number of studies have been published to date on the effects of cholesterol variability,6–8 raising its potential role as an additional residual risk factor for future cardio- or cerebrovascular events. However, previous studies were not representative of the general population. The TNT trial evaluated patients who had stable CAD,6 and another study evaluated patients who had survived from the acute phase of MI.7 It is important to know whether variability in cholesterol levels also affects future outcomes among the general population, and our study adds supportive data on this emerging issue.
While the exact mechanism remains to be elucidated, several explanations could be suggested. First, high cholesterol variability may lead to the fluctuations in the composition of atherosclerotic plaques. High variability of cholesterol levels may induce a repeated process of crystallization and dissolution of the cholesterol within the confined space of coronary plaques.15 This process may increase the risk of the pointed shard formation that can cut through fibrous membranes, leading to plaque rupture which is a central pathophysiologic mechanism of MI and stroke. Second, endothelial dysfunction may act as a mediator, as it can be caused by many of the risk factors that predispose to atherosclerosis, including changes in cholesterol levels.16–18 It was reported that higher LDL-C variability was associated with lower cerebral blood flow but also with greater white matter hyper-intensity load, which has been linked to endothelial dysfunction.8 Third, numerous drugs may have unintended effects on lipid levels.19 Subjects taking multiple medications tend to have increased lipid variability, and these individuals may represent a high-risk group. Fourth, lipid variability may be linked to body weight variability, which was demonstrated to have negative health outcomes.20 Higher variabilities of multiple biological parameters might be observed in patients with systemic conditions and generalized frailty.6 Therefore, it is possible that high cholesterol variability is an epiphenomenon of other systemic conditions that increase cardiovascular or mortality risk. Whether such associations are direct, indirect, due to shared risk factors or a combination of these awaits further investigation. Lastly, non-adherence to the use of lipid-lowering agents could be a factor linking lipid variability to adverse outcomes. The beneficial effects of statins are rapidly lost and often transiently reversed when acutely discontinued.21–25 For instance, discontinuation of statin therapy in survivors of acute coronary syndrome was associated with significantly higher short-term and long-term mortality.22 , 25 Statin discontinuation may induce a rebound phenomenon by abrogating beneficial pleiotropic effects, such as plaque stabilization, anti-inflammatory and antioxidant effects, and improvement in endothelial function.17 However, we observed significant associations between TC variability and adverse outcomes even after adjusting for mean TC levels and the use of lipid-lowering agents. In a previous study evaluating the effect of pravastatin on MACE, the association between cholesterol variability and cognitive impairment was present in both the placebo and pravastatin groups.8 These findings suggest that the association between cholesterol variability and adverse outcomes does not merely reflect pleiotropic effects of statins or non-adherence to statins.
Subgroup analysis also demonstrated that high TC variability was related to increased mortality in the groups of subjects taking or not taking lipid-lowering agents. However, the association between high TC variability and the risk of outcomes was weakened in the subjects using lipid-lowering agents compared with subjects not using lipid-lowering agents. New use of lipid-lowering agents might be related to high TC variability, but it is likely that the beneficial effects of the use of lipid-lowering agents mitigated the impact of high TC variability on adverse health outcomes. Interestingly, subjects in the Q4 group of TC variability had a lower risk of incident stroke compared with the Q1 group in the subgroup taking lipid-lowering agents. Stroke is a heterogenous disease, and the relationship between lipid levels or variability and stroke seems to be more complicated.26 , 27
High variability in total cholesterol levels is associated with increased risks of all-cause mortality, myocardial infarction, and stroke in general population.
Strength and limitations
Our study has strength in that it is a large-scale, long-term follow-up study evaluating the influence of cholesterol variability on mortality and cardiovascular disease. The NHIS database represents the entire Korean population, and this study is the first evidence showing that lipid variability is an important risk factor, not only in patients with CAD but also in the general population. However, several limitations also should be acknowledged. First, discrepancies between the diagnosis of individuals in medical practice and that recorded in claim data may have led to inaccurate analysis. This could be partially overcome by combining laboratory and standard questionnaire information from the health examination database. Generally, the proportion of discrepancies in diagnosis might be more prominent in claim data from outpatient clinics, less severe illnesses, and primary care clinics, compared with hospitalized inpatients, severe illnesses, and tertiary or general hospitals.12 , 14 Therefore, we defined newly-developed MI and stroke by combination of disease code, hospitalization, and imaging studies on the basis that these events mostly result in hospitalization. Notably, mortality data from the national registry have substantial accuracy and completeness. Second, because this was not a prospective study, causality cannot be determined. However, in order to minimize the possible effects of reverse causality, subjects with pre-existing MI or stroke were excluded. Sensitivity analysis excluding subjects with outcomes occurring in the first 3 or 5 years of follow-up also revealed similar results. Third, the specific cause of mortality could not be assessed with this database. According to the ‘Cause of death statistics 2015’ released by the Korean government,28 cardiac disease, cerebrovascular disease, diabetes, and hypertensive disease were ranked at 2nd, 3rd, 6th, and 10th cause of death, respectively. This suggests that large proportion of death might have possible link with lipid levels or variability in their underlying pathophysiology. Fourth, data on other lipid profiles, such as HDL-C, LDL-C, or triglyceride, were not available. Lastly, because only the Korean population was included, our findings cannot be extrapolated to people with different ethnicities.
Conclusions
In this nationwide population-based cohort study, we observed that cholesterol variability is an independent predictor for developing MI, stroke, and mortality. A dose–response relationship was noted between higher TC variability and adverse outcome measures. The data were largely consistent when using CV, SD, and VIM as indices of variability as well as in various subgroups. These findings suggest that lipid variability is an important risk factor, not only in patients with CAD but also in the general population. Future studies should examine whether reducing variability of lipid parameters decreases adverse outcomes.
Supplementary material
Supplementary material is available at European Heart Journal online.
Acknowledgements
The authors thank Prof. Gunseog Kang (Department of Statistics and Actuarial Science, Soongsil University, Seoul, Korea) for statistical assistance. This study was performed using the database from the National Health Insurance System (NHIS-2016-1-103), and the results do not necessarily represent the opinion of the National Health Insurance Corporation.
Conflict of interest: none declared.
References
Author notes
See page 3567 for the editorial comment on this article (doi: )

