


Abstract
Aims: In heavy alcohol consumption laboratory tests represent an objective evidence. In this study we compared older and newer biomarkers in blood and in hair.
Methods: Carbohydrate-deficient transferrin (CDT), ethyl glucuronide (EtG), AST, ALT, GGT, MCV were measured in a large sample (n = 562). All people declared no alcohol consumption within the last 3 months. Serum CDT was measured by the candidate HPLC reference method and expressed as relative amount of disialotransferrin (%DST: cutoff 1.7%). EtG was measured in hair by a validated in-house method by LC–MS/MS (cutoff 30 pg/mg).
Results: Respectively, 42 (7.5%) and 76 (13.5%) subjects were positive to CDT and EtG. In particular, 30 (5.3%) subjects were positive to both tests, 12 (2.1%) only to CDT, while 46 (8.2%) only to EtG. The agreement (positive and negative pairs) between CDT and EtG was 89.7%. Interestingly, 6 out of 12 (50%) CDT-positive subjects had EtG < 15 pg/mg, whereas 27 out of 46 (59%) EtG-positive subjects had CDT < 1.1%. Forty-one out of 76 (54%) EtG-positive subjects display EtG values within 30–50 pg/mg.
Conclusion: Large variability exists between CDT and EtG in detecting chronic alcohol consumption. We suggest to use CDT, or a combination of different biomarkers, to identify alcohol abuse in a forensic context. EtG results close to the cutoff (30–50 pg/mg) should be cautiously considered before any sanction is assigned.
INTRODUCTION
Besides AST, ALT, MCV and GGT, in these last years carbohydrate-deficient transferrin (CDT) has emerged as the more popular alcohol biomarker to detect chronic alcohol consumption, particularly in subjects attending the Local Medical Commission for license regranting (Arndt, 2001; Bianchi et al., 2010). CDT indicates collectively the glycoforms of human transferrin with 0–2 terminal sialic acid residues, namely asialo- and disialotransferrin, which increase in alcohol abuse consequently to the shift in carbohydrate composition of transferrin toward glycoforms with a lower degree of glycosylation (Arndt, 2001). CDT has been shown to be a very specific biomarker when evaluated following the Working Group on Standardization of CDT measurement (IFCC-WG-CDT)'s recommendations (Jeppsson et al., 2007). Accordingly, recent studies, assessing CDT measured by HPLC and expressed as relative amount of disialotransferrin (%DST) to compensate for variable levels of total transferrin, have shown that many of the physiological and pathological factors, previously supposed to affect CDT, were indeed due to unspecific methodologies applied for CDT analysis (Bergstrom and Helander, 2008). Few confirmed interferences, accounting for false positive diagnoses of alcohol abuse, were still reported, including rare congenital disorders of glycosylation (Helander et al., 2004), genetic transferrin variants (Helander et al., 2001), severe liver disease (Arndt et al., 2008; Stewart et al., 2010) and pregnancy (Bianchi et al., 2011; Kenan et al., 2011).
More recently, other alcohol biomarkers, measured in different biological matrices, have become commercially available or are at various stages of research and development, including ethyl glucuronide (Etg) and ethyl sulfate (EtS) (Wurst et al., 2003; Helander and Beck, 2004), phosphatidyl ethanol (PEth) (Aradottir et al., 2006), fatty acid ethyl esters (FAEEs) (Yegles et al., 2004) and 5-hydroxytryptophol (5-HTOL) (Beck and Helander, 2003).
EtG is a direct metabolite derived from the non-oxidative metabolism of alcohol, being detectable in urine within 1 h of intake (Helander and Beck, 2004). Urinary EtG is a sensitive marker of alcohol consumption, frequently used for sobriety assessment in subjects committed to abstinence in rehabilitation programs. EtG may be also evaluated in hair to identify chronic abusers and recommendations by the Society of Hair Testing (SoTH) are available (SoTH, 2011). However, many problems related to EtG remain unsolved, including large biological variability and interferences due to alcohol-based hygiene products, medications, cosmetics or even foods (Martins Ferreira et al., 2012; Arndt et al., 2013; Crunelle et al., 2014). In particular, no established population-based studies, demonstrating the extension of variability of hair EtG between individuals, are available (Crunelle et al., 2014); moreover, several authors have reported that hair treatment, including frequent shampooing, dyeing, bleaching or heat hear straightening, may significantly influence EtG content in hair (Crunelle et al., 2014). Despite contrasting data have emerged from studies focused on the correlation between amount of alcohol consumption and content of EtG in hair (Lees et al., 2012; Crunelle et al., 2014), this biomarker has been rapidly implemented in many laboratories and even used by Local Medical Commissions, in combination or, in some cases, as replacement of CDT. Few studies comparing sensitivity and specificity of CDT and EtG, in detecting chronic abusers, have reported better analytical performances of EtG over CDT (Morini et al., 2011; Pirro et al., 2011a; Kharbouche et al., 2012); however, data were limited by the reduced sample size, poor statistical analysis or the unreliability of self-reported alcohol intake.
To investigate test performances in a real forensic scenario, hair EtG, serum CDT and classical alcohol biomarkers were assessed by the same laboratory in a large population of subjects applying for license regranting, who denied alcohol intake in the last 3 months.
MATERIALS AND METHODS
Subjects and samples
The participants in this study were subjects applying for driver's license regranting. The samples (blood and hair) were collected and analyzed at the Toxicology Laboratory of SS. Antonio e Biagio e C. Arrigo Hospital in Alessandria (Northern Italy). All subjects (n = 562; M:F 92%:8%; median age 36 years, IQR 29–45, min-max 19–79) were interviewed about their drinking habits by trained medical personnel and all declared no alcohol consumption within the last 3 months.
Blood samples were collected in Becton Dickinson Vacutainer Plastic Serum tubes (CDT and clinical chemistry parameters) and K3EDTA tubes (blood cell count). After clotting, serum was separated by centrifugation at 3500 g for 5 min and stored at −20°C for CDT analysis. Patient gave informed consent and study was planned according to the guidelines of the local ethical committee in conformity to the principles of the Declaration of Helsinki. All data were coded in order to ensure anonymity.
Methods
CDT was measured by the candidate HPLC reference method published by Helander (Helander et al., 2003). Briefly, 100 µl of serum were saturated with iron by adding 20 µl of ferric nitrilotriacetic acid (FeNTA, final concentration 1.7 mmol/l). After the addition of 20 µl of dextran sulfate (20 g/l)–CaCl2 (1 mol/l) solution (equal volumes), samples were left in the cold (4°C) for 30–60 min and then centrifuged at 3500 g at 5°C for 5 min. 100 µl of the clear surnatant were diluted with 400 µl of water and then transferred to glass HPLC vials. 200 µl were injected into an Agilent 1200 HPLC system with a SOURCE® 15Q PE 4.6/100 anion-exchange chromatography column (GE Healthcare Bio-Science, Uppsala, Sweden) kept at 25°C, using a ternary buffer gradient, as reported by the authors, with a flow of 1.0 ml/min, detection at 470 nm and a total run time of 40 min. According to IFCC-WG-CDT recommendations, CDT was expressed as percentage of disialotransferrin (%DST) to total transferrin, measured by chromatogram area integration. %DST positivity cutoff was fixed at 1.7%, as suggested by recent literature (Helander and Bergstrom, 2006).
Two set of controls (low control: 0.7–2.1%; high control: 2.6–4.4% supplied by Bio-Rad (Bio-Rad Laboratories, Hercules, USA) were run as triplicates, and always found within the range declared by the Manufacturer. External Quality Assessment was performed by taking part to GTFCh (Gesellschaft für Toxikologische und Forensische Chemie) Proficiency Test and EQUALIS (External Quality Assurance in Laboratory Medicine in Sweden).
Ethyl glucuronide in hair was measured by a validated in-house method in LC–MS/MS, following recommendations by the Society of Hair Testing (SoTH). Briefly, hair samples (lock of hair, 3 cm long, close to the scalp, 50 mg), collected with scissors from the posterior vertex as close as possible to the skin, were washed with 1 ml of dichloromethane and 1 ml of methanol. After complete removal of methanol, the hair was dried at room temperature and further cut with scissors. After the addition of 500 µl of water, internal standard aqueous solution (D5-EtG, 30 pg/mg) was added. Samples were incubated at 25°C overnight and then ultrasonicated for 2 h. Finally, samples were centrifuged at 13,000 rpm for 10 min and 15 µl of the supernatant was injected in the LC/ESI-MS/MS system 4000 Q-TRAP (Applied Biosystems/MDS SCIEX, Foster City, CA, USA) with a Kinetex (Phenomenex, Torrence, CA, USA) C18 chromatography column (50 × 3 mm i.d., particle size: 2.6 µm) kept at 40°C. The mobile phase consisted of a mixture of 0.1% (v/v) formic acid in water (A) and 0.1% (v/v) formic acid in methanol (B). Chromatographic elution was as follows: 100% A for 2.0 min, 1% A for 0.5 min, 0% A for 1.5 min, reequilibration at 100% A for 3 min. The transitions m/z 221 → 85 and m/z 221 → 75 were used as quantifier/qualifier for EtG, while the transition m/z 226 → 75 for D5-EtG. Hair EtG positivity cutoff was fixed at 30 pg/mg, as suggested by recent literature (SoTH, 2011).
Serum aspartate aminotransferase (AST), alanine aminotransferase (ALT) and gamma-glutamyl transferase (GGT) were measured on ADVIA 2400 (Siemens Healthcare, Milan, Italy) by its own kit based on IFCC recommendations. Mean corpuscular volume (MCV) was assessed by an ADVIA 2120 apparatus (Siemens Healthcare, Milan, Italy). Reproducibility was evaluated, at two levels of concentration (0.95 and 3% for CDT; 10 and 30 pg/mg for EtG), analyzing each control level as duplicates (two different sample preparations) in 10 analytical runs (design: 2 × 10 for each level). CDT reproducibility at 0.95 and 3% was respectively 2.2 and 1.2%. EtG reproducibility at 10 and 30 pg/mg was respectively 2.9 and 3.3%.
Statistical analysis
Statistical analyses and graphs were performed by SPSS statistical software v. 15.0 (SPSS, Inc., Chicago, IL, USA), R software v. 2.11.0 (R Foundation for Statistical Computing) and Statistica v. 7 (StatSoft, Inc., Tulsa, OK, USA). Continuous variables were reported as median value and interquartile range. Normality distribution was assessed by the Kolmogorov–Smirnov and the Shapiro–Wilk tests, and visually by histogram and kernel density plot. Association between continuous variables was measured by non-parametric Spearman's correlation. Differences between groups were estimated by non-parametric Mann–Whitney test (Bonferroni). Concordance between %DST and hair EtG was evaluated by analysis of concordant pairs and Cohen's kappa.
RESULTS
Median, mean, IQR (Interquartile Range) and min-max interval for AST, ALT, GGT, MCV, serum CDT and hair EtG in the whole sample are shown in Table 1. Although statistically significant, correlation was low for CDT-EtG (0.37, P < 0.0005), CDT-GGT (0.12, P = 0.005), AST-GGT (0.34, P < 0.0005), GGT-EtG (0.22, P < 0.0005) and MCV-EtG (0.20, P < 0.0005). Higher correlation was found between ALT-GGT (0.54, P < 0.0005) and ALT-AST (0.70, P < 0.0005).
Mean, median, IQR (interquartile range) and min-max interval for the variables investigated
| Marker | Mean | Median | IQR | Min-max |
|---|---|---|---|---|
| AST (IU/l) | 25 | 21 | 18–25 | 11–479 |
| ALT (IU/l) | 28 | 22 | 17–31 | 7–478 |
| GGT (IU/l) | 30 | 20 | 14–32 | 5–550 |
| MCV (fl) | 92 | 92.4 | 88.9–95.3 | 61.1–132.2 |
| CDT (%) | 1.2 | 1.1 | 0.9–1.3 | 0.3–3.7 |
| EtG (pg/mg) | 19 | 8 | 6–20 | 5–760 |
Respectively, 42/562 (7.5%) and 76/562 (13.5%) subjects were positive to CDT (>1.7%) and EtG (>30 pg/mg). In particular, 30 (5.3%) subjects were positive to both tests, 12 (2.1%) only to CDT, and 46 (8.2%) only to EtG (Fig. 1). Total agreement (positive and negative pairs) between CDT and EtG was 89.7%, with a Cohen's kappa of 0.46 (95% CI 0.32–0.58).
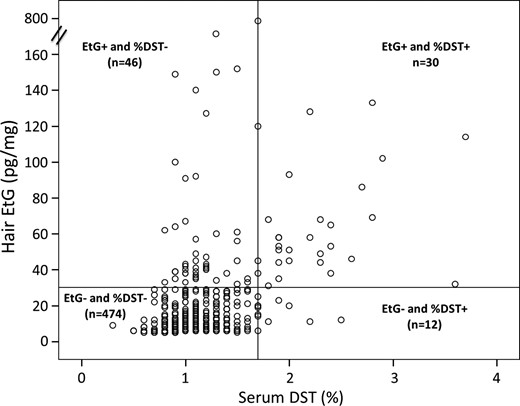
Comparison of %DST and EtG measured in 562 subjects applying for driver's license regranting. Reference lines were inserted at 1.7% (%DST) and at 30 pg/mg (EtG). A scale break was inserted in the y-axis to allow better data visualization.
CDT-positive subjects displayed significantly higher MCV (median 94.7 vs 92.3 fl; P = 0.003) and EtG (median 46 vs 8 pg/mg; P < 0.0005), but not AST, ALT and GGT, than CDT-negative subjects. EtG-positive subjects displayed significantly higher MCV (median 94.0 vs 92.1 fl; P = 0.001), GGT (28 vs 19 IU/l; P < 0.0005) and CDT (1.4 vs 1.1%; P < 0.0005), but not AST and ALT, than EtG-negative subjects.
Interestingly, 6 out of 12 (50%) CDT-positive subjects had EtG < 15 pg/mg, whereas 27 out of 46 (59%) EtG-positive subjects had CDT < 1.1%.
DISCUSSION
This study addresses the problem of the comparison between CDT and EtG using a real-life scenario. We selected a large sample of subjects applying for driver's license regranting. All subjects, interviewed by trained medical staff, declared no alcohol consumption within the last 3 months. Given elevated CDT and EtG values, these declarations were not entirely correct, confirming that alcohol consumption self-reports are rarely reliable even when collected by trained medical staff. In these patients we measured classical (AST, ALT, GGT, MCV) and novel (CDT, EtG) alcohol biomarkers, using validated methods and following international recommendations (IFCC-WG-CDT for CDT and SoTH for EtG in hair).
The first interesting observation resulting from this study is the poor correlation detected between classical and newest alcohol biomarkers. Indeed, although statistically significant, correlation coefficients were in many cases lower than 0.5, suggesting that only a minor proportion of the variability of one alcohol biomarker could be explained by another biomarker. This is not surprising, if considering that AST, ALT and GGT are not only markers of alcohol consumption but of liver damage, that can rise in different situations (age, BMI) and that present different kinetics.
On the other hand, our data still suggest an association between classical and new alcohol markers: patients positive to CDT or EtG showed indeed significantly higher levels of AST, ALT, GGT and MCV than CDT- or EtG-negative subjects. Discrepancy between data may be explained taking into account that correlation analysis is performed using continuous values, whereas in non-parametric Mann–Whitney analysis continuous EtG and CDT values were converted into qualitative variables (positive vs negative).
Although total agreement (positive and negative pairs among all patients) between CDT and EtG was high, only a minor proportion of the subjects positive to at least one biomarker (CDT or EtG) was found positive to both CDT and EtG. The difference between the frequency of single CDT-positive and single EtG-positive subjects cannot be interpreted solely on the basis of the presumed greater sensitivity of EtG: only few subjects with single CDT positivity displayed borderline EtG values (close to 30 pg/mg), and few patients even had low EtG values (<15 pg/mg). Moreover, the absence of clinical conditions or biological variables known to affect CDT positivity (end-stage liver disease, pregnancy, presence of a CDT variant) suggests that these subjects were indeed CDT true-positive subjects who were not identified by EtG (Bergstrom and Helander, 2008; Bianchi et al., 2011). Possible explanations for these false EtG negative samples are large inter-individual variability in the EtG synthesis and metabolism or sample adulteration. With this regard, while some hair treatment (dyeing, bleaching) may be identified or at least supposed during sample taking or pre-treatment, others, including frequent shampooing, or heat hear straightening, which may significantly decrease EtG content in hair, remain undetected (Crunelle et al., 2014).
Forty-six EtG-positive subjects were not identified as chronic alcohol abusers by CDT, with 27 even having low CDT values (<1.1%). Since the amount of alcohol intake declared by participants was not completely reliable, Etg positivity in these patients may be interpreted either as EtG false positivity or CDT false negativity. However, some speculations are still possible. Few data are available relating factors associated to false negative CDT results, but recently it has been suggested that pharmacological therapy could lower CDT values (Mundt et al., 2004; Vidali et al., 2014). This hypothesis cannot be excluded since in this work an accurate pharmacological anamnesis was not collected.
On the other hand, as previously reported (Sporkert et al., 2012), external sources for hair contamination (cosmetic treatment or contact with positive biological matrices) may account for EtG positivity, even up to very high EtG levels (Pirro et al., 2011b). Moreover, recent studies, evaluating EtG in hair, have shown that a large percentage of EtG-positive subjects display EtG values within 30–50 pg/mg, raising concerns about inter-individual variability and the resulting risk of false positive classification (Pirro et al., 2011b). This study is in accordance with these reports, since 41 out of 76 (54%) EtG-positive subjects display EtG values within 30–50 pg/mg.
Another possible reason to explain CDT and EtG disagreement may be found in their different kinetic. Whereas EtG, measured in a 3 cm long lock of hair, refers to the consumption of alcohol in the last 3 months (being 1 cm/month the average rate of hair growth), CDT becomes positive with a consumption >60 g/day of alcohol for at least 2 weeks with a half-life of about 10 days. However, it can be argued that if a subject, knowing the day of blood sampling, was able to stop or limit his alcohol consumption for some weeks and normalize CDT, his classification as chronic alcohol abuser would raise at least some doubts.
In conclusion, this study has shown that large variability exists between CDT and EtG in detecting chronic alcohol consumption, suggesting that CDT should not be replaced tout court with EtG. Until solid data, relating to inter-individual variability and potential confounding factors, become available for EtG, we suggest to use CDT, or a combination of different biomarkers, to identify alcohol abuse in a forensic context. Moreover, our data recommend to cautiously consider EtG results close to the cutoff (30–50 pg/mg) before any sanction is assigned.
CONFLICT OF INTEREST STATEMENT
None declared.
