


Abstract
Chronic kidney disease is a risk factor for cognitive impairment. Albuminuria is an early manifestation of chronic kidney disease and a marker of endothelial dysfunction and vascular risk. Results of prior studies of albuminuria and cognitive function are contradictory. The authors studied 1,345 community-dwelling women and men in southern California (mean age, 75 years) at a 1992–1996 research clinic visit, when urine albumin/creatinine ratio (ACR) was measured in spot morning urine and cognitive function was evaluated by using the Mini-Mental State Examination Trail-Making Test B, and category fluency test. An ACR of ≥30 mg/g was found in 17% of women and 15% of men in 1992–1996. Analysis of covariance was used to compare cognitive function score by categorical ACR. Between 1999 and 2002, 759 participants returned for repeat cognitive function testing. For men, but not women, baseline albuminuria, but not estimated glomerular filtration rate, was associated with reduced cognitive function at follow-up on all tests (P's < 0.05). An ACR of ≥30 mg/g was associated with greater annual decline in Mini-Mental State Examination and category fluency scores. Albuminuria may be an easily measured marker predicting future cognitive function decline. Results imply a common underlying mechanism affecting the renal and cerebral microvasculature.
The association between chronic kidney disease and cardiovascular disease is well established (1). Both share common risk factors (diabetes and hypertension) (2, 3) and pathophysiology (inflammation and endothelial dysfunction) (4, 5). End-stage renal disease patients experience increased cerebrovascular accidents, subclinical ischemic cerebrovascular disease, and cognitive decline (6–10).
The prevalence of diabetes and chronic kidney disease is increasing (11). Albuminuria is an early manifestation of chronic kidney disease (12, 13), usually in diabetes; it is a marker of endothelial dysfunction and vascular risk (14) and is a risk factor for cardiovascular disease (15), but its association with cognitive function remains uncertain. Although several studies of the association between cognitive function and estimated glomerular filtration rate (eGFR) exist (16–21), few have examined albuminuria as an exposure (22–26); only one was prospective (24).
A study investigating the association of this modifiable stage of chronic kidney disease with cognitive decline is timely and important. The purpose of the present study was to examine the longitudinal association of urine albumin/creatinine ratio (ACR) with cognitive function change in a population-based sample of older, community-dwelling adults.
MATERIALS AND METHODS
Participants
Participants were community-dwelling women and men aged 51–98 years from the Rancho Bernardo Study. In 1972–1974, 82% of all adults aged 30 years or older living in this southern California community enrolled in a study of heart disease risk factors. Participants were Caucasian, well educated, and middle class. In 1992–1996, 1,781 participated in a research clinic visit, when albuminuria was measured; 1,429 (80%) completed 3 cognitive function tests. After exclusion of 11 individuals without urine samples, 12 younger than 50 years of age, and 61 who had a history of stroke, there remained 821 women and 524 men who had albuminuria and tests of cognitive function in 1992–1996. Of these, 461 women and 298 men had repeat cognitive function testing at a follow-up visit in 1999–2002, a mean of 6.6 (range, 4.5–9.5) years later (Figure 1). Of the 3,004 participants invited to the 1999–2002 visit, 25% (758/3,004) did not respond and 37% (1,105/3,004) refused the invitation (8% (252/3,004) were deceased; 9% (265/3,304) had moved away; and 20% (588/3,004) were unable to return for other reasons, such as poor health or caregiving responsibilities), leaving 38% (1,141/3,004) who were seen in the follow-up clinic.
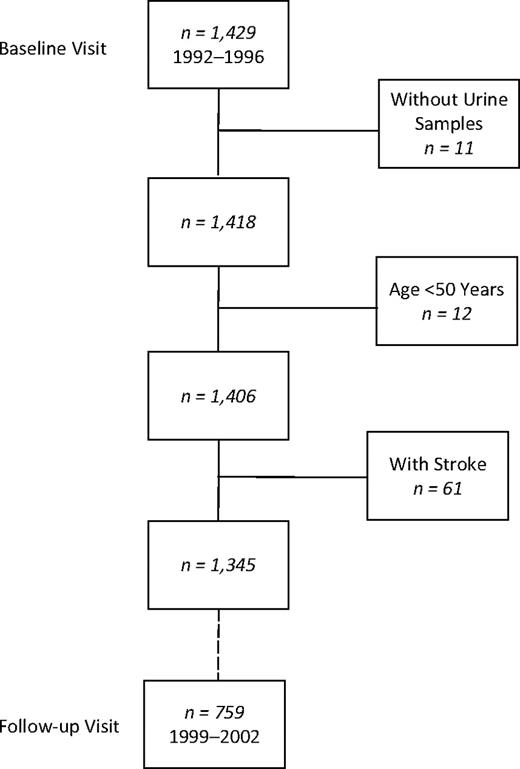
Selection of participants for a study of albuminuria and cognitive function in older adults, Rancho Bernardo, California. In 1992–1996, 1,429 participants attended a research clinic visit and completed 3 cognitive function tests. After exclusion of 11 individuals without urine samples, 12 who were younger than age 50 years, and 61 with a history of stroke, 821 women and 524 men remained who had urine samples for albuminuria testing and tests of cognitive function in 1992–1996. Of these participants, 461 women and 298 men returned for a follow-up visit and had repeat cognitive function testing in 1999–2002.
This study was approved by the Human Subjects Protection Program of the University of California, San Diego. All participants were ambulatory and gave written informed consent.
Procedures
At the 1992–1996 clinic visit, standard self-administered questionnaires were used to define age, education, health habits (smoking, alcohol consumption, and exercise), medical history, and current medications. Height and weight were measured by using a regularly calibrated stadiometer and balance-beam scale with participants wearing light clothing and no shoes. Body mass index was calculated as weight in kilograms divided by height in meters squared. Systolic and diastolic blood pressures were measured twice in seated participants after a 5-minute rest by a trained nurse using the Hypertension Detection and Follow-up Program protocol (27). Ankle brachial index was measured by a trained nurse taking the highest systolic blood pressure in each leg (posterior tibial artery) and dividing by the highest systolic blood pressure in each arm (brachial artery). If the lowest of these 2 ankle brachial indices was ≤0.90, participants were classified as having peripheral arterial disease.
A blood sample was obtained by venipuncture after a requested overnight fast (12–16 hours). A single, clean-catch, untimed morning urine sample (usually the second void) was collected. Fasting plasma glucose was measured by the glucose oxidase method and hemoglobin A1C (HbA1C) by high performance liquid chromatography; fasting plasma cholesterol, triglyceride, and high density lipoprotein and low density lipoprotein cholesterol levels were measured in a Centers for Disease Control and Prevention certified lipid research clinic laboratory. Total cholesterol and triglyceride levels were measured by enzymatic techniques using an ABA-200 biochromatic analyzer (Abbott Laboratories, Abbott Park, Illinois). High density lipoprotein cholesterol was measured according to the standardized procedures of the lipid research clinics manual (28); low density lipoprotein cholesterol was calculated by using the Friedewald formula (29). Serum creatinine was measured by SmithKline Beecham Clinical Laboratories (King of Prussia, Pennsylvania). Urine samples were shipped to the National Institutes of Health laboratory in Phoenix, Arizona. Urine albumin was measured by using the Behring Nephelometer BNA (Dade Behring GmbH, Marburg, Germany). The lower limit of detection of the assay was 6.8 mg/dL; values <6.8 mg/dL were assigned a value of 6.7 mg/dL. The interassay coefficient of variance was 4.5%. Urine creatinine was measured by the kinetic alkaline picrate method using the Ciba-Corning Express (Corning, Medfield, Massachusetts). Diabetes was defined according to the 1999 World Health Organization criteria (30)—fasting plasma glucose ≥126 mg/dL (7 mmol/L), a physician diagnosis of diabetes, or use of diabetes-specific medication (oral or insulin).
Statistical analysis
At both the 1992–1996 and 1999–2002 clinic visits, 3 standardized tests, chosen to assess diverse domains of cognitive function with demonstrated reliability and validity (31), were administered by a trained interviewer: the Mini-Mental State Examination (MMSE), Trail-Making Test B (Trails B), and a category fluency test. The MMSE is a global test of orientation, registration, attention, calculation, language, and recall (32, 33). It is used to screen for incipient dementia, has limited sensitivity for change in cognitive function (34), and is influenced by education, with lower sensitivity for detecting cognitive dysfunction in those with a college education or higher (33). It is scored on a scale of 0 to 30, with dementia suspected for scores <24. Trails B (from the Halstead-Reitan Neuropsychological Test Battery) is a test of visuomotor tracking and attention (35) in which participants identify alternating patterns of letters and numbers in sequence over 300 seconds. It is scored by the time required to complete the test. Lastly, the Animals Naming Category Fluency test is a test of cognitive flexibility and executive function in which participants are asked to name as many animals as possible in 1 minute (36). The score is the number of correctly named animals; repetitions, variations, and intrusions (words other than names of animals, e.g., apple) are not counted. For the MMSE and category fluency test, higher scores indicate better performance; for Trails B, a lower score indicates better performance. Recommended cutoff values indicative of poor performance obtained from the Alzheimer's Disease Research Center of the University of California, San Diego, were as follows: MMSE <24, Trails B ≥132, and category fluency <12.
Depressed mood was assessed by using the Beck Depression Inventory, a self-administered questionnaire asking participants to choose statements that best describe their feelings. Higher score indicates greater depressed mood, and a score ≥12 suggests clinical depression (37).
ACR was calculated as follows: ACR (mg/g) = Urine albumin (mg/dL)/Urine creatinine (g/dL). It was categorized as ≥30 mg/g (albuminuria) or <30 mg/g (normal) (38).
eGFR was calculated by using the abbreviated Modification of Diet in Renal Disease study equation (39, 40): eGFR (mL/minute/1.73 m2) = 186 × (serum creatinine (mg/dL))−1.154 × (age)−0.203 × (0.742 if female) × (1.210 if black). It was categorized as ≥60 mL/minute/1.73 m2 (normal to mildly decreased) or <60 mL/minute/1.73 m2 (moderately to severely decreased).
Annual change in cognitive function was calculated as follows: Annual change in score = (Score at follow-up – Score at baseline)/Years between visits.
Analyses were stratified by sex because of known differences in kidney and cognitive function between women and men. All measures were normally distributed except ACR, which required log transformation. A univariate general linear model (analysis of covariance) was used to compare mean values for continuous variables by sex or by ACR or eGFR category; the chi-square statistic was used to compare differences in prevalence for categorical variables. Medians for ACR were calculated.
Three analytic strategies were used to assess the cross-sectional and longitudinal association between kidney function and cognitive function: 1) multiple linear regression to assess the association between logACR at baseline and scores on the MMSE, Trails B, and category fluency tests and annual change in scores; 2) logistic regression to assess the association between logACR and categorical poor performance on cognitive function tests; and 3) analysis of covariance to compare cognitive function scores by categorical ACR (<30 mg/g vs. ≥30 mg/g). Analyses were repeated by using eGFR as a continuous or categorical (≥60 mL/minute/1.73 m2 vs. <60 mL/minute/1.73 m2) variable.
Covariates significantly associated with both predictor and outcome variables by correlation coefficients were used to create parsimonious multivariate models. Multivariable models were adjusted for age, systolic blood pressure, HbA1C, education (some college or more vs. no college), strenuous exercise 3 or more times per week (yes/no), consumption of alcoholic beverages 3 or more times per week (yes/no), and current estrogen use (yes/no) by women, and additionally for eGFR, Beck Depression Inventory, and use of antihypertensive and lipid-lowering medications. Inclusion of body mass index, low density lipoprotein cholesterol, current smoking (yes/no), and peripheral arterial disease (yes/no) did not materially change the results; these variables were therefore not included in the final model. Longitudinal analyses of cognitive function score on the MMSE, Trails B, or category fluency test at the 1999–2002 visit were adjusted for score on the same test at the 1992–1996 visit.
All P values are 2 sided. SPSS software (SPSS Base 15.0 for Windows; SPSS Inc., Chicago, Illinois) was used for all analyses.
RESULTS
At baseline in 1992–1996, the mean age of women and men was similar—74.9 (standard deviation, 9.1) years and 74.5 (standard deviation, 8.6) years (P = 0.44), respectively. There were significant corresponding sex differences (P < 0.01 for all) in mean eGFR (64.9 mL/minute/1.73 m2 vs. 68.7 mL/minute/1.73 m2), median ACR (13.4 mg/g vs. 9.7 mg/g), and scores on the MMSE (28.1 vs. 27.8), Trails B (135.7 vs. 126.4), and category fluency (17.0 vs. 18.1) tests; women performed better than men on the MMSE but worse on Trails B and category fluency. Systolic blood pressure, HbA1C, body mass index, low density lipoprotein cholesterol, Beck Depression Inventory, education, exercise, and alcohol consumption also differed significantly by sex (Table 1).
Baseline Characteristics of Participants in a Prospective Study of Albuminuria and Cognitive Function, Rancho Bernardo, California, 1992–1996a
| Women (n = 821) | Men (n = 524) | P Value | |
| Mean (standard deviation) | |||
| Age, years | 74.9 (9.1) | 74.5 (8.6) | 0.44 |
| Body mass index, kg/m2 | 24.7 (4.1) | 26.2 (3.6) | <0.001 |
| Systolic blood pressure, mm Hg | 140.3 (22.4) | 137.5 (20.2) | 0.02 |
| HbA1C, % | 4.3 (0.6) | 4.3 (0.7) | 0.04 |
| Low density lipoprotein cholesterol, mg/dL | 128.0 (34.4) | 123.5 (30.4) | <0.01 |
| Serum creatinine, mg/dL | 0.9 (0.2) | 1.2 (0.25) | <0.001 |
| eGFR, mL/minute/1.73 m2 | 64.9 (15.7) | 68.7 (16.7) | <0.001 |
| ACR, mg/gb | 13.4 (8.4–22.1) | 9.7 (6.4–19.4) | <0.01 |
| Beck Depression Inventory score | 5.9 (4.6) | 4.8 (4.0) | <0.001 |
| MMSE score | 28.1 (2.0) | 27.8 (2.3) | <0.01 |
| Trails B score | 135.7 (61.1) | 126.4 (56.4) | <0.01 |
| Category fluency score | 17.0 (4.7) | 18.1 (5.0) | <0.001 |
| % | |||
| Some college or more | 63.9 | 81.5 | <0.001 |
| Exercise ≥3×/week | 69.2 | 77.7 | <0.01 |
| Alcohol consumption ≥3×/week | 39.8 | 55.9 | <0.001 |
| Current smoking | 7.2 | 5.3 | 0.18 |
| Current estrogen use | 40.7 | n/a | n/a |
| Current lipid-lowering medication use | 10.5 | 9.2 | 0.41 |
| Current antihypertensives use | 34.1 | 38.1 | 0.22 |
| Diabetes | 13.6 | 18.1 | 0.03 |
Abbreviations: ACR, urine albumin/creatinine ratio; eGFR, estimated glomerular filtration rate; HbA1C, hemoglobin A1C; MMSE, Mini-Mental State Examination; n/a, not applicable; Trails B, Trail-Making Test B.
Except for ACR, P values were obtained from analysis of variance for normally distributed values and the chi-square statistic for categorical variables.
Values are expressed as median (interquartile range). P values were obtained from the Wilcoxon rank sum test for this skewed variable.
In 1992–1996, 17% of women and 15% of men had albuminuria (ACR ≥30 mg/g); 42% of women and 27% of men had moderately to severely impaired kidney function by eGFR (<60 mL/minute/1.73 m2). A majority (56%; n = 754) had preserved kidney function by both measures, and only 8% (n = 108) had impaired kidney function by both measures. However, 28% (n = 375) had an eGFR of <60 mL/minute/1.73 m2 but an ACR of <30mg/g, and 8% (n = 105) had an eGFR of ≥60 mL/minute/1.73 m2 but an ACR of ≥30 mg/g (Figure 2), suggesting these measures assess different spectrums of kidney disease.
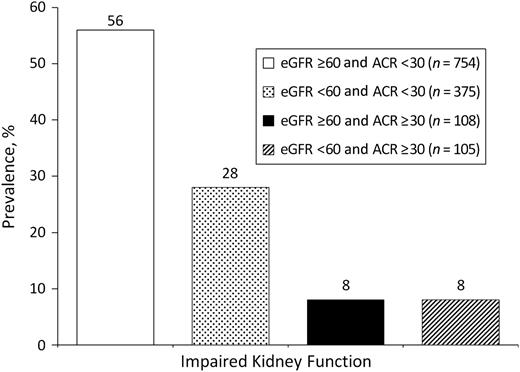
Prevalence (%) of impaired kidney function by estimated glomerular filtration rate (eGFR) and urine albumin/creatinine ratio (ACR) at the baseline research clinic visit in 1992–1996, Rancho Bernardo, California.
The predictors, outcomes, and most covariates all differed significantly by sex. Testing revealed a significant ACR-by-sex interaction (P = 0.01). Therefore, all analyses were sex specific. As shown in Table 2, men and women with an ACR of ≥30 mg/g versus <30 mg/g were older, had a higher systolic blood pressure and HbA1C, were less likely to drink alcohol regularly, and were more likely to use antihypertensives. Women with an ACR of ≥30 mg/g versus <30 mg/g were also less likely to report regular exercise, were more likely to have diabetes or depressed mood, and had worse scores on the MMSE, Trails B, and category fluency tests. At follow-up, more men and women had poor cognitive function according to the MMSE and category fluency tests than at baseline, but fewer scored poorly on Trails B (Figure 3). Mean differences in cognitive function test scores from the 1992–1996 to the follow-up visit for women and men, respectively, were as follows: MMSE −1.0 (standard deviation, 2.1) and −0.9 (standard deviation, 1.9); Trails B −15.7 (standard deviation, 55.1) and −8.4 (standard deviation, 46.0) (unexpectedly improved); and category fluency −1.8 (standard deviation, 4.3) and −1.6 (standard deviation, 4.5). Cross-sectional analyses using multiple linear regression, logistic regression, or analysis of covariance adjusted for age and other known covariates indicated that albuminuria was not associated with any of the 3 measures of cognitive function at baseline in either sex.
Comparison of Baseline Characteristics of Study Subjects by Urine ACR Category, Rancho Bernardo, California, 1992–1996a
| Women (n = 821) | Men (n = 524) | |||||
| ACR <30 (n = 686) | ACR ≥30 (n = 135) | P Value | ACR <30 (n = 446) | ACR ≥30 (n = 78) | P Value | |
| Mean | ||||||
| Age, years | 74.1 | 78.7 | <0.001 | 74.1 | 77.2 | <0.01 |
| Body mass index, kg/m2 | 24.9 | 24.2 | 0.06 | 26.2 | 26.4 | 0.67 |
| Systolic blood pressure, mm Hg | 138.6 | 147.8 | <0.001 | 135.7 | 147.9 | <0.001 |
| HbA1C, % | 4.2 | 4.4 | <0.01 | 4.3 | 4.6 | <0.01 |
| Low density lipoprotein cholesterol, mg/dL | 128.5 | 126.0 | 0.44 | 123.6 | 123.4 | 0.96 |
| Serum creatinine, mg/dL | 0.9 | 1.0 | <0.01 | 1.1 | 1.3 | <0.001 |
| eGFR, mL/minute/1.73 m2 | 65.5 | 62.3 | 0.03 | 70.1 | 60.9 | <0.001 |
| ACR, mg/gb | 11.4 | 44.7 | <0.001 | 8.4 | 60.6 | <0.001 |
| Beck Depression Inventory score | 5.73 | 6.63 | <0.05 | 4.68 | 5.60 | 0.06 |
| MMSE score | 28.2 | 27.9 | <0.05 | 27.9 | 27.6 | 0.33 |
| Trails B score | 131.4 | 155.5 | <0.001 | 124.7 | 136.0 | 0.10 |
| Category fluency | 17.3 | 15.7 | <0.001 | 18.2 | 17.4 | 0.21 |
| % | ||||||
| Some college or more | 63.6 | 65.8 | 0.75 | 82.4 | 75.8 | 0.22 |
| Exercise ≥3×/week | 71.1 | 59.3 | <0.01 | 78.0 | 75.6 | 0.66 |
| Alcohol consumption ≥3×/week | 41.7 | 28.9 | <0.01 | 58.3 | 47.3 | 0.01 |
| Current smoking | 7.3 | 7.4 | 1.00 | 5.4 | 5.1 | 1.00 |
| Current estrogen use | 41.3 | 37.0 | 0.39 | n/a | n/a | n/a |
| Current lipid-lowering medication use | 10.9 | 8.1 | 0.44 | 10.1 | 3.8 | 0.09 |
| Current antihypertensives use | 36.7 | 57.0 | <0.001 | 39.7 | 67.9 | <0.001 |
| Diabetes | 12.1 | 21.5 | <0.01 | 17.3 | 23.1 | 0.26 |
Abbreviations: ACR, albumin/creatinine ratio; eGFR, estimated glomerular filtration rate; HbA1C, hemoglobin A1C; MMSE, Mini-Mental State Examination; Trails B, Trail-Making Test B.
Except for ACR, P values were obtained from analysis of variance for normally distributed values and the chi-square statistic for categorical variables.
Values are expressed as median. P values were obtained from the Wilcoxon rank sum test for this skewed variable.
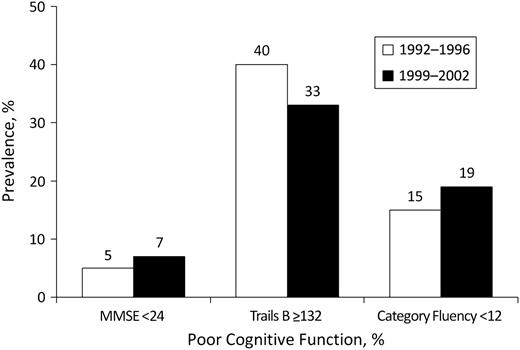
Prevalence (%) of poor cognitive function—Mini-Mental State Examination (MMSE) score <24, Trail-Making Test B (Trails B) score ≥132, and category fluency test score <12—in 1992–1996 and 1999–2002, Rancho Bernardo, California.
In contrast, prospective analyses using analysis of covariance showed that albuminuria (ACR ≥30 mg/g vs. <30 mg/g) in 1992–1996 was associated with worse cognitive function on all tests (MMSE, Trails B, and category fluency) in 1999–2002 (Table 3) and with greater annual decline in MMSE and category fluency in men but not women, even after adjusting for all covariates (P’s ≤ 0.05 for all) (Table 4). However, there was an unexpected trend toward improvement in Trails B score (a decrease) among men with an ACR of ≥30 mg/g versus <30 mg/g (P = 0.06) (Table 4). Prospective multivariable analyses using multiple linear regression or logistic regression showed similar trends but no significant association.
Adjusted Longitudinal Comparisons of Mean Cognitive Function Scores at Study Follow-up in 1999–2002 by Baseline Urine ACR Category in 1992–1996,a Rancho Bernardo, California
| Women (n = 461) | Men (n = 298) | |||||
| ACR <30 (n = 406) | ACR ≥30 (n = 55) | P Value | ACR <30 (n = 263) | ACR ≥30 (n = 35) | P Value | |
| MMSE | ||||||
| Unadjusted | 27.6 | 27.8 | 0.54 | 27.7 | 26.4 | <0.01 |
| Age adjusted | 27.6 | 28.0 | 0.18 | 27.6 | 26.8 | <0.05 |
| All adjustedb | 27.7 | 28.0 | 0.36 | 27.7 | 26.6 | 0.02 |
| Trails B | ||||||
| Unadjusted | 129.5 | 150.6 | 0.03 | 114.8 | 152.5 | <0.01 |
| Age adjusted | 130.8 | 141.7 | 0.21 | 117.1 | 133.5 | 0.12 |
| All adjustedb | 129.1 | 133.4 | 0.62 | 112.5 | 132.9 | <0.05 |
| Category fluency | ||||||
| Unadjusted | 16.1 | 16.5 | 0.62 | 17.8 | 16.0 | <0.05 |
| Age adjusted | 16.1 | 16.8 | 0.24 | 17.7 | 16.8 | 0.31 |
| All adjustedb | 16.2 | 16.6 | 0.57 | 18.0 | 15.6 | 0.01 |
Abbreviations: ACR, albumin/creatinine ratio; MMSE, Mini-Mental State Examination; Trails B, Trail-Making Test B.
Results of analysis of covariance.
Adjusted for baseline age, systolic blood pressure, hemoglobin A1C, education (some college), strenuous exercise 3 or more times per week, alcoholic beverage consumption 3 or more times per week, baseline score on cognitive function test, current estrogen use (women only), estimated glomerular filtration rate, Beck Depression Inventory score, antihypertensive medication use, and lipid-lowering medication use.
Adjusted Longitudinal Comparisons of Mean Annual Change in Cognitive Function Scores Between Baseline in 1992–1996 and Follow-up in 1999–2002 by Baseline Urine ACR Category in 1992–1996,a Rancho Bernardo, California
| Women (n = 461) | Men (n = 298) | |||||
| ACR <30 (n = 406) | ACR ≥30 (n = 55) | P Value | ACR <30 (n = 263) | ACR ≥30 (n = 35) | P Value | |
| MMSE | ||||||
| Unadjusted | −0.16 | −0.12 | 0.42 | −0.12 | −0.27 | 0.01 |
| Age adjusted | −0.16 | −0.10 | 0.15 | −0.13 | −0.23 | 0.09 |
| All adjustedb | −0.15 | −0.10 | 0.38 | −0.11 | −0.28 | 0.01 |
| Trails B | ||||||
| Unadjusted | −2.20 | −4.21 | 0.11 | −0.99 | −3.98 | <0.05 |
| Age adjusted | −2.38 | −3.62 | 0.28 | −1.11 | −2.91 | 0.19 |
| All adjustedb | −2.45 | −3.16 | 0.59 | −0.87 | −3.99 | 0.06 |
| Category fluency | ||||||
| Unadjusted | −0.28 | −0.28 | 0.96 | −0.23 | −0.47 | 0.07 |
| Age adjusted | −0.28 | −0.27 | 0.94 | −0.24 | −0.40 | 0.24 |
| All adjustedb | −0.29 | −0.27 | 0.82 | −0.22 | −0.55 | 0.04 |
Abbreviations: ACR, albumin/creatinine ratio; MMSE, Mini-Mental State Examination; Trails B, Trail-Making Test B.
Results of analysis of covariance.
Adjusted for baseline age, systolic blood pressure, hemoglobin A1C, education (some college), strenuous exercise 3 or more times per week, alcoholic beverage consumption 3 or more times per week, baseline score on cognitive function test, current estrogen use (women only), estimated glomerular filtration rate, Beck Depression Inventory score, antihypertensive medication use, and lipid-lowering medication use.
To determine whether these findings were the result of the established association between diabetes and cognitive function, analyses were repeated by excluding 208 participants with diabetes (30); doing so did not materially change the results. To ensure that results were not driven by macroalbuminuria, analyses were repeated by excluding 21 participants who had an ACR of ≥300 mg/g, which also did not materially change the results. To further understand sex differences, prospective analyses were repeated by using sex-specific cutoffs for albuminuria (women: normal <25 mg/g (n = 649; 79%), albuminuria ≥25 mg/g (n = 173; 21%); men: normal <17 mg/g (n = 374; 71%), albuminuria ≥17 mg/g (n = 150; 29%) (41) but did not materially change the results for either men or women. To determine whether sex differences in cognitive function might vary by baseline estrogen use, analyses were repeated by stratifying women by baseline estrogen status; no association remained between albuminuria and cognitive decline in women who were or were not current estrogen users at baseline. Analyses were repeated after additionally adjusting for body mass index, low density lipoprotein cholesterol, and current smoking or by peripheral arterial disease, without a material change in results. We also attempted to stratify by median age (<75 or ≥75 years) and by peripheral arterial disease to determine whether results were modified by age or peripheral arterial disease; however, sample sizes were too small for results to be interpretable.
Similar prospective analyses were performed by using eGFR as the exposure variable instead of ACR. There were no significant differences by baseline eGFR category in mean score on any cognitive function test at follow-up, or in mean annual change in any score, for either sex.
To determine whether the absent cross-sectional ACR association and the strong, positive, prospective association were explained by survival or nonresponse bias, we compared differences in baseline characteristics between those who attended only the baseline visit and those who attended both visits. Compared with those who attended only the baseline visit, at baseline, those who attended both visits were healthier as evidenced by statistically significant differences (P < 0.05) in nearly every baseline measure shown in Table 1: they were younger; had a lower systolic blood pressure, HbA1C, and ACR and a higher eGFR; were more likely to report regular exercise; and performed better on all baseline measures of cognitive function than those who attended the baseline visit only, documenting selective loss of older, less healthy, and more cognitively impaired participants. This truncation would be expected to reduce any true increased risk. Nonresponse did not differ significantly by sex, making it unlikely to explain the sex differences.
DISCUSSION
In this study of older, community-dwelling adults, categorically defined albuminuria was not associated with cognitive function at baseline. However, for men only, it was associated with worse cognitive function 6.6 years later.
Significant differences were observed when ACR was used as a categorical but not a continuous predictor, suggesting that the ≥30 mg/g cutpoint based on American Diabetes Association (30) and National Kidney Foundation/Kidney Disease Outcomes Quality Initiative (41) guidelines may carry prognostic value. This level of albuminuria has been associated with other microvascular complications of diabetes including diabetic retinopathy (42) and suggests that cognitive decline may result from microvascular disease in the brain.
In this study, a significant association between albuminuria and cognitive function was found in longitudinal but not cross-sectional analyses. This finding is consistent with 2 prior studies in this cohort, which reported a longitudinal, but not cross-sectional, association between glucose tolerance status or HbA1C and cognitive function over a 4-year follow-up (3, 43). One possible explanation for this disparity is that, since albuminuria is an early predictor of kidney disease (usually preceding a decline in eGFR) and an early marker of endothelial dysfunction, it may signal the early stage of a process resulting in vascular disease and cognitive decline over the 6.6-year follow-up period.
To our knowledge, the observed sex differences in the association between albuminuria and cognitive function have not been reported previously, and the reasons for them are unknown. They were not explained by sex differences in age, baseline test performance, or exogenous hormone use and are unlikely to be due to endogenous sex hormones, because higher endogenous estrogen levels have been associated with greater decline in category fluency in this cohort (44). Known sex differences in cognitive function include better performance by women on tests of visuospatial, visuoconceptional, and mental control function and better performance on verbal tasks (45); women also have a lower modified MMSE score than men do in populations with disparities in educational resources (46). Rancho Bernardo women were less likely than men to have attended college (63.9% vs. 81.5%, P < 0.001) and had lower baseline scores on Trails B and category fluency; consequently, they may have been functioning at a lower level than men, thereby blunting the ability to observe potential differences by albuminuria.
Of note, a lower proportion of both men and women in our study had poorer Trails B test scores at the 1999–2002 visit than the 1992–1996 visit, and average score on this test improved among those who completed the test at both visits. This finding likely reflects a practice effect, with improvement on repeat testing, as reported previously in this (47) and other (48, 49) cohorts. Alternatively, the selective loss of those with the poorest cognitive function excluded those with the poorest Trails B test performance at baseline.
To our knowledge, 5 prior papers have investigated the association between albuminuria and cognitive function (22–26); only 1 was prospective (24), and none reported sex-specific data. Two papers from the National Health and Nutrition Examination Survey cohort reported the cross-sectional association between microalbuminuria and a single measure of cognitive function in more than 2,000 participants (22, 23). In multiply adjusted analyses, participants with microalbuminuria had significantly lower Weschler digit symbol substitution scores compared with those without microalbuminuria; after additional adjustment for cardiovascular disease and risk factors, this association was no longer significant except in the subset with peripheral arterial disease (22, 23). Another cross-sectional study assessed dementia and albuminuria in 2,316 Cardiovascular Health Cognition Study participants (25). Albuminuria was associated with increased odds of dementia (1.6, 95% confidence interval: 1.2, 2.3) independent of heart disease, risk factors, and eGFR. A cross-sectional study by Weiner et al. (26) evaluated 335 participants from the Nutrition, Aging, and Memory in Elders Study; those with albuminuria had poorer performance on several cognitive tests but no difference in MMSE scores or memory. Albuminuria was also associated with increased white matter hyperintensity volume on magnetic resonance imaging (26).
To our knowledge, the only published prospective study of the association between albuminuria and cognitive function was by Abbatecola et al. (24), who studied 140 elderly (mean age, 86 years) nondemented participants with impaired glucose tolerance. Baseline 24-hour urine albumin excretion rate was measured 3 times, and cognitive function was assessed by the MMSE, Verbal Fluency, Digit Span forward and backward, and Trail-Making Tests A and B at baseline and 12 months. Baseline albuminuria predicted increased risk of poor cognition after adjustment for baseline MMSE score, age, education, body mass index, smoking, depression, drug intake, postprandial glucose, and systolic blood pressure (relative risk = 1.8, 95% confidence interval: 1.1, 2.1). Our prospective study differs in its larger size, use of spot ACR, 6.6-year follow-up, and sex-specific analyses. Abbatecola et al.’s use of three 24-hour urine samples would be expected to better classify albuminuria, but their small, shorter (1 year) study was probably not powered to reveal sex differences.
ACR may be a marker of systemic vascular endothelial dysfunction common to the kidney and brain, resulting from advanced glycated end products or inflammation. This possibility is supported by studies showing an association of albuminuria with carotid intimal medial thickness (50) and pulse wave velocity (51) and the association of markers of inflammation and hemostasis (52) with both albuminuria (53) and cognitive decline (54). Furthermore, the study by Abbatecola et al. (24) showed that, while the longitudinal association between baseline albuminuria and poor cognition 1 year later persisted in multivariable analyses adjusted for intimal medial thickness, it did not persist after pulse wave velocity was added (relative risk = 1.1, 95% confidence interval: 1.0, 1.2), and the authors concluded that the association might be mediated by the effects of vascular stiffness and endothelial dysfunction on cerebral blood flow.
Several limitations and strengths of this study should be noted. ACR was measured with a single, untimed spot urine sample, but this method has been shown to correlate well with 24-hour urine albumin excretion rates (55), and any misclassification would be expected to bias results toward the null, reducing the observed association. Only 3 cognitive function tests were performed at both visits; thus, cognitive assessment may be limited. Another limitation was our inability to stratify analyses by age group or peripheral arterial disease because of the lack of power resulting from small sample sizes in some groups. Because the Rancho Bernardo cohort is mostly white, well educated, and affluent, findings may not be generalizable to other ethnic groups or to those of different socioeconomic or educational backgrounds. Selection bias and loss to follow-up, as in any study of the elderly, are additional limitations. The strengths of this study are its large size, prospective design, long follow-up, assessment of several domains of cognitive function, and use of sex-specific analyses in a cohort very well characterized for directly measured covariates.
In conclusion, men with albuminuria had worse cognitive function and greater cognitive decline as assessed by 2 of 3 cognitive tests over a 6.6-year interval. This association was not explained by eGFR or diabetes. Progression of albuminuria may be slowed and cardiovascular outcomes delayed with interventions that control blood pressure, especially with blockade of the renin-angiotensin system (56). Clinical trials are necessary to determine whether interventions targeting albuminuria can prevent cognitive decline among older men with this early marker of kidney disease.
Abbreviations
- ACR
albumin/creatinine ratio
- eGFR
estimated glomerular filtration rate
- HbA1C
hemoglobin A1C
- MMSE
Mini-Mental State Examination
- Trails B
Trail-Making Test B
Author affiliations: Division of General Internal Medicine and Geriatrics, Department of Medicine, University of California, San Diego, California (Simerjot K. Jassal); VA San Diego Healthcare System, San Diego, California (Simerjot K. Jassal); and Division of Epidemiology, Department of Family and Preventive Medicine, University of California, San Diego, La Jolla, California (Donna Kritz-Silverstein, Elizabeth Barrett-Connor).
This work was supported by the National Institute of Diabetes and Digestive and Kidney Diseases (grant DK31801), the National Institute on Aging (grant AG07181), and the National Institutes of Health and the National Institute on Aging (grant R01AG028507).
This work was presented at the American Heart Association's 49th Cardiovascular Disease Epidemiology and Prevention Annual Conference 2009 in association with the Council on Nutrition, Physical Activity and Metabolism, Palm Harbor, Florida, March 10–14, 2009.
Conflict of interest: none declared.
References
Author notes
Editor's note:An invited commentary on this article appears on page 287, and the authors’ response is published on page .

