

Abstract
Strategic energy planning to achieve universal electricity access and meet the future energy needs of African nations is essential to formulate effective policy measures for climate change mitigation and adaptation. Africa cannot afford a cost-prohibiting green energy transition to achieve United Nations Sustainable Development Goal 7. In this study, I employ open-access energy models, enhanced with geospatial data, to identify least-cost power generation investment options for forty-eight African nations. Different levels of electricity consumption per capita and costs of renewables are considered across four scenarios. According to the analysis, to achieve universal electricity access by 2030 in Africa, the power generation capacity needs to increase between 211 GW–302 GW, depending on electricity consumption levels and the cost of renewables considered, leading electricity generation to rise between 6221 PJ–7527 PJ by 2030. Higher electricity generation levels lead to higher penetration of fossil fuel technologies in the power mix of Africa. Natural gas will be the dominant fossil fuel source by 2030, while the decreasing costs of renewables will lead solar to overtake hydropower. To meet the same electricity demand levels, decreasing the cost of renewables can enable a less carbon-intensive power system, although higher capacity is also needed. However, Africa is still hard to achieve its green revolution. Depending on electricity consumption levels and costs of renewables considered, grid-connected technologies are estimated to supply 85%–90% of total electricity generated in Africa in 2030, mini-grid technologies 1%–6%, and stand-alone technologies 8%–11%. Off-grid solar and hybrid mini-grid solar technologies are essential in electrifying residential areas. Higher penetration of renewable energy sources in the energy mix creates local jobs and increases cost-efficiency. The analysis demonstrates that 6.9 million to 9.6 million direct jobs, depending on the policies and renewable development levels, can be created in Africa by expanding the power sector from 2020 to 2030 across the supply chain. While increasing electricity consumption levels in Africa leads to higher total system costs, it is also estimated to create more jobs, fostering political and societal stability. Finally, the decreasing costs of renewables could further increase the penetration of renewables in the energy mix, leading to an even higher number of jobs.
Export citation and abstract BibTeX RIS

Original content from this work may be used under the terms of the Creative Commons Attribution 4.0 licence. Any further distribution of this work must maintain attribution to the author(s) and the title of the work, journal citation and DOI.
1. Introduction
Energy access is important for economic growth and social prosperity [1]. At the 2015 UN General Assembly, the 2030 Agenda for Sustainable Development (SDGs) with 17 goals, 169 targets and 232 associated indicators was approved and aims to address the economic, social and environmental pillars of development by 2030. Specifically, sustainable development goal 7 (SDG7) focuses on 'ensuring access to affordable, reliable, sustainable and modern energy for all' and its sub-targets are as follows: 7.1 aims to achieve universal access to affordable, reliable, sustainable, and modern energy services, 7.2 aims to substantially increase the share of renewable energy in the global energy mix, and 7.3 aims to increase the global rate of improvement in energy efficiency [2]. The International Council for Science identifies goal 7 as the second most interconnected goal, with links to goals SDG1 (No Poverty), SDG2 (Hunger), SDG3 (Good Health and Well-being), SDG6 (Clean Water and Sanitation), SDG8 (Decent Work and Economic Growth) and SDG13 (Climate Action) [3]. While the established goals are universal, each country has developed its national SDG targets based on its policy plans, National Determined Contributions (NDCs) and Agenda 2063 strategic framework [4, 5]. These policies, while country-specific, have global implications, which are likely to affect Europe's energy goals for promoting sustainable energy, energy systems security, and climate neutrality by 2050 [6].
Africa has abundant energy resources. Nevertheless, it is the least electrified region in the world. Specifically, electricity access steadily increased from 44% in 2010 to 56% in 2019, with North Africa almost fully electrified (99%) and sub-Saharan Africa's (SSA) electrification rate increasing from 33% to 48% in the corresponding years. Thus, approximately 579 million people do not have access to electricity in the region, where 81% and 37% live in urban and rural areas. In the past decade, the rate of achieving electricity access in SSA has exceeded population growth (except from 2016 to 2018). Congo, Gabon, Ghana, Kenya and Rwanda have contributed the most to this trend, presenting the highest increase in their electricity access over the last ten years [7]. However, as population growth in sub-Saharan Africa increased by 2.7% during the same period, combined with the impact of the COVID-19 pandemic, achieving universal access in the region by 2030 (only eight years left) has proven to be challenging [8, 9]. Specifically, Nigeria, the Democratic Republic of Congo and Ethiopia have the largest deficit in electricity access in Africa [8]. Also, as the population in Africa is expected to nearly double in the next thirty years, reaching 2 billion people in 2050 (shared socioeconomic pathways 2 (SSP)), tackling the energy access challenges is essential for sustainable development [10, 11].
Each African country has a different supply mix of domestic energy reserves and renewable energy potential, economic and population growth, national policy plans and energy security targets, resulting in policy-makers and energy planners having to manage several conflicting factors for energy system expansion [12]. Strategic use of a nation's domestic energy resources is essential in enabling an effective energy transition. A universal integrated energy systems planning approach that captures the evolution of each African nation's energy system is needed to tackle the increase in energy demand and resulting infrastructure needs, the rising population and the adverse impacts of climate change in Africa. Energy access needs to be aligned with its nation's energy transition to deliver reliable and affordable electricity and reduce emissions. National-level energy transitions are complex and have several implications for a nation's economy and future development.
Energy models have been applied for many years to provide pathways for sustainable development either on a global-, continental-, or country-level [7, 13]. Energy system analysis and electrification planning using medium-to-long term cost-optimization energy modeling tools [13–17] can address the aforementioned challenges. They can provide insights on energy options such as centralized versus decentralized power system technologies and grid expansion, identify least-cost investments to satisfy future energy demands (achieve universal energy access) and also inform SDGs [1, 18]. Analytical approaches and tools are needed to support policy analysis in countries, assess interactions among the SDGs and establish clear metrics and targets tailored to national priorities [19]. Specifically, without energy system modeling tools, it is unclear how progress towards SDG7 can be addressed [18]. Modeling tools can also inform how universal access in each country can be best achieved by addressing uncertainties around the evolution of fossil fuel prices, renewable energy technology (RET) costs and demand projections, and can also assist governments, policy-makers and funders to identify proper financing mechanisms and strategic investments [20]. They can also measure the socio-economics (e.g., job creation) of different energy transition pathways [21, 22]. Lastly, considering the spatial dimension of energy access (location and size of unelectrified population, geophysical parameters and technology costs) can improve the medium-to-long-term assessments of least-cost power system expansion in an energy model [23–25].
Several techno-economic studies have been conducted on a continental-, regional- and national-scale to address the future challenges associated with the evolution of the energy system in Africa. Trotter et al [26] conducted a literature review on quantitative and qualitative electricity planning and implementation research approaches on sub-Saharan Africa on a national-, regional- and continental-scale. Their review indicates that 63% out of 306 relevant peer-reviewed journal articles favor renewable energy technologies to address the identified challenges, and mention success factors electrifying sub-Saharan Africa, such as adequate policy design, sufficient finance, and favorable political conditions. On a continental-scale, using a cost-optimization tool OSeMOSYS [27], Taliotis et al [28] modeled the electricity system of each African country (45 in total). They linked each system via electricity trade links to examine scenarios of power plant investments by exploiting trade potential in the continent during 2010–2040. They show that an enhanced trading scheme could reduce electricity generation costs. However, only the electricity sector on a national scale is modeled. As a result, the model does not look at how the nation's energy demand can be met when demand from specific sectors is considered and does not examine the resulting changes in electricity generation costs. Furthermore, only the electricity trade links are included in the model and not other trades (e.g., gas). The number of power-generating technologies considered in their analysis is less than in this study, decreasing the model's granularity. Bazilian et al [29] examined various energy access scenarios in sub-Saharan Africa by 2030 using the OSeMOSYS framework to model the electricity sector. Although in this study, a detailed analysis of the electricity demand projections is included, which is missing from Taliotis et al study [28], other fuel demands are not included in the study to better capture the evolution of the energy system in Africa, and geospatial data of power generation technologies are left out. In another study, a cost-optimization modeling framework MESSAGE-SPLAT is used to model the power system of only two regions (Eastern and Southern Africa) and examine scenarios associated with their energy transition [30].
Puig et al [31] suggested an action plan for Africa's electricity sector and identified economic opportunities associated with power-sector reform, energy access and investing in sustainable development goal 7. Expansion of investments in off-grid and interconnected clean-energy mini-grids are among the identified options.
Enhancing energy systems analysis with geospatial data, Mentis et al [20] developed a bottom-up geospatial electrification tool (OnSSET) to examine least-cost electrification strategies for each sub-Saharan country, and considered investment options (grid extension, mini-grid, stand-alone systems) for different electricity consumption levels. Nevertheless, the OnSSET model, which also uses the TEMBA model as an input for grid cost, is further improved in this study using the open-access global electrification platform (GEP) [32]. In addition, the authors did not present the grid-connected power generation mix for different universal access scenarios, and the analysis of electricity demand projections primarily focused on connecting the unelectrified population. Similarly, Longa et al [33] applied geographic information system analysis coupled with an integrated assessment model to study electricity access in Africa, and employed scenario projections focused on achieving climate policies (2.0 °C) through 2050. They conclude that universal electricity access in Africa cannot be achieved by 2030, and will likely remain unachieved until 2050. Also, they conclude that off-grid renewable energy technologies are essential to increase electrification of rural areas significantly. However, the study only examines the electricity supply system of 48 African countries and the citizen's willingness to pay for electricity. In this study, the analysis is broader and covers the whole energy supply system of African countries combined with energy demand projections through 2040. In addition to defining the least-cost electrification mix for each country, this study also informs indicators relevant to SDG7 and its sub-targets and provides important insights on job creation potential in Africa. Other studies also focused either on a regional or a national scale analysis. Falchetta et al [34] modeled only the electricity supply system of East Africa by using OnSSET to estimate least-cost pathways to achieve universal access by 2030 under different electricity consumption levels. Nevertheless, this study does not consider the trade implications with the other power pools and leaves out a detailed representation of the grid power generation mix and consequently how grid cost is affected. Rocco et al [35] and Pappis et al [25] examined energy access scenarios for Tanzania and Ethiopia by modeling the power sector using OSeMOSYS and geospatial data to determine electricity demand projections and the optimal allocation of power generation technologies. Similarly, the analysis is conducted on a national-level without considering the trade implications on a continental-scale. Only the power sector is modeled, and the scenarios are limited by examining energy access considering only policy and environmental goals and not the evolution of other fuels.
The Africa Energy Outlook 2019 [36] focused on electricity access in sub-Saharan Africa by examining two scenarios, considering different national policies, during 2018–2040. Although the study covers the whole of Africa, the detailed electricity supply system of only 11 sub-Saharan countries is modeled using both a cost-optimization tool and the geospatial electrification tool OnSSET. In the stated policies scenario, hydropower is expected to be the primary fuel source by 2040, while its share declines as natural gas and other renewables expand. On the contrary, in the Africa policies scenario, hydropower is overtaken by natural gas. Solar PV capacity increases significantly, making up 40% to 70% of all new capacity additions in the power system in each scenario, respectively. Geospatial analysis shows that the least-cost pathway to achieve universal access by 2030 is decentralized systems powering half of electricity connections (nearly 440 million people) and extending the main grid. In the stated policies scenario, Ethiopia, Ghana, Kenya, Rwanda, Senegal and South Africa are expected to reach full access by 2030 [8, 36]. However, the Tracking SDG7: the Energy Progress Report 2021 [8] shows that although Africa continues to progress toward SDG7, a lot of additional effort is required to reach the goal by 2030 (stated policies). The projections show that under current and planned policies and before the COVID-19 crisis, about 555 million people would still lack access to electricity in 2030. Almost 20 countries would have less than half of the population with electricity access, and ten countries would have less than one out of every four people (e.g., Chad, the Democratic Republic of Congo, Malawi, Niger and Somalia) [8]. To bridge the gap, almost 85 million people per year need to gain access between 2020 (the access rate to triple) to 2030. IEA's and IRENA's [37] scenarios estimate that achieving SDG7 by 2030 would require annual renewable energy investments of approximately $680 billion, around $45 billion spent on energy access and $625 billion on energy efficiency [8].
Lastly, few studies have been conducted to track the progress towards achieving SDGs in African countries [38, 39]. Also, another important aspect to examine in the context of energy transitions on a global, regional or national level is the associated job creation potential of achieving universal access, which is missing from the literature [21, 22, 40–42].
Based on the existing literature, this study builds on previous efforts by Pappis et al [43]. In this study, the electricity supply system of 48 African countries is modeled and connected via electricity and natural gas trade links, and included all fuel demands and fuel exports, to investigate scenarios relevant to achieving universal electricity access (table 6). The results are provided on an annual basis from 2015 to 2030. This study also considered the geospatial allocation of power generation technologies missing from the previous analysis on Africa and examines different research questions.
In this study, therefore, I tried to address the research gaps in the current literature by examining the following research questions: first, how can an African country identify energy pathways that are least-cost but also consider the nation's priorities in terms of achieving universal access, the geospatial allocation of power generation investments, financial capacity, technological maturity, environmental and policy constraints, and energy demand growth in different sectors? Second, what would the outputs of these least-cost energy pathways using energy system modeling tools mean for SDG7 and its sub-targets (rate of success) in each country? And third, what would be the socio-economic benefits of job creation of these energy transitions in Africa? In this study, an electrification least-cost investment outlook on a continental-, regional- and national-scale for Africa, using energy systems analysis enhanced with geospatial data, is developed for 2015–2030. Four scenarios were developed (new policies low, new policies high, renewable deployment low, renewable deployment high), focusing on different energy access consumption levels (low, high) and examining the effect of decreasing the costs of renewables in the energy transition in Africa. The four scenarios examined in this study investigated the implications of the future energy transition in Africa on the electricity supply mix, the total system costs, achieving SDG7 and its sub-targets, and the associated environmental and socio-economic implications. The different universal access scenarios were examined to analyze economics and demographic factors that drive electricity demand in forty-four African nations. A critical dimension of achieving SDG7 in Africa, in addition to electricity consumption levels, is the evolution of renewable technology costs as Africa cannot afford a cost-prohibitive green energy transition pathway.
Using the OSeMOSYS tool [27], the analysis estimates the cost-optimal mix of electrification technologies and fuel supply aligned with the corresponding energy system development pathways and captures the spatial distribution (split of grid, mini-grid and stand-alone technologies) of future electricity connections in residential areas using the open-access GEP [44]. This way, grid, off-grid and mini-grid energy systems' role in meeting SDG7 can be examined and provide insights into the energy transition and its associated challenges. An accounting model was developed to create an index with indicators to inform each African country's SDG7 and sub-targets. Lastly, an input–output model was used to measure the socio-economic impacts of the energy transition focusing on job creation in Africa. The open-source nature of this analysis (data, model, code, results) assists in the transparency and reproducibility of the research. The analysis provides results on a continental-, regional- and national-scale in an integrated way for the whole of Africa. The results can be used to inform national policy analysis (Nationally Determined Contributions [4], Clean Development Mechanism [45]), SDG7 and other closely interlinked targets (SDG1, SDG3, SDG11 (reducing impacts of air pollution), SDG13, SDG14) [2], and can be used by academics, researchers and policy analysts in their research and capacity building activities. The outcomes of this study can assist African nations in strengthening risk mitigation associated with future renewable energy projects and ensuring their financial viability (figure 1).

Figure 1. Electricity access levels by country in 2019 [8]. (Note: the detailed list of African countries per power pool included in the analysis is presented in table 6.)
Download figure:
Standard image High-resolution image2. Methods
The methodology used to conduct this research is implemented in four stages. Firstly, the existing energy model for Africa developed using OSeMOSYS [46] has been further updated and calibrated to represent off-grid technologies (mini-grid, stand-alone) and the residential electricity demand for currently unelectrified settlements in Africa. Also, the previous model does not consider the geographical characteristics of resources and the spatial dimension of residential electricity demand to identify the least-cost split between on- and off-grid technologies. Thus, in the second step, the GEP [44] (based on the OnSSET model [20]) is used and calibrated to be aligned with the techno-economic assumptions and electricity demands considered in the OSeMOSYS model for Africa. In the third step, the residential electricity demands of the currently unelectrified settlements and the associated power generation mix satisfying these demands as an output of the GEP analysis are used as inputs in the OSeMOSYS-Africa model. Through this linkage, each tool's limitations are overcome at some level. The final OSeMOSYS model provides an integrated electrification investment outlook. It gives the least-cost optimal mix of on-grid and off-grid technologies and considers the geographical theory and geographic information systems (GIS) in electrification planning together with a least-cost long-run energy planning tool to meet each Africa's country's future electricity demand in all sectors (figure 2). The fourth step identifies the targets directly or indirectly related to energy infrastructure and the linkages between model outputs and the SDG targets. An accounting model is developed, which takes modeling results of the OSeMOSYS model as inputs and outputs indicators that can be used to assess progress toward achieving the SDG7 target. Lastly, the modeling results of the OSeMOSYS model are used as inputs in an input-output model to estimate the job creation potential during the energy transition of the African continent (table 1).

Figure 2. Overview of the modeling approach soft-linking the OSeMOSYS model with the GEP model.
Download figure:
Standard image High-resolution imageTable 1. Summary of the modeling tools used in this study.
| OSeMOSYS | GEP | Other models |
|---|---|---|
| (1) Energy supply system | (1) Electricity supply system | (1) Accounting model |
| (i) Import & extraction technologies | (i) Grid extension | (i) SDG7 index |
| (ii) Centralized & decentralized | (ii) Mini-grid | |
| technologies power generation | ||
| technologies | ||
| (iii) Transmission & distribution | (iii) Off-grid technologies | |
| network | ||
| (iv) Fuel conversion technologies | ||
| (2) Energy demands | (2) Electricity demand | (2) Input-output model |
| (i) Electrified (others) | (i) Residential (current unelectrified settlements) | (i) Job creation potential during the energy transition of the African continent |
| (ii) Residential (currently unelectrified settlements) | ||
| (iii) Other sectors (coal, heavy fuel oil, light fuel oil, natural gas, biofuel & waste, coal, natural gas) |
The modeling tools, input data, model assumptions, and the energy system pathways examined by 2040 under this study are presented in the following sections, appendix
2.1. Description of the modeling tools
2.1.1. Cost-optimization framework for long term energy planning (OSeMOSYS)
The open-source energy modeling system (OSeMOSYS) tool is a freely available optimization modeling framework for medium to long-term energy planning [27]. It is a bottom-up modeling framework that uses linear-optimization techniques to satisfy an exogenously defined energy demand. OSeMOSYS has been employed in the scientific literature [21, 33] and in academic teaching and capacity building for energy planners to provide insights on possible transformation trajectories of both country to continental-scale energy systems [47]. The objective function equation consists of the sum of discounted operational and capital costs. The energy system consists of final energy demands distinguished between various end-use services, transmission and distribution networks, power generation technologies (on-grid and off-grid), energy trade links, conversion technologies, and technologies representing imports and extraction of energy resources. The modeling results can include power generation capacity, production by technology, operation and maintenance costs, and emissions on an annual level with a timely resolution for some of the variables.
2.1.2. Geospatial electrification outlook (GEP)
The OnSSET tool considers population settlements and, for each one, determines which is the least-cost technology to meet the electricity demand (grid, mini-grid, or stand-alone). The levelized cost of electricity (LCOE) is calculated for each technology option, considering the investment, operation and maintenance, and fuel costs in each African country. The technology that can meet the demand at the lowest LCOE is selected as the least-cost technology option in that settlement [20]. The OnSSET tool has been used in national electrification studies (Malawi [48], Kenya [49], Tanzania [50], Afghanistan [51]) and regional electrification studies for the whole of sub-Saharan Africa ([20, 52]). The latest GEP explores least-cost electrification strategies for 58 countries [32]. Integrating the spatial dimension of energy access (location and size of unelectrified population, geophysical parameters and technology costs) can improve the medium-to-long-term assessments of least-cost power system expansion [23–25].
The formula used to calculate the levelized cost of generating electricity for each technology is shown below:

In year t, It is the investment cost, O&Mt are the operation and maintenance costs, Ft are the fuel expenditures, and Et is the generated electricity. Further, r is the discount rate and n corresponds to the technology's lifetime. The average LCOE of all grid-connected power generation technologies is calculated to estimate the input grid cost to OnSSET.
OnSSET is not an energy system-wide optimization model, and it considers only the future connections of the current unelectrified settlements in the residential areas. Thus it does not represent the evolution of the grid-based electricity generation mix, which is a modeling outcome of the OSeMOSYS tool. The analysis of the grid components is missing from GEP [32].
The soft-linking process of the two tools is as follows: stage (1) the OSeMOSYS model cost-optimizes the energy supply system of the African continent (by country), stage (2) the average levelized cost of generating centralized grid electricity is calculated from the output of the OSeMOSYS model using formula (1) considering all grid-connected power generation technologies and electricity imports-exports, stage (3) the average levelized cost of generating grid electricity is fed into the GEP model and used to calculate the least-cost electrification mix (on-grid and off-grid) to meet the residential electricity demand in currently unelectrified settlements, stage (4) the least-cost electricity supply mix between grid and off-grid connected technologies, capacity factors for the off-grid technologies identified based on local energy resource characteristics at off-grid locations and the transmission and distribution costs for grid expansion per kW of new generation capacity are calculated, stage 4 to (1) this information is used as an input into the OSeMOSYS model to cost-optimize the whole electricity supply system and define the average cost of generating electricity. This process will impact the cost-optimization process of the OSeMOSYS model and, eventually, the grid cost. Thus, more than one iteration will calibrate the modeling outputs between the two tools better. The iterations of the two models continue until they reach a point where the average cost of generating electricity in each scenario does not change further. The methodology is applied in previous studies [20, 25, 49].
2.1.3. Index framework informing SDG7
In this study, the targets and the associated sub-targets of sustainable development goal 7 are informed for each African nation based on the modeling outputs of the energy transition for each scenario in 2030. An index framework is created based on the SDG7 targets focus, as presented in table 2. The share of renewables and CO2 emissions are defined only for the power sector. The energy intensity is estimated as the total primary energy supply per GDP. The lifetime of fossil fuel resources (%) is calculated as the production of fossil fuel reserves during 2015–2030 per each country's total amount of identified fossil fuel reserves. The import dependency (%) is calculated as the total net imports (imports minus exports) of coal, crude oil, oil products and natural gas as a share of the total primary energy supply in 2030.
Table 2. SDG7 targets and their description [8].
| Featured SDG target | Target explanation | Indicator | Indicators | ||||
|---|---|---|---|---|---|---|---|
| Renewables (%) | CO2 emissions (Mt) | Energy intensity (energy production/GDP) | Lifetime of fossil fuel resources (%) | Import dependency (%) | |||
| Target 7.1 | By 2030, ensure | 7.1.1 Proportion | |||||
| universal access to | of population | ||||||
| affordable, reliable and | with access to | ||||||
| modern energy | electricity | ||||||
| services | |||||||
| 7.1.2 Proportion | |||||||
| of population | |||||||
| with primary | |||||||
| reliance on clean | |||||||
| fuel and | |||||||
| technology for | |||||||
| cooking | |||||||
| Target 7.2 | By 2030, substantially | 7.2.1 Renewable | X | X | X | X | |
| increase the share of | energy share in | ||||||
| renewable energy in the | total final energy | ||||||
| global energy mix | consumption | ||||||
| Target 7.3 | By 2030, double the | 7.3.1 Energy | X | X | |||
| global rate of | intensity | ||||||
| improvement in energy | measured as a | ||||||
| efficiency | ratio of primary | ||||||
| energy supply to | |||||||
| gross domestic | |||||||
| product | |||||||
| Target 7.A | By 2030, enhance | 7.A.1 | X | X | X | ||
| international | International | ||||||
| cooperation to facilitate | financial flows to | ||||||
| access to clean energy | developing | ||||||
| research and | countries in | ||||||
| technology, including | support of clean | ||||||
| renewable energy, | energy research | ||||||
| energy efficiency and | and development | ||||||
| advanced and cleaner | and renewable | ||||||
| fossil-fuel technology, | energy | ||||||
| and promote | production, | ||||||
| investment in energy | including hybrid | ||||||
| infrastructure and | systems | ||||||
| clean energy | |||||||
| technology | |||||||
| Target 7.B | By 2030, expand | X | X | X | X | ||
| infrastructure and | |||||||
| upgrade technology for | |||||||
| supplying modern and | |||||||
| sustainable energy | |||||||
| services for all in | |||||||
| developing countries, | |||||||
| in particular least | |||||||
| developed countries, | |||||||
| small island developing | |||||||
| states, and land-locked | |||||||
| developing countries, | |||||||
| in accordance with | |||||||
| their respective | |||||||
| programmes of | |||||||
| support | |||||||
2.1.4. Job creation potential
An analytical approach for the energy supply system of Africa is adopted to estimate direct energy job creation corresponding to the value chain of the energy transition. The methods by Rutovitz et al (2015) [41, 42] are applied and adjusted to estimate job creation for the African continent using the associated techno-economic assumptions of the modeling inputs of this study. The employment factor (EF) method is applied amongst the other methods [53] primarily due to its simplicity and effectiveness in estimating direct employment associated with energy generation, storage, flexibility options and transmission and distribution of electricity. The EF approach is preferable to other methods since it can be modified for specific contexts and applied over energy scenarios [54]. The total direct jobs are estimated considering a sum of jobs in manufacturing, construction and installation, operations and maintenance, fuel supply associated with electricity, decommissioning of energy plants at the end of their lifetimes and transmission and distribution of electricity [42]. This approach is briefly presented in figure 3 and the methodology is further explained in detail in supplementary material A.
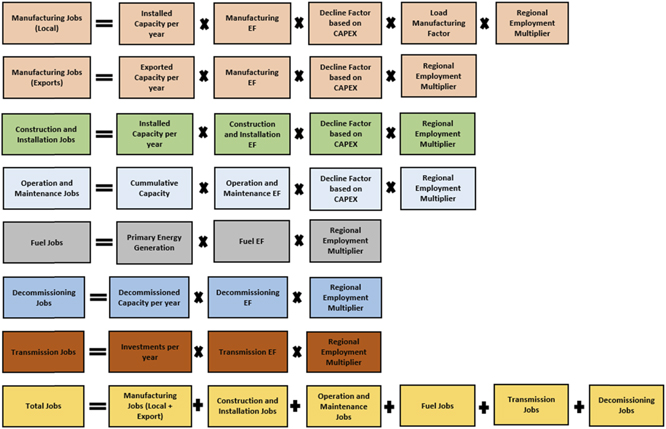
Figure 3. Method for estimating job creation during the energy transition. Abbreviations: EF, capital expenditure (CAPEX) and operational expenditure (OPEX).
Download figure:
Standard image High-resolution image2.2. Scenarios
The following four scenarios are examined for the modeling period 2015–2040, but results are provided only until 2030, focusing on achieving universal access in Africa in 2030. The changes in the input parameters among the scenarios will provide a broader understanding of how universal access can be achieved in Africa and identify low-cost investments in power generation technologies. As the African nations aim to decrease their carbon dioxide emissions in the future NDCs, how renewables can assist in this transition and the evolution of their costs is a challenge that needs to be examined. The national electrification rates of each African country located on the mainland are considered in this analysis. The National policies and SDG7 targets for each African country are collected and analyzed in each scenario. The national policies are modeled as RET targets for each African country which were adopted until 2020. The main differences between the new policies and the renewable deployment scenarios are the electrification mix for the current unelectrified settlements in the residential areas derived using the OnSSET-GEP tool [20, 32] and lower costs for renewables (figure 4). In the model, electricity is supplied to the current unelectrified settlements in the residential areas starting from 2020 onwards. The energy transition pathways examined under the renewable deployment scenario assist in addressing the challenges associated with SDG7, SDG1, SDG3 and SDG11 and SDG13. In addition, different electricity consumption levels (low, high) for the unelectrified settlements in the residential areas are considered for each of these scenarios (figure 5). The modeling assumptions can be found in the appendix
- New policies—low unelectrified settlements residential demand scenario ( NPLs ): universal access by 2030 is achieved under different electricity consumption per capita targets for 44 African countries (48 in total), depending on their current electricity consumption levels. The low demand scenario considers tiers of electricity in rural household areas of tier 1 while in urban households areas similar to the current per capita consumption in each country. The electrification tiers (1–5) are defined by ESMAP's multitier framework [55]. The scenario considers the future implementation of current commitments on power generation projects and electricity and gas interconnectors.
- New policies—high unelectrified settlements residential demand scenario ( NPHs ): the only difference with the NPL scenario is the different tiers of electricity in the household's current unelectrified settlements in the residential areas. In this scenario, the rural household areas which are currently unelectrified reach tier 3. Respectively, the households in urban areas get to one tier higher than each African country's respective electricity consumption per capita.
- Renewable deployment—low unelectrified settlements residential demand scenario ( RDLs ): it aims to combat climate change by considering lower RET costs than the new policies scenarios and examining their effect. The electrification mix is different than the new policies scenario. In this scenario, the current unelectrified settlements get tiers of electricity similar to the NPLs scenario.
- Renewable deployment—high unelectrified settlements residential demand scenario ( RDHs ): the techno-economic assumptions are similar to the RDLs scenario. The electrification mix is different than the new policies scenario. The demand projections are similar to the NPHs scenario meaning that the unelectrified settlements in the residential areas will get higher tiers of electricity than the SDLs scenario.
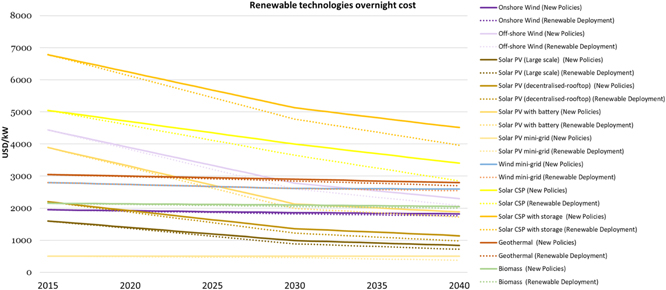
Figure 4. Evolution of the renewable technologies overnight cost (USD/kW) between the new policies and renewable deployment scenarios (in detail table 8).
Download figure:
Standard image High-resolution image
Figure 5. Evolution of the electricity demand (in TWh) among the scenarios at the African level the period 2015–2030.
Download figure:
Standard image High-resolution image3. Results
3.1. Overall technology (installed capacity) and energy supply mix
Overall, to fully electrify sub-Saharan Africa and meet the future energy needs of the continent, the total installed capacity in the continent needs to increase from 176 GW in 2015 to 383 GW (NPLs), 470 GW (NPHs), 394 GW (RDLs) and 488 GW (RDHs) in 2030. This capacity growth is primarily due to changes in electricity demand levels and renewable technology costs. Specifically, the capacity of fossil fuel technologies is increased from 142 GW in 2015 to 188 GW (49%) in NPLs, 206 GW (44%) in NPHs, 186 GW (47%) in RDLs and 207 GW (42%) in RDHs, in 2030. Natural gas constitutes most of the fossil-fuel installed capacity. In the opposite case, most of the renewable capacity in the continent was based on hydropower in 2015. But as the costs of solar decrease in the future, solar technologies will become the major renewable technologies. As the costs of renewables decrease further by 2040, the share of fossil fuels in the power system of Africa decreases even more in the renewable development scenarios than in the new policies ones. In addition, as the electricity demand increases between the scenarios (low to high), higher investments in fossil fuel technologies are required since renewables are not always available to generate electricity (figure 6).

Figure 6. Total installed capacity (in GW) and overall generation mix (in PJ) in Africa among the scenarios for the period 2015–2030.
Download figure:
Standard image High-resolution imageOff-grid solar and hybrid mini-grid solar technologies are expected to gradually penetrate the power system in sub-Saharan Africa and play a leading role in its future energy transition. The current unelectrified settlements will start getting electricity in 2020. This growth in electricity levels results in 2030 in an increase in the installed capacity of primarily solar off-grid technologies of 56 GW (15%) in NPLs, 78 GW (17%) in NPHs, 73 GW (19%) in RDLs and 102 GW (21%) in RDHs and solar hybrid mini-grid technologies of 12 GW (3%) in NPLs, 40 GW (8%) in NPHs, 15 GW (4%) in RDLs and 44 GW (9%) in RDHs.
Most of the total installed capacity in the continent was located in SAPP of 61 GW (34%) in 2015. Nevertheless, to achieve SDG7 in Africa by 2030, the EAPP is estimated to represent most of the continent's installed capacity, around 37% in all scenarios, due to currently low electricity access levels and high population increase. This energy transformation in EAPP is led by hydropower investments in Ethiopia, Sudan, Tanzania, and Egypt's fossil fuel and solar technologies growth. Also, CAPP is expected to have the higher share of renewables in the continent, mainly due to hydropower and solar potential.
To fully electrify and cover the continent's future energy needs, the total primary energy supply from 674 Mtoe in 2015 increased between 1312 Mtoe (RDLs) to 1374 Mtoe (NPHs) in 2030. In the renewable development scenarios, less supply of fossil fuels is needed as in the new policies scenarios.
The total electricity generation in Africa increased from 2704 PJ in 2015 to almost 6200 in low demand scenarios and 7500 PJ in high demand scenarios. Out of the total generated electricity, the fossil fuels share constituted 81% in 2015 and decreases to 63% (NPLs, RDLs) and 60% (NPHs, RDHs) in 2030. Natural gas is estimated to be the primary fossil fuel in the next decade. In the opposite case, hydropower was the dominant renewable power source in 2015. It remains by 2030 in the low demand scenarios, while solar power will be the dominant power source in the high demand scenarios. Specifically, off-grid solar and hybrid mini-grid solar technologies are expected to be the primary driving energy sources in the electrification of residential areas. Depending on the scenario, grid-connected technologies are estimated to supply approximately 85%–90% of the total electricity generated in Africa in 2030, mini-grid technologies 1%–6%, and stand-alone technologies 8%–11%. In the renewable development scenarios, higher penetration of stand-alone solar technologies is expected by 2030 (figure 6).
On a power pool level, NAPP is estimated to continue to base its power generation on gas power plants in the next decade, although the fossil fuel share decreases. At the same time, solar gradually penetrates the power mix in Algeria, Morocco and Libya. In most scenarios, stand-alone solar technologies will represent 13% of the electricity mix, while in NPHs, 17% in 2030.
In SAPP, electricity generation increased almost two times between 2015 and 2030. This region presents the highest fossil fuel share in the continent. Most electricity generation is based on coal power plants, while hydro and solar gradually increase their share in the electricity mix. Stand-alone solar technologies are estimated to supply the electricity progressively in the power pool by 2030.
In CAPP, the electricity generation increases by two to four times, depending on the scenario, in 2030. Most of the electricity supplied in the power pool was based on hydropower, almost 62% in 2015. Nevertheless, achieving universal access to the power pool increases fossil fuel share from 38% in 2015 to 45% (NPLs), 34% (NPHs), 45% (RDLs) and 41% (RDHs) in 2030. High electricity consumption levels lead solar power to generate most electricity instead of hydro. The current low electricity access levels and the increased population in the Democratic Republic of Congo, Cameroon and Chad have collective implications. In all scenarios, oil-based generation declines in the power pool throughout the years. However, it is replaced by coal which starts supplying electricity from 2023 onwards primarily due to investments in the Democratic Republic of Congo and gas-based generation in Cameroon. In this power pool, the role of electricity interconnectors is highlighted to achieve universal access. Specifically, the gas-based generation is higher in the renewable development scenarios than in the new policies ones, under respective electricity demand levels. This energy transition is due to the increase in the electricity supplied by gas power plants in Cameroon to satisfy part of its domestic consumption while its electricity imports from Chad decline by a significant margin. In another case, under increased electricity demand levels, DRC, except for covering part of its domestic electricity consumption from coal-based power plants and solar hybrid mini-grid systems, imports more electricity from Angola, Congo, Rwanda, and Zambia to maintain its electricity exports at similar levels (cumulatively around 108PJ).
In EAPP, electricity generation is expected to increase approximately three times in 2030. The fossil fuel share will decrease by around 20% in each scenario by 2030. Gas will be the dominant fuel in the region in the next decade as in 2015, mainly of the gas-based electricity generation in Egypt. At the same time, coal from 2023 onwards increases its share in the electricity mix by a considerable margin due to coal investments in Egypt. However, Egypt needs to import coal in the future to generate electricity due to its limited availability of identified domestic coal reserves, affecting its import dependency. In the opposite case, the government could use its natural gas reserves instead to strengthen the reliability of the power system and not be affected by the fluctuation of fossil fuel prices. Except for fossil fuel investments in Egypt, the RET-based generation in the country will increase by almost seven times. As electricity demand increases, Egypt decreases its imports cumulatively from 2015 to 2030 while it expands its natural-gas-based electricity generation. In Ethiopia, although the RET share increases significantly, specifically in hydropower, solar and geothermal, among the scenarios relatively as electricity demand increases, in the NPHs and RDHs scenarios, the country also starts producing electricity from natural gas power plants from 2028 onwards. In the high-demand scenarios, the country to cover the increased fuel needs reduces its electricity net exports to neighboring countries to even higher levels than the current ones in the low-demand scenarios. The government also assists Kenya in achieving universal access. Hydropower and solar are the dominant fuels in Ethiopia, Kenya, Sudan, Tanzania and Uganda by 2030. In another case, under higher electricity demand levels (NPHs, RDHs), Tanzania further exploits its domestic coal reserves to increase its coal-based electricity generation from 2022 onwards and decrease its net imports by 30% (2015–2030). In the opposite case, under higher electricity demand levels (NPHs, RDHs), Rwanda increased its electricity generation by increasing its gas-based electricity generation from 2021 to increase its electricity exports to Tanzania and Uganda primarily. However, this energy transition comes at the cost of increasing its carbon dioxide emissions.
WAPP presents the highest increase in its electricity generation between 2015 and 2030 in Africa while fossil fuels share gradually decreases by 2030. Gas is the dominant fuel in the region primarily due to investments in Cote D Ivoire, Ghana, Nigeria and Ghana by 2030 with an increased share of hydropower in Nigeria, Cote D Ivoire and Guinea, and off-grid and mini-grid solar technologies. As electricity demand rises between the scenarios (NPHs, RDHs), Nigeria is estimated to increase its coal-based power generation in 2022. However, the country decreases its net exports between 2015 and 2030 to satisfy the high increase in its domestic electricity consumption leading the electricity importers Benin and Niger to increase their gas-based and hydropower generation.
The overall technology and electrification mix in Africa among the scenarios (2015–2030) is presented in figure 6 and for each power pool in supplementary material B. Also, energy balances were extracted for Africa for each scenario in this study (supplementary material B).
3.2. Investment needs for achieving universal access in Africa
The total system costs of an energy system consist of the capital investments, operating and maintenance and operating fuel costs for all grid-connected, mini-grid and off-grid technologies and the transmission and distribution (T&D) infrastructure. Thus, the minimum total system costs required to cover the future electricity needs in Africa between 2020–2030 amount to 2857 billion USD at the renewable development low scenario (lowest electrification level). In the opposite case, the maximum total system costs correspond to 3357 billion USD at the renewable development high scenario in the same period. According to the new policies low and high scenarios, the total system costs are 2884 billion USD and 3295 billion USD, respectively, from 2020 to 2030. Most of the overall system costs are constituted by the operating fuel ranging from 60%–68% depending on the scenario, as the share of fossil fuels decreases between the renewable development and the new policies scenarios. The operation and maintenance costs account for approximately 6% of the total system costs and the capital costs for transmission and distribution on an average of 10% from 2020 to 2030. The higher penetration of off-grid technologies in the renewable development scenarios leads to lower investments in the T&D network than in the new policies scenarios. Higher electricity demand levels and lower renewable technology costs lead to higher capital investments in off-grid technologies during 2020–2030. However, higher capital investments in grid-connected technologies are needed in the renewable development high scenario. The relatively high costs of the gradual penetration of off-grid systems in the power system of Africa in the renewable development scenarios are offset by the lower operating fuel costs and the lower T&D costs (lead by high losses in the T&D network). The economic dimension of the power system expansion in Africa across the scenarios during 2020–2030 is presented in table 3.
Table 3. Comparison of the total system costs in the energy sector in Africa among the scenarios (in BUSD) for the period 2020–2030.
| Region | Total costs (in BUSD) | NPLs | NPHs | RDLs | RDHs |
|---|---|---|---|---|---|
| Africa | Investment (grid-connected) | 603 | 764 | 579 | 763 |
| Investment (mini-grid) | 5 | 25 | 2 | 19 | |
| Investment (off-grid) | 157 | 262 | 162 | 346 | |
| O&M (grid-connected) | 145 | 160 | 148 | 171 | |
| O&M (mini-grid) | 1 | 4 | 0.4 | 2 | |
| O&M (off-grid) | 13 | 23 | 16 | 31 | |
| Operating fuel | 1959 | 2058 | 1949 | 2024 | |
| NAPP | Investment (grid-connected) | 125 | 84 | 126 | 127 |
| Investment (mini-grid) | 0.00 | 0.04 | 0.00 | 0.26 | |
| Investment (off-grid) | 47 | 67 | 42 | 43 | |
| O&M (grid-connected) | 31 | 29 | 32 | 32 | |
| O&M (mini-grid) | 0.00 | 0.01 | 0.00 | 0.09 | |
| O&M (off-grid) | 4 | 6 | 4 | 5 | |
| Operating fuel | 316 | 313 | 314 | 317 | |
| SAPP | Investment (grid-connected) | 103 | 147 | 95 | 137 |
| Investment (mini-grid) | 1 | 2 | 0 | 1 | |
| Investment (off-grid) | 21 | 42 | 25 | 60 | |
| O&M (grid-connected) | 47 | 51 | 47 | 52 | |
| O&M (mini-grid) | 0.11 | 0.33 | 0.03 | 0.19 | |
| O&M (off-grid) | 1 | 3 | 2 | 5 | |
| Operating fuel | 396 | 414 | 393 | 407 | |
| WAPP | Investment (grid-connected) | 110 | 179 | 108 | 170 |
| Investment (mini-grid) | 2 | 5 | 0 | 3 | |
| Investment (off-grid) | 21 | 42 | 22 | 73 | |
| O&M (grid-connected) | 17 | 23 | 18 | 25 | |
| O&M (mini-grid) | 0.25 | 0.76 | 0.01 | 0.30 | |
| O&M (off-grid) | 1 | 3 | 2 | 6 | |
| Operating fuel | 412 | 446 | 407 | 433 | |
| EAPP | Investment (grid-connected) | 242 | 308 | 231 | 291 |
| Investment (mini-grid) | 2 | 10 | 2 | 8 | |
| Investment (off-grid) | 64 | 96 | 65 | 136 | |
| O&M (grid-connected) | 46 | 51 | 46 | 54 | |
| O&M (mini-grid) | 0.32 | 2 | 0.28 | 1 | |
| O&M (off-grid) | 6 | 9 | 7 | 12 | |
| Operating fuel | 727 | 756 | 725 | 742 | |
| CAPP | Investment (grid-connected) | 23 | 46 | 20 | 39 |
| Investment (mini-grid) | 0 | 7 | 0 | 7 | |
| Investment (off-grid) | 5 | 15 | 8 | 33 | |
| O&M (grid-connected) | 4 | 6 | 5 | 7 | |
| O&M (mini-grid) | 0.07 | 1 | 0.05 | 0.76 | |
| O&M (off-grid) | 0.34 | 2 | 0.63 | 3 | |
| Operating fuel | 109 | 129 | 109 | 125 |
The annual average cost of generating electricity in each African country among the scenarios is presented in table 4 over 2015–2020 and 2020–2030. The costs in each country may vary among the scenarios since there are cases (table 5) a nation increases its generation costs to assist another country in satisfying its future electricity needs. The total system costs in this study are minimized on a continental scale and not on a country-level. The average cost of generating electricity is the yearly ratio between the expenses incurred during that period (investment, operation, carbon tax) and the electricity generated. Higher average costs of generating electricity are primarily in the new policies scenarios than the renewable development scenarios primarily due to higher penetration of fossil fuel technologies resulting in higher fuel operating costs. On the other hand, higher upfront capital investments are required for renewable technologies in the renewable development scenarios.
Table 4. The average cost of generating electricity per kWh over the periods (2015–2030) (cent USD/kWh). The costs are discounted assuming an average discount rate of 8%; they include the power supply grid-connected technologies.
| Country/scenario | 2015–2020 | 2020–2030 | ||||||
|---|---|---|---|---|---|---|---|---|
| USD/kWh | NPLs | NPHs | RDLs | RDHs | NPLs | NPHs | RDLs | RDHs |
| Algeria | 6.9 | 6.9 | 7.0 | 7.0 | 7.3 | 7.1 | 7.3 | 7.3 |
| Angola | 8.3 | 8.2 | 8.3 | 8.2 | 7.1 | 7.3 | 7.1 | 7.2 |
| Benin | 9.7 | 9.5 | 9.7 | 9.5 | 4.1 | 8.9 | 3.5 | 10.5 |
| Botswana | 5.4 | 5.4 | 5.4 | 5.4 | 5.6 | 5.5 | 4.9 | 4.8 |
| Burkina Faso | 15.4 | 15.4 | 16.1 | 16.1 | 16.2 | 15.7 | 17.3 | 17.3 |
| Burundi | 6.0 | 6.0 | 6.0 | 6.0 | 6.7 | 6.0 | 6.6 | 10.4 |
| Cameroon | 5.2 | 5.2 | 5.2 | 5.2 | 5.1 | 5.4 | 5.3 | 5.5 |
| Central African Rep. | 8.2 | 8.2 | 8.2 | 8.2 | 7.3 | 7.3 | 7.2 | 7.2 |
| Chad | 11.5 | 11.1 | 11.0 | 11.2 | 23.0 | 22.1 | 8.7 | 13.3 |
| Republic of Congo | 5.2 | 5.3 | 5.2 | 5.2 | 5.6 | 6.0 | 5.6 | 5.9 |
| Democratic Republic of Congo | 1.9 | 1.9 | 1.9 | 1.9 | 2.7 | 3.3 | 2.7 | 3.3 |
| Cote d Ivoire | 5.9 | 5.9 | 5.8 | 5.8 | 7.0 | 7.5 | 6.8 | 7.6 |
| Djibouti | 11.3 | 11.3 | 11.3 | 11.3 | 8.0 | 8.2 | 8.0 | 8.0 |
| Egypt | 6.2 | 6.2 | 6.2 | 6.2 | 7.2 | 7.2 | 7.1 | 7.1 |
| Equatorial Guinea | 5.6 | 5.5 | 5.7 | 5.7 | 4.9 | 4.8 | 5.5 | 5.5 |
| Eritrea | 9.7 | 9.7 | 9.8 | 9.7 | 8.2 | 7.2 | 8.3 | 7.2 |
| Ethiopia | 6.3 | 6.1 | 6.3 | 6.1 | 10.4 | 7.8 | 10.4 | 7.8 |
| Gabon | 5.4 | 5.4 | 5.4 | 5.5 | 5.3 | 5.4 | 5.3 | 5.4 |
| Gambia | 7.5 | 7.7 | 7.7 | 7.6 | 8.1 | 8.1 | 8.1 | 8.0 |
| Ghana | 6.2 | 6.2 | 6.2 | 6.2 | 6.6 | 6.6 | 6.5 | 6.6 |
| Guinea | 9.4 | 9.5 | 9.5 | 9.1 | 13.2 | 12.4 | 13.4 | 11.9 |
| Guinea Bissau | 12.4 | 12.5 | 12.5 | 12.5 | 11.8 | 10.5 | 11.5 | 10.5 |
| Kenya | 6.4 | 6.4 | 6.5 | 6.5 | 9.4 | 8.2 | 9.6 | 8.4 |
| Lesotho | 1.3 | 1.3 | 1.3 | 1.3 | 2.6 | 3.6 | 2.0 | 3.1 |
| Liberia | 8.9 | 8.3 | 9.5 | 8.6 | 9.1 | 9.2 | 11.2 | 8.8 |
| Libya | 8.1 | 8.1 | 8.1 | 8.1 | 7.5 | 7.4 | 7.5 | 7.5 |
| Malawi | 3.7 | 3.7 | 3.7 | 3.7 | 6.1 | 6.4 | 6.1 | 6.1 |
| Mali | 10.7 | 10.7 | 10.7 | 10.7 | 7.0 | 7.0 | 7.0 | 7.0 |
| Mauritania | 8.7 | 8.6 | 8.8 | 8.8 | 9.9 | 9.6 | 9.9 | 9.7 |
| Morocco | 7.2 | 7.3 | 7.1 | 7.2 | 9.8 | 9.0 | 9.9 | 9.9 |
| Mozambique | 2.1 | 2.1 | 2.1 | 2.1 | 4.8 | 5.4 | 4.3 | 5.3 |
| Namibia | 2.5 | 2.5 | 2.6 | 2.6 | 4.6 | 4.7 | 4.4 | 4.7 |
| Niger | 9.2 | 9.1 | 9.2 | 9.2 | 30.8 | 8.0 | 9.1 | 9.0 |
| Nigeria | 5.9 | 5.9 | 5.9 | 5.9 | 6.2 | 6.4 | 6.3 | 6.4 |
| Rwanda | 5.1 | 5.1 | 5.2 | 5.2 | 9.5 | 10.2 | 8.3 | 10.9 |
| Senegal | 7.5 | 7.5 | 7.5 | 7.5 | 7.7 | 7.6 | 7.7 | 7.6 |
| Sierra Leone | 8.6 | 8.6 | 8.6 | 8.6 | 6.3 | 6.5 | 6.2 | 6.4 |
| Somalia | 10.1 | 10.1 | 10.1 | 10.1 | 6.6 | 6.6 | 6.6 | 6.6 |
| South Africa | 5.1 | 5.1 | 5.2 | 5.2 | 4.7 | 4.8 | 4.7 | 4.8 |
| Sudan | 4.9 | 4.9 | 4.9 | 4.9 | 7.6 | 7.7 | 8.2 | 8.2 |
| South Sudan | 9.9 | 9.9 | 9.9 | 9.9 | 6.4 | 6.4 | 6.4 | 6.4 |
| Eswatini | 1.9 | 1.9 | 1.9 | 1.9 | 3.9 | 4.4 | 3.8 | 4.3 |
| Tanzania | 5.4 | 5.4 | 5.4 | 5.4 | 6.0 | 5.9 | 6.1 | 6.0 |
| Togo | 4.5 | 4.5 | 4.5 | 4.5 | 5.9 | 6.7 | 5.8 | 6.6 |
| Tunisia | 6.7 | 6.7 | 6.9 | 6.8 | 7.0 | 6.8 | 7.1 | 7.1 |
| Uganda | 4.9 | 4.7 | 4.9 | 4.7 | 5.4 | 5.7 | 5.2 | 5.9 |
| Zambia | 2.8 | 2.7 | 2.8 | 2.7 | 3.9 | 3.9 | 3.8 | 3.9 |
| Zimbabwe | 5.0 | 5.1 | 5.0 | 5.0 | 8.5 | 8.28 | 8.1 | 7.5 |
Table 5. Tracking SDG7 targets, sub-targets and indicators for each African country among the scenarios in 2030

|
aSolar hybrid technologies included in renewables. bTotal primary energy supply per GDP [56]. cProduction of fossil fuel reserves during 2015–2030 per each country's total amount of identified fossil fuel reserves. dTotal net imports (imports minus exports) of coal, crude oil, oil products and natural gas as a share of total primary energy supply in 2030. Negative values correspond to net exporters. The differences in the RET share may occur since the electricity generation is not always the same among the scenarios and the supply mix differs since the electricity trading scheme changes among the scenarios.
3.3. Sustainability insights for achieving SDG7 in each African nation
Achieving SDG7 in forty-eight African nations by 2030 will have different implications for the targets and sub-targets associated with SDG7 and each nation's energy transition. The modeling results below can assist each country in understanding the conflicting objectives among the evolution of the power system with the energy indicators mentioned above. Specifically, although Benin, Cote D Ivoire, Equatorial Guinea and Ghana will increase their renewable energy targets by 2030, this energy transition consumes most of their respective fossil fuel reserves to cover their future energy needs, negatively affecting their net import dependency on the future. As a result of this analysis, the evolution of some indicators: the share of renewables, CO2 emissions, energy intensity (energy production/GDP), the lifetime of fossil fuel resources and import dependency calculated for each African country is presented in table 5.
3.4. Environmental implications
The total carbon dioxide emissions of the evolution of the energy system in Africa increased from 1205 Mton in 2015 to 2786 Mton (NPLs), 2931 Mton (NPHs), 2775 (RDLs) and 2904 Mton (RDHs) depending on the scenario in 2030. NAPP is estimated to represent most of the continent's carbon dioxide emissions in the future, although the share of renewable energy technologies increases, followed by EAPP, SAPP, WAPP and CAPP (supplementary material B). Higher electricity consumption levels lead to higher carbon dioxide emissions. However, lower carbon dioxide emissions are emitted as the renewable technology costs decrease (RDLs, RDHs). Thus, a decreased cost of renewables could further assist an African nation in evolving its power sector to achieve universal access and achieve part of the National Determined Contribution greenhouse gas emissions targets.
3.5. Socio-economic implications: job creation
Previous sections show that Africa needs energy to grow, which has environmental implications and is costly. However, this energy transition and electricity access can create several jobs than lost. Different jobs can be created associated with the construction and installation of the power generation technologies to the fuel use and specifically the use of power generation technologies. In Africa, approximately 6.9 million direct jobs can be created by expanding power generation capacity and T&D network in the NPLs scenario, 8.7 million jobs in the NPHs scenario, 7.0 million jobs in the RDLs scenario and 9.6. Million jobs in the RDHs scenario during 2020–2030 across the supply chain of the evolution of the power sector (figure 7). Of this total number of jobs in each scenario, 6.4 million jobs in NPLs, 7.8 million jobs in the NPHs, 6.5 million jobs in the RDLs and 8.7 million in the RDHs scenarios accordingly are associated with the future installation and operation of specific power generation technologies. Solar power is expected to be the dominant technology in creating new employment opportunities (figure 8). It is assumed that the manufacturing happens only locally and is not created from exports to other countries. In the renewable deployment scenarios, more jobs are created in the manufacturing (local) sector, construction and installation, and operation and maintenance, but lower jobs in transmission since the future installed capacity is less due to higher penetration of off-grid renewable technologies. However, higher fuel jobs are created in the RDLs and RDHs scenarios than in the new policies scenarios, primarily due to the fuel used in coal power plants until 2030. Increasing the share of renewables can boost employment in Africa, while fossil fuel development can support jobs in different ways. Further increasing the electricity consumption levels in Africa (NPHs, RDHs) is estimated to create more jobs. Solar hybrid mini-grid systems are not included in the analysis of job creation potential.
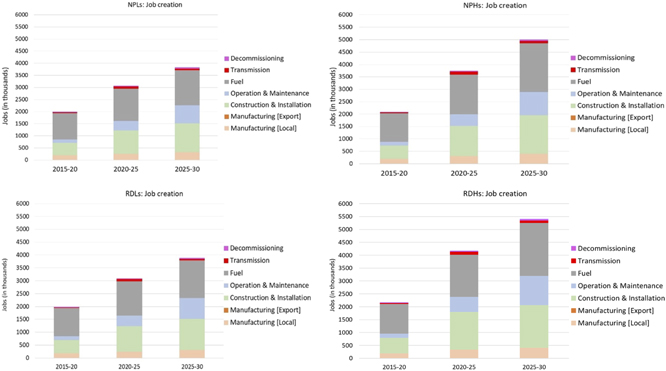
Figure 7. Jobs created (in thousands) in different categories with the evolution of the power system in Africa over the period 2015–2030.
Download figure:
Standard image High-resolution image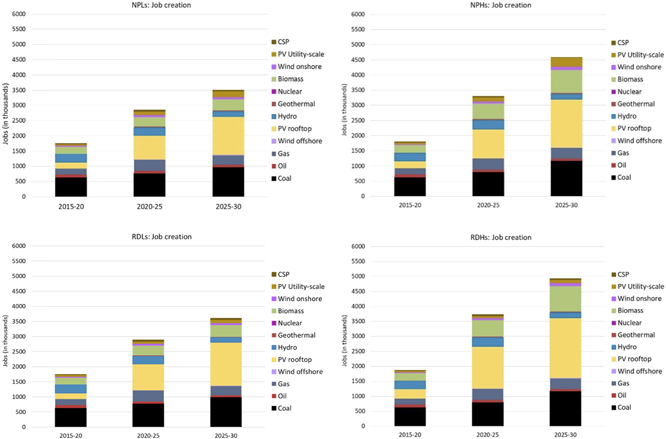
Figure 8. Jobs created (in thousands) by each power generation technology in the evolution of the power system in Africa over the period 2015–2030.
Download figure:
Standard image High-resolution image
4. Conclusions
This study highlights the importance of strategic energy planning to achieve universal electricity access in forty-eight African nations and cover the continent's future energy needs considering the nation's socio-economic development until 2030. Exploiting the energy resources of Africa strategically to expand its power system can lead to formulate effective policy measures for climate change adaptation and mitigation. The energy transition is complex and has several implications for a nation's economy and future development. In this analysis, least-cost power generation investment options using energy systems analysis enhanced with geospatial data for forty-eight African countries are identified, considering different levels of electricity consumption per capita (low, high) and costs of renewables (new policies, renewable deployment). The four scenarios examined in this study investigated the implications of the future energy transition in Africa on the electricity supply mix, the total system costs, achieving SDG7 and its sub-targets, the associated environmental and socio-economic implications. A critical dimension of achieving SDG7 in Africa, except the different electricity consumption levels each African nation wants to achieve, is the evolution of renewable technology costs. Africa cannot afford a cost-increasing green energy transition pathway. This study develops country-specific electrification investment outlooks to assist each African nation's (located in the mainland) government officials and policy-makers in strengthening risk mitigation associated with future renewable energy projects and ensuring their financial viability.
The power generation capacity in Africa needs to increase approximately 2.2–2.7 times in the NPLs and NPHs scenarios accordingly, while 2.3–2.8 times in the RDLs and RDHs scenarios, to cover its future energy needs and achieve SDG7 between 2015–2030. Natural gas constitutes most of the fossil-fuel installed capacity in all scenarios. In the opposite case, hydropower is currently the dominant RET. It will remain by 2030 if the costs of solar technologies do not significantly decrease in the upcoming decade. Otherwise, as shown in the RDLs and RDHs scenarios, solar power can be the leading power generation technology in Africa by 2030, building climate change resilience. Off-grid and hybrid mini-grid solar technologies are expected to play an important role in the electrification of residential areas. The total primary energy supply in the continent is estimated to increase from 674 Mtoe in 2015 to a range of 1312 Mtoe to 1374 Mtoe in 2030, depending on the scenario. That means that the total electricity generation in the continent needs to increase by 2.3 times in the NPLs, RDLs scenarios and 2.8 times in the NPHs and RDHs scenarios, respectively, by 2030. The fossil fuels share constituted 81% in 2015, decreasing to 63% in low demand scenarios and 60% in high demand scenarios. Higher electricity demand levels lead to higher penetration of fossil fuel technologies in the power mix of Africa. However, to achieve the same electricity demand levels, decreasing renewables' costs can assist in a less carbon-intensive power system, although higher capacity needs to be installed. Depending on the scenario, grid-connected technologies supply approximately 85%–90% of the total electricity generated in Africa in 2030, mini-grid technologies roughly 1%–6%, and stand-alone technologies 8%–11%. Off-grid solar technologies supply electricity approximately 8% (NPLs), 9% (NPHs), 10% (RDLs) and 11% (RDHs) of the total generated electricity in Africa and solar hybrid mini-grid technologies 2% (NPLs), 5% (NPHs), 1% (RDLs) and 3% (RDHs) by 2030.
Achieving lower-higher electricity demand levels and the costs of renewables could transform countries accordingly into net importers or exporters depending on their future energy choices (e.g., Tanzania). Also, based on the future energy investments of each nation, achieving SDG7 in an African country may have collective implications for several factors (e.g., CO2 emissions, energy intensity, etc) and achieving one target may have conflicting objectives with others on a local level but also a regional one. Benin, Cote D Ivoire, Equatorial Guinea and Ghana are some countries that will increase their renewable energy targets by 2030. However, this energy transition consumes most of their fossil fuel reserves to cover their future energy needs, negatively affecting their net import dependency in the future. The outcomes of this analysis, achieving SDG7 in Africa, can provide insights into other SDGs such as SDG1, SDG2, SDG3, SDG6, SDG8 and SDG13 [3].
Higher penetration of renewable energy sources in the energy mix reduces dependence on imported fuels, creates local jobs, and increases cost efficiency. Although higher up-front capital investments in renewables are required, the operating fuel costs are lower in the long term. Thus, the total system costs needed to fully electrify Africa and cover the future electricity needs in the continent during 2020–2030 amount from 2857 to 3357 billion USD, depending on the scenario. The penetration of off-grid solar technologies in the renewable deployment scenarios leads to fewer investments in the transmission and distribution network, preventing the relatively high infrastructure losses and improvements needed to upgrade the network and decreasing operating fuel costs. Nevertheless, improvements to the T&D network are necessary to provide reliable electricity to the citizens. Moreover, the countries could partly take advantage of their electricity and gas export revenues to other countries to financially support their future energy transition.
Despite the gradual penetration of renewable energy and off-grid solar technologies in the continent's energy mix, which is higher as renewable costs decrease, Africa is still hard to achieve its green revolution. Domestic identified fossil fuel reserves and fossil-fuel technologies are still the least-cost options to satisfy future energy needs in Africa and provide resilient power grids. An example is the coal power plants which may be phased out in South Africa but be installed in Egypt in the upcoming years and the gradual penetration of natural gas power plants in Nigeria. Consequently, the total carbon dioxide emissions of the future energy transition in Africa will still increase, more than double by 2030. Thus, a decreased cost of renewables could further assist an African nation in evolving its power sector to be less carbon-intensive. The continental and national scale insights could inform the National Determined Contributions targets by demonstrating the broader African context of national greenhouse gas emission targets.
Africa needs energy to grow, which has environmental implications and is costly. However, this energy transition and achieving electricity access can create several jobs than lost. Approximately 7 to 10 million direct jobs can be created in Africa by expanding the power generation capacity and the T&D network, depending on the scenario, during 2020–2030 across the supply chain. The increased share of renewables in the energy transition in Africa can boost job creation, while fossil fuel development can support jobs in different ways. Increasing the electricity consumption levels in Africa (NPHs, RDHs) leads to higher total system costs, but it is estimated to create more jobs. Also, the decreasing costs of renewables (RDLs, RDHs) could further increase the penetration of renewables in the energy mix, leading to a higher number of jobs. Potentially achieving climate change targets in the future (e.g., 2.0 °C, 1.5 °C), more jobs could be created in Africa, meaning that more jobs can ensure political and societal stability. Also, how the jobs will be created and spread in Africa due to the diversification of the energy mix in each African nation may lead to social and economic disruptions, so strategic energy planning is essential.
National and governmental institutions and universities involved in capacity-building activities could benefit from this open-source study since the provided datasets could strengthen the capacity for developing others and extending existing energy systems models.
The analysis could be further improved in different ways. Increase the sub-annual time resolution to better capture the variability in the electricity generated by renewable technologies. However, this is prevented due to the limitation of other input data associated with the model. Include country-specific hydro capacity factors and represent hydropower plants individually instead of aggregating them per size. Hydrological modeling of each planned dams would provide more accurate quantification of dam productivity and impacts. Including an explicit representation of reserve margin in each country's power system would improve the representation of national energy systems. Battery storage for solar PV and pumped hydropower storage are only implicitly modeled due to the macroscopic nature of the study that focuses on Africa's urgent need for access to energy and computational constraints (e.g., the computational time increases significantly). Better data (e.g., available country information on future power plant investments, energy reserves) and spatial techniques (e.g., soft-link with GIS, 2–3 iterations with GEP) could enhance the modeling results. Disaggregate the final energy demand in sectors and exogenous assumptions around fuel switching and efficiency improvements. Including oil and coal export analysis (rather than assuming exogenous sales levels) is currently excluded from this analysis. Lastly, the NDCs of all countries were collected and analyzed in this study but weren't incorporated since each country's greenhouse gas emission limits are not only related to the energy sector. However, the outcomes of this analysis can be used to inform each country's NDCs.
Acknowledgments
The author would like to thank Ms Alicia Oberholzer, Senior Associate Research in Clean Cooking Alliance, for proofreading the latest draft of the paper. This work utilized resources from the University of KTH Royal Institute of Technology, Division of Energy Systems.
Data availability statement
The data that support the findings of this study are openly available at the following URL/DOI: https://zenodo.org/record/6468262 [66].
Code availability
The OSeMOSYS code used to develop the model for Africa can be found in Zenodo-Github repository [66]. The current version of the TEMBA model takes up to 60 min. to solve using a commercial-grade solver (such as CPLEX or Gurobi) and requires up to 64 GB of memory.
Conflict of interest
The authors declare no competing interests.
Appendix A.: Methods—model description
A.1. The energy supply system
The energy supply system for each African country is constituted by fuel supply technologies categorized into import and extraction technologies and crude oil refineries. The natural gas imports can be through pipelines or liquefied natural gas terminals. Each country's power system is constituted by centralized and decentralized technologies (stand-alone, mini-grid) (table 7, supplementary material A). The techno-economic parameters for each scenario's different types of technologies are presented in tables 8 and 9. The decentralized technologies are aligned with the ones considered in the GEP tool [44]. Electricity interconnector projects between the African countries for imports and exports are considered in the analysis. Also, a transmission and distribution network with the associated losses for each African country is modeled. Lastly, for the non-power sector, only fuel conversion technologies are considered in the analysis and the other sectors are not explicitly modeled. The energy demands are presented in section A.2.1. The reference energy system shows the technologies and fuels considered in each country's energy system in a schematic representation (supplementary material A).
The analysis does not include the energy supply systems of island countries (e.g., Cape Verde, Madagascar, Mauritius, Sao Tome and Principe, Seychelles). In some cases, the relatively small size of their power systems, the lack of existing and future grid connections and the lack of available data resulted in excluded these systems from the analysis, as they do not significantly affect overall trade in Africa.
Only the energy supply systems of the following forty-eight nations in the African context are included in the analysis (table 6).
Table 6. List of African countries per power pool (with the ISO 3166-1 alpha-3 [58] country code in brackets).
| Central Africa (CAPP) | Eastern Africa (EAPP) | Northern Africa (NAPP) | Southern Africa (SAPP) | Western Africa (WAPP) |
|---|---|---|---|---|
| Cameroon (CMR) | Burundi (BDI) | Algeria (DZA) | Angola (AGO) | Benin (BEN) |
| Central African Rep. (CAF) | Djibouti (DJI) | Libya (LBY) | Botswana (BWA) | Burkina Faso (BFA) |
| Chad (TCD) | Eritrea (ERI) | Mauritania (MRT) | Lesotho (LSO) | Côte d'Ivoire (CIV) |
| Congo (COG) | Ethiopia (ETH) | Morocco (MAR) | Malawi (MWI) | Gambia (GMB) |
| Democratic Rep. of Congo (COD) | Kenya (KEN) | Tunisia (TUN) | Mozambique (MOZ) | Ghana (GHA) |
| Equatorial Guinea (GNQ) | Rwanda (RWA) | Namibia (NAM) | Guinea (GIN) | |
| Gabon (GAB) | Somalia (SOM) | South Africa (ZAF) | Guinea Bissau (GNB) | |
| Sudan (SDN) | Eswatini (SWZ) | Liberia (LBR) | ||
| South Sudan (SSD) | Zambia (ZMB) | Mali (MLI) | ||
| Tanzania (TZA) | Zimbabwe (ZWE) | Niger (NER) | ||
| Uganda (UGA) | Nigeria (NGA) | |||
| Egypt (EGY) | Senegal (SEN) | |||
| Sierra Leone (SLE) | ||||
| Togo (TGO) |
Table 7. Type of power generation technologies.
| Fossil and nuclear | Renewables | |
|---|---|---|
| Centralized | Diesel | Geothermal |
| Heavy fuel oil | Biomass and waste combined heat and power (CHP) | |
| Natural gas: open cycle gas turbine (OCGT), combined cycle gas turbine (CCGT) | Hydro: Small, medium, large | |
| Coal | Wind: onshore | |
| Nuclear | Solar PV (utility-scale) | |
| Solar PV (rooftop) | ||
| Solar PV with storage | ||
| Concentrated solar power (CSP) with storage | ||
| CSP without storage | ||
| Decentralized | Diesel genset Mini grid (unelectrified settlements) | Small hydro micro grid (unelectrified settlements) |
| Diesel genset stand alone (unelectrified settlements) | Solar PV micro grid (unelectrified settlements) | |
| Solar PV 1–5 stand alone | ||
| (0.02 kW, 0.05 kW, 0.1 kW, | ||
| 0.2 kW, > 0.2 kW; unelectrified settlements) Wind micro | ||
| grid (unelectrified settlements) |
Table 8. Techno-economic parameters for technologies for each scenario [7]. a
| Technology | New policies | Sustainable development | ||||||||||
|---|---|---|---|---|---|---|---|---|---|---|---|---|
| Operational and | Operational and | |||||||||||
| maintenance | maintenance | |||||||||||
| Overnight cost (USD/kW) | cost (USD/kW) | Overnight cost (USD/kW) | cost (USD/kW) | |||||||||
| 2015 | 2030 | 2040 | 2015 | 2030 | 2040 | 2015 | 2030 | 2040 | 2015 | 2030 | 2040 | |
| Diesel centralized | 1200 | 1200 | 1200 | 35 | 35 | 35 | 1200 | 1200 | 1200 | 35 | 35 | 35 |
| Heavy fuel oil | 1467 | 1467 | 1467 | 44 | 44 | 44 | 1467 | 1467 | 1467 | 44 | 44 | 44 |
| OCGT | 400 | 400 | 400 | 20 | 20 | 20 | 400 | 400 | 400 | 20 | 20 | 20 |
| CCGT | 700 | 700 | 700 | 25 | 25 | 25 | 700 | 700 | 700 | 25 | 25 | 25 |
| Supercritical coal | 1600 | 1600 | 1600 | 65 | 60 | 60 | 1600 | 1600 | 1600 | 65 | 60 | 60 |
| Hydro (large scale) | 2100 | 2100 | 2100 | 50 | 50 | 50 | 2100 | 2100 | 2100 | 50 | 50 | 50 |
| Hydro (small scale) | 3300 | 3300 | 3300 | 60 | 60 | 60 | 3300 | 3300 | 3300 | 60 | 60 | 60 |
| Hydro (medium scale) | 2100 | 2100 | 2100 | 50 | 50 | 50 | 2100 | 2100 | 2100 | 50 | 50 | 50 |
| Biomass | 2150 | 2100 | 2050 | 75 | 70 | 70 | 2150 | 2050 | 2000 | 75 | 70 | 70 |
| Nuclear | 4000 | 4000 | 4000 | 170 | 170 | 170 | 4000 | 4000 | 4000 | 170 | 170 | 170 |
| Geothermal | 3050 | 2900 | 2800 | 60 | 55 | 55 | 3050 | 2850 | 2700 | 60 | 55 | 55 |
| Wind onshore | 1950 | 1860 | 1820 | 48 | 48 | 46 | 1950 | 1820 | 1760 | 48 | 46 | 46 |
| Wind offshore | 4440 | 2780 | 2300 | 115 | 80 | 70 | 4440 | 2600 | 2080 | 115 | 75 | 65 |
| Diesel stand-alone (1 kW) (decentralised) | 261 | 261 | 261 | 23 | 23 | 23 | 261 | 261 | 261 | 23 | 23 | 23 |
| Solar PV (centralised-large scale) | 1600 | 990 | 840 | 24 | 22 | 22 | 1600 | 890 | 720 | 24 | 22 | 20 |
| Solar PV (decentralised-rooftop) | 2200 | 1360 | 1140 | 32 | 30 | 28 | 2200 | 1220 | 980 | 32 | 30 | 28 |
| Solar PV with battery | 3889 | 2130 | 1881 | 48 | 46 | 46 | 3889 | 1990 | 1721 | 48 | 46 | 46 |
| Solar CSP | 5050 | 4000 | 3400 | 200 | 160 | 140 | 5050 | 3650 | 2850 | 200 | 150 | 110 |
| Solar CSP with storage | 6789 | 5129 | 4513 | 228 | 188 | 168 | 6789 | 4779 | 3963 | 228 | 178 | 138 |
| Small hydro—mini grid | 3000 | 3000 | 3000 | 90 | 90 | 90 | 3000 | 3000 | 3000 | 90 | 90 | 90 |
| Solar PV—mini grid | 503 | 503 | 503 | 7 | 4 | 3 | 503 | 461 | 377 | 7 | 4 | 3 |
| Wind—mini grid | 2800 | 2613 | 2594 | 56 | 52 | 50 | 2800 | 2613 | 2545 | 56 | 52 | 50 |
| Solar PV—1 stand alone (kW < 0.02) | 9620 | 9620 | 8064 | 192 | 107 | 86 | 962 | 962 | 772 | 19 | 107 | 86 |
| Solar PV—2 stand alone (0.02 < kW < 0.05) | 8780 | 8780 | 7360 | 176 | 97 | 78 | 8780 | 8780 | 7053 | 176 | 97 | 78 |
| Solar PV—3 stand alone (0.05 < kW < 0.1) | 6380 | 6380 | 5348 | 128 | 71 | 57 | 6380 | 6380 | 5125 | 128 | 71 | 57 |
| Solar PV—4 stand alone (0.1 < kW < 1) | 4470 | 4470 | 3747 | 89 | 50 | 40 | 4470 | 4470 | 23591 | 89 | 50 | 40 |
| Solar PV—5 stand alone (kW > 1) | 6950 | 6950 | 5826 | 139 | 77 | 62 | 6950 | 6950 | 5583 | 139 | 77 | 62 |
| Inverter | 80 | 80 | 80 | 0 | 0 | 0 | 80 | 80 | 80 | 0 | 0 | 0 |
| Charge controller | 142 | 142 | 142 | 0 | 0 | 0 | 142 | 142 | 142 | 0 | 0 | 0 |
aInvestment cost = overnight cost × (1 + discountrate)constructiontime, batteries = 139 USD/kWh
Table 9. Technical parameters for power generation technologies (on-grid and off-grid) [7].
| Technology | Lifetime (years) | Efficiency (%) | Load factor (%) | |
|---|---|---|---|---|
| 2015 | 2040 | |||
| Diesel centralized | 25 | 35% | 35% | 80% |
| Diesel stand-alone (1 kW) (decentralised) | 10 | 16% | 16% | 30% |
| Heavy fuel oil | 25 | 35% | 35% | 80% |
| OCGT | 25 | 38% | 46% | 85% |
| CCGT | 30 | 58% | 63% | 85% |
| CCGT − CCS | ||||
| Supercritical coal | 30 | 39% | 39% | 85% |
| Coal + CCS | ||||
| Hydro (large scale) | 50 a | 100% | 100% | 50% |
| Hydro (small scale) | 30 a | 100% | 100% | 25% |
| Hydro (medium scale) | 50 a | 100% | 100% | 50% |
| Biomass | 40 | 35% | 35% | 50% |
| Nuclear | 60 | 33% | 33% | 85% |
| Geothermal | 25 | 80% | 80% | 85% |
| Wind onshore | 25 | 100% | 100% | Country specific (24%–48%) |
| Wind offshore | 25 | 100% | 100% | Country specific (24%–48%) |
| Solar PV (centralised-large scale) | 25 | 100% | 100% | Country specific (13%–32%) |
| Solar PV (decentralised-rooftop) | 20 | 100% | 100% | Country specific (13%–32%) |
| Solar PV with battery | 20 | 100% | 100% | Country specific (14%–33%) |
| Solar CSP | 25 | 100% | 100% | Country specific (33%–52%) |
| Solar CSP with storage | 25 | 100% | 100% | Country specific (38%–72%) |
| Diesel genset—mini grid | 15 | 33% | 33% | 70% |
| Small hydro—mini grid | 30 | 100% | 100% | 25% |
| Solar PV—mini grid | 20 | 100% | 100% | Country specific (13%–32%) |
| Wind—mini grid | 20 | 100% | 100% | Country specific (24%–48%) |
| Solar PV—1 stand alone (kW < 0.02) | 10 | 28% | 28% | 50% |
| Solar PV—2 stand alone (0.02 < kW < 0.05) | 15 | 100% | 100% | Country specific (13%–32%) |
| Solar PV—3 stand alone (0.05 < kW < 0.1) | 15 | 100% | 100% | Country specific (13%–32%) |
| Solar PV—4 stand alone (0.1 < kW < 1) | 15 | 100% | 100% | Country specific (13%–32%) |
| Solar PV—5 stand alone (kW > 1) | 15 | 100% | 100% | Country specific (13%–32%) |
| Solar PV (centralised-large scale) | 15 | 100% | 100% | Country specific (13%–32%) |
aIn the model, it is assumed that the lifetime is 80 years. Thus the existing power plants are not retired but continue their operation.
A.2. Overall data-model assumptions
The modeling period spans between 2015–2040, providing results on an annual basis until 2030. The last ten years of the modeling period were added to prevent the 'edge effects' as they are distorted by the model, considering that as the 'end-of-time'. Each year is divided into four seasons and two dayparts to capture the key features of the electricity demand load pattern. The year split is defined at a continental level, so the countries cannot have a corresponding day split (e.g., day and night). The 'daypart 1' is between 09:00–18:00 (most of the commercial and public services are supposed to operate) and 'daypart 2' is between 18:00–09:00. 'Season 1' corresponds to the period between March–May, 'Season 2' between June–August, 'Season 3' between September–November and 'Season 4' between December–February. Country-specific hourly electricity demand profiles are used to develop average profiles for electricity demand for the models' temporal split [12].
Country-specific fossil fuel reserves and renewable potential are considered in the analysis. The list of power plants considered in the model is categorized into existing projects which are operational (OPR), committed if the construction is about to start soon (CON) and planned if the power plants are identified as candidates (PLN) for each country's power system [58]. The power plants are distinguished in old (existing ones until 2014) with lower efficiencies than the new ones. No new future electricity and gas trade flows are considered in the model except the operational and committed ones. To capture the variability of renewable energy generation, hourly wind and solar generation profiles country-specific are used [59], except for hydropower plants where generic capacity factors are considered based on the region's seasonality due to lack of data [60]. In the model, country-specific losses are considered in the transmission and distribution network. Country-specific fuel prices considered in the analysis distinguished between inland and coastal. Lastly, a carbon tax is applied only in South Africa. The techno-economic assumptions of the energy supply technologies and the energy system model overall can be found in supplementary material A.
The real discount rate is 8% for the whole of Africa [44]. The monetary unit used is the 2015 United States Dollars (USD). The USD gross domestic product (GDP) deflator from the World Bank Group is used [11] to adjust the fuel prices reported in different years to the base year (2015).
A.2.1. Energy demands
The energy demands considered in the model for the different fuels are: (i) electricity, (ii) biofuels and waste, (iii) coal, (iii) natural gas and (iv) oil products demand. The electricity demands are categorized in: (i) 'all sectors' which include the aggregated final electricity consumption and (ii) 'residential electricity demands of current unelectrified settlements' distinguished in low and high depending on the electricity consumption per capita levels. The fuel exports (coal, crude oil, oil products, biofuels & waste) are exogenously encountered in the model and are based on the average values of the historical year's exports for each country [61, 62]. The fuel exports (non-electricity and gas ones) remain the same across all the scenarios.
To estimate the fuel demands in '(all sectors)' the IBM SPSS Statistics tool is used to conduct a linear regression analysis using historical data (fuel consumption, GDP, population, urbanization) between 1990–2018 and project the values until 2040, using as methods criteria the probability of F. In case the regression analysis did not fit well between the dependent variable (fuel consumption) and the independent ones (GDP, population, urbanization) then the average growth rate of the power pool is used for that country or the average growth rate of the historical values of the respective country.
The historical fuel consumption between 1990 and 2018 is derived from IEA World Energy Balances and UN Department for Economic and Social Affairs Statistics Division [61, 62]. The historical values of GDP derived by the World Bank Group [9] and the projections are compatible with shared socio-economics pathways [63]. The historical and forecasts for the population [56] and urbanization values [64] are derived from the United Nations, Department for Economic and Social Affairs, Population Division 2019 (medium varant scenario).
The 'residential electricity demands of current unelectrified settlements' start from 2020 to achieve universal access by 2030. They are categorized as 'low unelectrified settlements residential demand' and 'high unelectrified settlements residential demand'. The electricity demand projections for low and high electricity consumption per capita levels in rural and urban areas are derived from GEP [44]. The demand projections are based on national electrification rates [8], population projections (medium varant scenario) [56], average household size in rural and urban areas [36] and electrification tiers based on the multitier framework defined by ESMAP [65]. Energy efficiency measures are not considered in demand projections (table 10).
Table 10. National electrification rate in 2019 [8].
| Country/region | National (%) | Urban (%) | Rural (%) |
|---|---|---|---|
| Central Africa | |||
| Cameroon | 63 | 93 | 24 |
| Central African Rep. | 14 | 32 | 2 |
| Chad | 8 | 37 | 3 |
| Congo | 48 | 66 | 13 |
| Democratic Rep. of Congo | 19 | 41 | 1 |
| Equatorial Guinea | 67 | 91 | 2 |
| Gabon | 91 | 98 | 24 |
| Eastern Africa | |||
| Burundi | 11 | 63 | 3 |
| Djibouti | 61 | 72 | 25 |
| Eritrea | 50 | 76 | 37 |
| Ethiopia | 48 | 93 | 36 |
| Kenya | 70 | 91 | 62 |
| Rwanda | 38 | 93 | 26 |
| Somalia | 36 | 66 | 11 |
| Sudan | 54 | 81 | 39 |
| South Sudan | 7 | 13 | 5 |
| Tanzania | 38 | 73 | 19 |
| Uganda | 41 | 71 | 32 |
| Egypt | 100 | 100 | 100 |
| Northern Africa | |||
| Algeria | 100 | 100 | 99 |
| Libya a | 69 | 100 | 8 |
| Mauritania | 45 | 82 | 1 |
| Morocco | 100 | 100 | 99 |
| Tunisia | 100 | 100 | 100 |
| Southern Africa | |||
| Angola | 43 | 74 | 4 |
| Botswana | 70 | 88 | 28 |
| Lesotho | 45 | 76 | 32 |
| Malawi | 11 | 46 | 4 |
| Mozambique | 30 | 73 | 5 |
| Namibia | 55 | 75 | 35 |
| South Africa | 85 | 88 | 79 |
| Eswatini | 77 | 91 | 73 |
| Zambia | 43 | 80 | 14 |
| Zimbabwe | 41 | 85 | 20 |
| Western Africa | |||
| Benin | 40 | 65 | 17 |
| Burkina Faso | 14 | 62 | 5 |
| Cote D Ivoire | 69 | 94 | 42 |
| Gambia | 60 | 80 | 28 |
| Ghana | 84 | 94 | 70 |
| Guinea | 42 | 88 | 16 |
| Guinea Bissau | 31 | 54 | 13 |
| Liberia | 28 | 46 | 8 |
| Mali | 48 | 91 | 15 |
| Niger | 19 | 50 | 13 |
| Nigeria | 55 | 84 | 26 |
| Senegal | 70 | 95 | 48 |
| Sierra Leone | 23 | 51 | 2 |
| Togo | 52 | 92 | 24 |
aIt is assumed that the electricity access in Libya is almost 100%.
The assumptions used for the energy demand projections are presented below except from the socio-economic assumptions (population, real GDP and urbanization). The 'residential electricity demands of current unelectrified settlements' for each African country and each scenario are presented below. The rest of the fuel demands are in supplementary material A.
Assumptions used for energy demand projections (tables 11and 12).
Table 11. Multi-tier matrix for measuring household electricity consumption [56].
| TIER 1 | TIER 2 | TIER 3 | TIER 4 | TIER 5 | |
|---|---|---|---|---|---|
| Annual consumption levels, in kWhs | >=4.5 | >=73 | >=365 | >=1250 | >=3000 |
Table 12. Residential electricity demands of current unelectrified settlements in 2030 (GWh) a .
| Country/region | New policies & renewable deployment (low) | New policies & renewable deployment (high) |
|---|---|---|
| Central Africa | ||
| Cameroon | 1598.2 | 8407.2 |
| Central African Rep. | 461.1 | 1650.4 |
| Chad | 986.1 | 4649.4 |
| Congo | 1169.6 | 3467.6 |
| Democratic Rep. of Congo | 11 257.1 | 38 429.1 |
| Equatorial Guinea | 564.2 | 856.2 |
| Gabon | 1213.6 | 1749.5 |
| Eastern Africa | ||
| Burundi | 720.2 | 4300 |
| Djibouti | 271.4 | 407.6 |
| Eritrea | 169.5 | 1089.8 |
| Ethiopia | 7106 | 33 638.7 |
| Kenya | 6056.8 | 25 586.5 |
| Rwanda | 233.4 | 2531.2 |
| Somalia | 1542.4 | 5251.7 |
| Sudan | 7895.4 | 15 286.7 |
| South Sudan | 615.3 | 3091.1 |
| Tanzania | 7144.5 | 26 787.3 |
| Uganda | 4782.3 | 20 929.4 |
| Egypt | — | — |
| Northern Africa | ||
| Algeria | — | — |
| Libya | — | — |
| Mauritania | 480.5 | 1509.3 |
| Morocco | — | — |
| Tunisia | — | — |
| Southern Africa | ||
| Angola | 11 236 | 17 381.4 |
| Botswana | 2409.6 | 3662.5 |
| Lesotho | 273.2 | 1143.6 |
| Malawi | 3308.7 | 8817.8 |
| Mozambique | 3841.3 | 14 321.3 |
| Namibia | 1890.6 | 2199.3 |
| South Africa | 15 207.7 | 45 136 |
| Eswatini | 167.5 | 799.3 |
| Zambia | 5221 | 9684.8 |
| Zimbabwe | 4033.5 | 8352.3 |
| Western Africa | ||
| Benin | 635.6 | 3746.2 |
| Burkina Faso | 608.7 | 4629.1 |
| Cote D Ivoire | 3085.7 | 10 119.1 |
| Gambia | 68.6 | 339.4 |
| Ghana | 5497.1 | 17 187.6 |
| Guinea | 1034.9 | 3925.5 |
| Guinea Bissau | 58.2 | 370.7 |
| Liberia | 1597.3 | 2673.3 |
| Mali | 606 | 3714 |
| Niger | 1033.4 | 5967.2 |
| Nigeria | 77 933.9 | 128 931.3 |
| Senegal | 1263 | 4260.3 |
| Sierra Leone | 252.9 | 1626 |
| Togo | 1214 | 4266.8 |
aThe electricity demand between the two scenarios is the same, but the generation mix is different as an outcome of the GEP [32].
A.3. Policies
In the new policies and renewable deployment scenarios, the objective is to examine different universal access scenarios by extrapolating the current energy situation into the future and providing energy transition pathways on a national, regional and African level. The scenarios consider only the national renewable policies (supplementary material A) extracted from the national policy plans of each African country and future investments in power plants and interconnectors, which are in force until 2017, without considering new policies such as National Determined Contributions [4]. The NDCs of all countries were collected and analyzed in this study. Still, they could not be incorporated here since each government's greenhouse gas emission limits are not only related to the energy sector. However, the outcomes of this analysis can be used to inform each country's NDCs.