
Abstract
We have fabricated a solid-state gas sensor using a composite sensor layer made up of three different sensing materials namely; candle soot Carbon nanoparticles, Titanium dioxide and Poly (vinyl) pyrrolidone (PVP). The study was carried out to study the sensor's response towards butyraldehyde, diethylamine and isobutyrophenone vapour at room temperature. The sensor was prepared by mixing candle soot CNPs, TiO2 and PVP in dimethylformamide using the ratio (2:1:3) respectively. The sensing materials were characterised using Brunauer–Emmett–Teller (BET), x-ray diffraction (XRD), Transmission and Scanning Electron Microscopy (TEM, SEM). The sensor's response was measured by injecting a volume of 1 to 5 μl of each liquid analyte in a round-bottomed glass and an LCR metre was used to measure the ∆R and ∆Z responses. In both parameters, the sensor responded well to the different analytes, the response of the sensor linearly increases as the analyte vapour concentration increases. The sensors were discovered to exhibit more sensitivity of 0.07 Ω ppm−1 towards diethylamine in ∆R response and it was more sensitive towards isobutyrophenone in ∆Z response giving a sensitivity of 0.14 Ω ppm−1 while Butyraldehyde had the fastest response time of 145 s and Diethylamine had the fasted recovery time 130 s.
Export citation and abstract BibTeX RIS

Original content from this work may be used under the terms of the Creative Commons Attribution 4.0 licence. Any further distribution of this work must maintain attribution to the author(s) and the title of the work, journal citation and DOI.
1. Introduction
Solid-state gas sensors have been receiving a lot of attention both in theoretical studies and experimental research, this gas sensing phenomenon which focused on the electrical conductivity of nano-materials for gas detection was initially proposed in the early 1960 s using zinc oxide-based sensor [1]. Looking at the constantly increasing need for detecting hazardous gases, solid-state gas sensors have been applicable in a variety of fields such as medical and pharmaceutical industries, indoor air quality control and industrial environments [2, 3]. These types of gas sensors are based on semiconducting metal oxides (SMOs) and polymer composites [3], however, the inclusion of carbonaceous nanomaterials such as carbon nanotubes (CNTs), carbon nanofibers (CNFs) and carbon nanoparticles (CNPs) have been actively reported in sensing experiments and novel applications in the last two decades [4]. Solid-state gas sensors are expected to exhibit characteristics such as affordability, portability, low power consumption, stability, sensitivity, reversibility, fast response-recovery time and safety [2–5].
Graphene and CNTs have been overly studied [6] while new forms of carbon materials from unique sources are given little attention. One interesting source of carbon nanomaterial is candle wax [7], it generates soot which has highly pure spherical zero-dimension (0D) CNPs which are fractal-like interconnected porous nanostructures produced via incomplete combustion [7]. These CNPs have desired morphology and characteristics acquired for a gas sensor, they are easily synthesized and highly economical for a nano-level material [6, 7].
Candle waxes are rich in hydrocarbons which are derived from crude oil-based paraffin wax, they produce CNPs ranging from C16 to C30 with particle size ranging from 35 to 50 nm [6]. Parameters that play a major role in acquiring candle soot CNPs are; wax composition, flame temperature, flame height and substrate material [8] and while collecting candle soot CNPs is considered an easy process, these particles are fragile as they form a network via weak Van der Waals interactions [6, 8]. CNPs properties have drawn a lot of attention in recent application studies due to their high surface area, porous nature [7], electrical conductivity [7], biocompatibility, low toxicity [9], small size and chemical properties [10]. These characteristics have made them a reliable material in electrochemical supercapacitors [7], solar cells, batteries [7], gas sensors [11, 12] and pressure sensors [13].
Candle soot CNPs have been proven to enhance the overall sensing, it has been used in a composite together with manganese dioxide and PVP to form CNPs:MnO2:PVP composite to detect ethanol and methanol [11]. The synthesis method for candle soot is simple and in a short period can produce large quantity of carbon nanomaterials as compare to other methods such as a furnace. Their presence in a composite has been reported [10, 11] to result in a highly porous composite with an enlarged surface area and an increased electrical conductivity. Candle soot CNPs are yet to be studied with a variety of SMOs and polymers in solid-state gas sensing, therefore in this study, we incorporated titanium dioxide (TiO2) and PVP as two additional components to the solid-state gas sensing composite.
TiO2 is amongst the most widely used n-type SMOs in gas sensing, this group of SMOs are reported to be superior in gas sensing as opposed to the p-type SMOs [3, 14, 15]. TiO2 occurs in various forms such as nanoparticles, nanotube, nanorods, nanowires and nanoflowers [16, 17]. It also exists in three different phases which are anatase, rutile and brookite, however, anatase and rutile are the most used phases in solid-state gas sensing. The rutile phase is stable at high temperatures and the anatase phase is stable at room temperature [16] while exhibiting a higher photocatalytic behaviour[18]. TiO2 is non-toxic, affordable and its increased popularity is due to its chemical inertness, high abundance and photo-stability [14, 19]. It has excellent properties required for a good sensing material, however, Hongyu et al, [14] reported that pristine TiO2 has an increased number of surface defects and low carrier mobility. Interestingly Sabri et al, [19] also reported that TiO2 lacks sensitivity compared to other SMOs and to overcome these drawbacks modification needs to take place to increase the specific surface area of the sensing material. Candle soot CNPs have been reported to have high specific area thus directly overwriting TiO2 drawbacks and potentially improving sensitivity, catalytic activity and increasing the number of active sites while polymers such as PVP increases stability [20]. Although TiO2 has excellent properties due to its nano nature, nano/microstructured metal oxides have been reported as good sensing materials. Delaunay et al carried out an interesting study where 3D-ZnO tetrapods were synthesized and able to detect Ethanol as low as 0.5 ppm at 400 °C [21].
PVP is a non-conducting polymer that acts as a surfactant to nanocomposites; although it is rarely used in solid-state gas sensing, it is highly soluble in polar solvents, it is environmentally safe, biocompatible and thermally stable [22, 23]. PVP is advantageous as it can stabilize the morphology of nanostructured materials [24] and it has been reported to enhance the porosity of TiO2 [23]. Recently, PVP has been used in sensing composites for methanol [11], ethanol [11, 25] and hydrogen [26] and it is reported to be highly sensitive towards H2S, ammonia and aliphatic amines [24, 26]. This polymer acts as a hydrogen bond acceptor from the carboxyl group and nitrogen site and this aspect is presumed to be responsible for its gas sensing mechanism [24, 26].
Three types of organic compounds of interest in this study are aldehyde, amine and ketone in nature. Aldehydes play a major role in both biological, environmental and industrial systems; they occur naturally in fruits, vegetables and plants [27]. An aldehyde of interest is butyraldehyde, it is highly flammable and causes health complications with prolonged exposure [28]. Amines are naturally occurring organic compounds; they are widely employed in pharmaceuticals, pesticides and food industries [29, 30]. The amine of interest in this study was diethylamine; it is flammable and has a fish-ammonia-like smell. Prolonged exposure to diethylamine can lead to skin inflammation and nasal irritation with the potential to cause animal death [31]. Ketones, also known as ketone bodies, are naturally available in the human body as they are responsible for circulating energy during starvation or excessive exercise. A rare type of ketone that was included as one of the analytes here is isobutyrophenone [32].
This study focused on the sensor's sensitivity towards the three analytes and the adsorption-desorption principal using resistance and impedance. The sensing pattern behaviour of the composite was also investigated as it has been reported that n-type SMOs show an increase in resistance when an analyte is an oxidising gas but when the analyte is a reducing gas the resistance behaves oppositely [33, 34].
2. Materials and methodology
2.1. Materials
Titanium (iv) dioxide anatase nano-powder (TiO2), N,N-Dimethylformamide (DMF) and Poly (vinylpyrrolidone) (PVP) were purchased from Sigma-Aldrich (South Africa) and white candles (Light House candles) were purchased from a local store in Johannesburg, South Africa.
2.2. Methodology
2.2.1. Collection of candle soot CNPs
Collection of candle soot CNPs was carried out under a fume hood as a safety measure. A retort stand with a clamp was placed under the fume hood, a lab jack was used to mount a burning candle and a ceramic dish clamped at about 1 cm above the candle flame. As the candle was burning, soot was deposited inside the ceramic dish. The candle soot was then scraped off from the inside of the ceramic dish using a clean spatula, the soot was washed using a centrifuge at 1200 rpm for 15 min with ethanol several times and then the sample was dried and stored in a clean vial.
2.2.2. Preparation of nanocomposite sensor
Amounts of 20 mg of candle soot CNPs, 10 mg of TiO2 and 30 mg of PVP were transferred into a clean vial to which 10 ml of DMF was added resulting in a composite ratio of 2:1:3. The mixture was sonicated for 30 min and stirred for 24 h to obtain a composite free of aggregates. A gold-plated interdigitated electrode composed of 0.1 mm width and 0.1 mm gap between metal lines of 18 pairs of 7.9 mm length was used as an electrode. An amount of 20 μl of the composite was drop casted on the surface of the electrode and left to air dry and placed under vacuum in a desiccator for 48 h to expel the DMF from the composite.
2.2.3. Characterization of nano-materials
X-ray diffraction (XRD) analysis was used to determine the crystallographic structure of candle soot CNPs, TiO2 and the composite (CNPs:TiO2:PVP) using Powder XRD (PXRD) model: (Bruker D2 Phaser PXRD) which used Co-Kα irradiation and makes use of a 30 kV x-ray tube at the current of 30 mA over a 10 ≤ 2θ ≤ 90° range and a scan period of 20 min. The composition of soot CNPs and TiO2 was analysed using Raman spectroscopy, model: alpha 300R (WITec), confocal laser Raman microscope configured with a frequency-doubled Nd:YAG laser (wavelength 532 nm). The pore size, pore volume as well as surface area of soot CNPs, TiO2 and CNPs:TiO2: PVP composite were measured using Brunauer–Emmett–Teller (BET), model: (Micrometrics ASAP 2020, Japan). The samples were degassed under nitrogen flow for 12 h at 120 °C and analysed using nitrogen. The structural morphology and properties of the CNPs, TiO2 and the composite were determined using Transmission Electron Microscope, model: (JEM—2100F, JEOL, Japan) at an accelerating voltage of 200 kV with the samples drop casted on a copper-coated grid. The surface analysis of the samples was analysed using a Scanning Electron Microscope, model: (TESCAN VEGA, Czech Republic) at 20 kV which is equipped with energy-dispersive x-ray spectroscopy (EDS/EDX).
2.2.4. The set-up of gas sensing system featuring an LCR meter
Studying the fabricated sensor entailed setting up a gas sensing system with a high precision LCR meter, model: (KEYSIGHT E4980AL) with AC input signal (amplitude: 0.5 V; frequency: 25 kHz), a computer, 20 L multi-neck round bottom flask and a vacuum pump [11]. The LCR meter was connected to the computer for data display and the fabricated sensor using two insulated wires to measure the response signals during sensing. The sensor converts the chemical reaction between the analyte and the composite into an electrical response, this response is then converted into readable data by the LCR which is displayed on the PC.
The sensor was then placed inside an enclosed 20 l round bottom flask via one of the openings as illustrated in figure 1. A second opening was connected to a vacuum pump by a tube to flush out the analyte after exposure and to pump in fresh air into the camber. However, sensing performance was conducted under one bar atmospheric pressure and 42% RH. Each analyte (butyraldehyde, diethylamine and isobutyrophenone) was tested separately using volumes 1, 2, 3, 4 and 5 μl. To begin, 1 μl of an analyte was injected inside the flask and left for 10 min of exposure time. Thereafter the remaining analyte gas was flushed out using the vacuum pump for 4 min and the sensor was left to recover for 1 min. The procedure was repeated up to 5 μl analyte. Isobutyrophenone was tested using similar volumes but the exposure time was increased to 12 min, the analyte was flushed for 4 min. and the sensor was left to recover for 2 min. This is due to the higher boiling point of isobutyrophenone which is three times higher than diethylamine and two times higher than butyraldehyde.

Figure 1. Schematic diagram illustrating the gas sensing set-up system with LCR meter (KEYSIGHT E4980AL).
Download figure:
Standard image High-resolution imageThe concentration of the injection of each analyte was calculated in parts per million (ppm) using equation (1) below [35]

where C is the concentration of the analyte at room temperature in (ppm), ρ is the density of the liquid analyte in (g/mL−1), T is the testing temperature in (K), versus is the volume of liquid analyte in (μl), M is the molecular weight of the analyte in (g/mol−1), V is the volume of the round bottom flask in (L).
The responses were reported as variations of resistance:


where RVOCs is the resistance of the sensor with VOCs (volatile organic compounds) and Rair is the resistance of the sensor without VOCs [36].
3. Results and discussion
3.1. Powder x-ray diffraction analysis
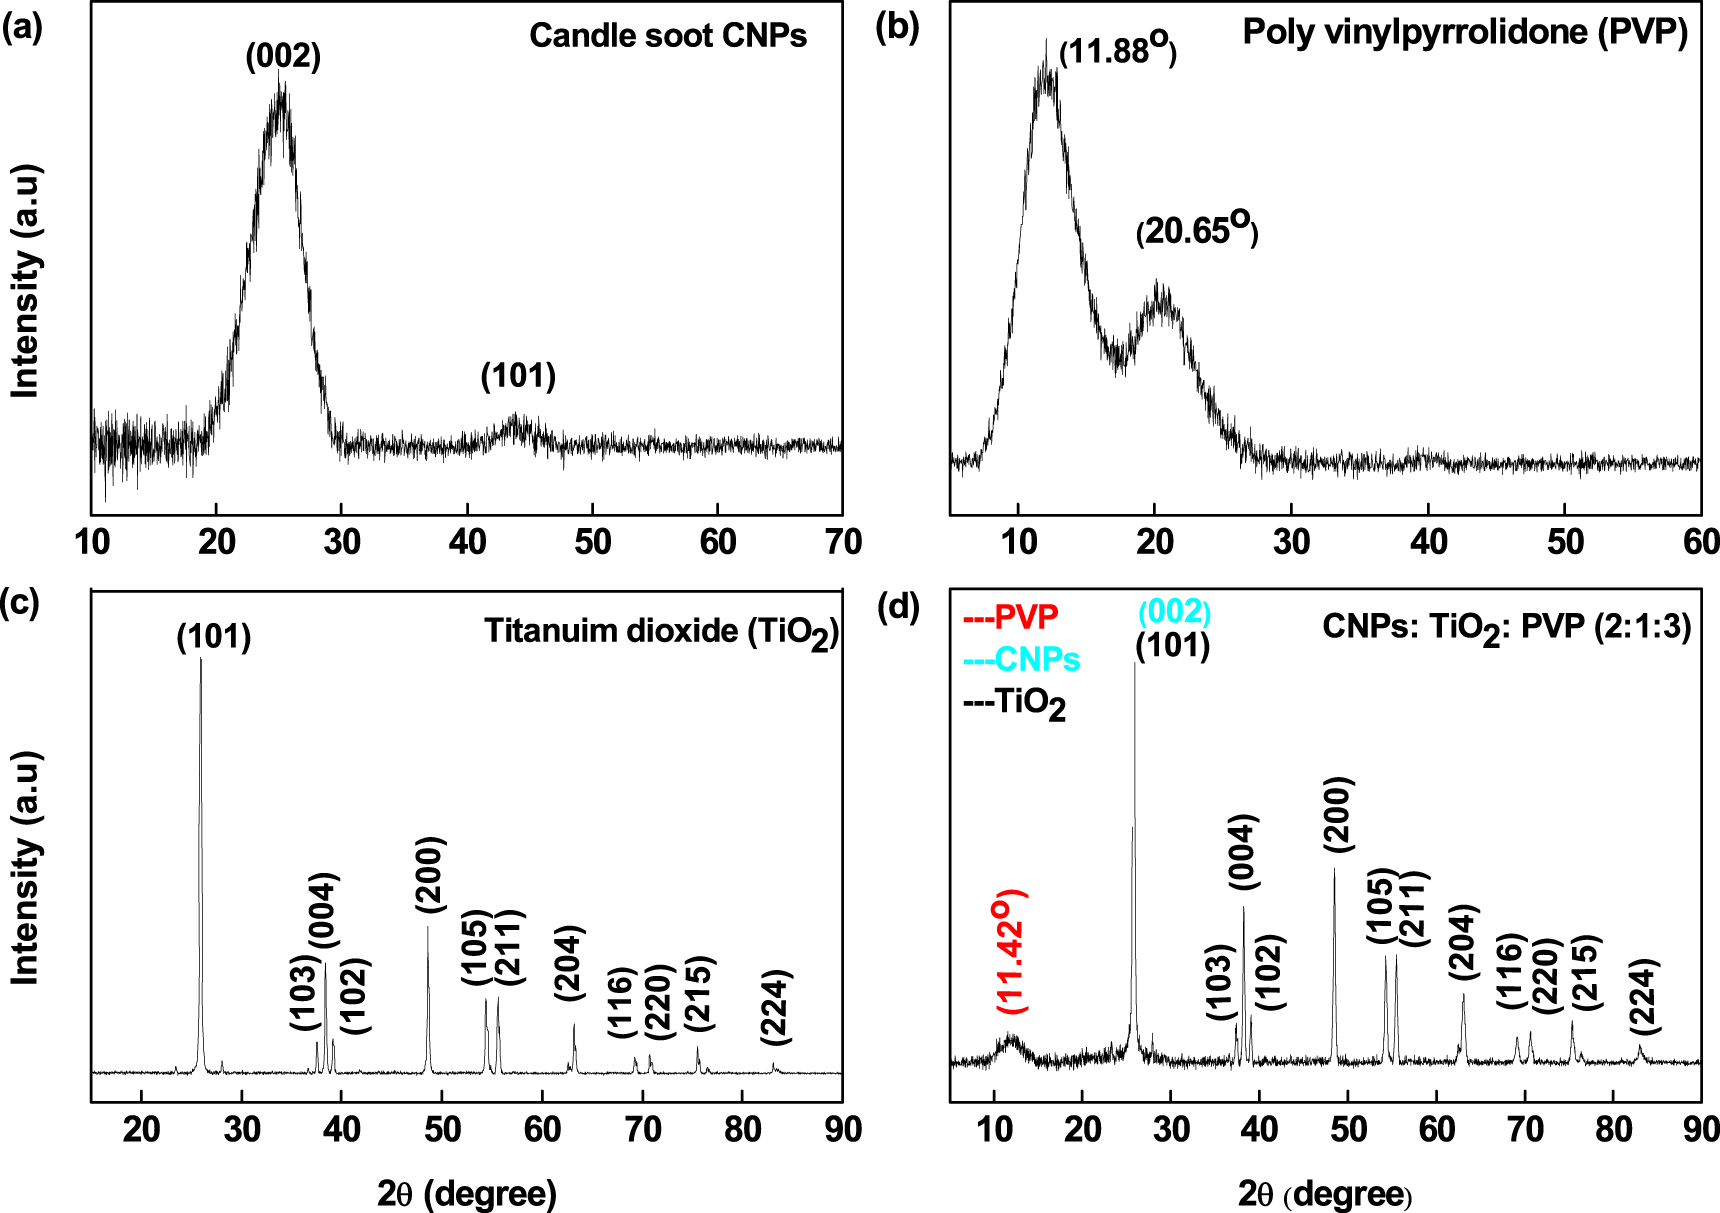
Figure 2 shows XRD spectra of the individually prepared components and the nano-composite material used in the fabrication of the solid-state sensor. The XRD spectrum of pure candle soot CNPs (figure 2(a)) exhibited two Bragg diffraction peaks; the first peak was observed at 2Θ value 25.21° which was a high-intensity broad peak and the second peak which was a lower intensity peak was observed at 2Θ value 44.06°. The high-intensity value corresponds to the (002) plane representing graphite as well as amorphous carbons [36, 37]. The lower intensity value corresponds to the (101) plane representing the crystalline graphitic carbon structure of CNPs or the diamond phase on the soot [38, 39].

Figure 2. PXRD diagrams representing (a) candle soot carbon nanoparticles, (b) PVP, (c) TiO2 and the composite (CNPs: TiO2: PVP).
Download figure:
Standard image High-resolution imageFigure 2(b) shows the two XRD peaks of PVP, one being a high-intensity broad peak and a low-intensity broad peak at 2Θ 11.88° and 2Θ 20.65° respectively, representing the polymer's amorphous nature [40, 41]. Diffraction peaks of pure commercial TiO2 (figure 2(c)) were observed at 2Θ values 25.91°, 37.41°, 38.44°, 39.20°, 48.82°, 54.54°, 55.47°, 63.12°, 69.09°,70.80°, 75.45° and 83.33°; they are assigned to planes (101), (103), (004), (102), (200), (105), (211), (204), (116), (220), (215) and (224) respectively, denoting an anatase phase with no impurities and secondary phases [40, 42, 43]. As reported, [16] anatase phase TiO2 enhances the sensor's performance at room temperature. The diffraction pattern of the composite is shown in figure 2(d). It is clear that all the TiO2 peaks are visible, one of the two peaks of CNPs and PVP were also displayed on the graph and confirming that all materials were present in the composite used to fabricate the solid-state sensor.
3.2. Raman spectroscopy analysis
The Raman spectrum of candle soot CNPs presented in figure 3(a) shows two standard carbon characteristic peaks which are very distinct, one of which is the disordered graphitic phase (D band) at 1352 cm−1 that represents amorphous carbons. The second peak which is the G band at 1598 cm−1 denotes crystalline graphitic carbons, confirming the results from the PXRD pattern (See figure 2(a)). The intensity ratio of the bands (ID/IG) which expounds the defects present in carbon material was found to be 0.85 [36, 38, 44]. Figure 3(b) shows the Raman spectrum of six active modes for anatase TiO2, 3Eg (147, 197 and 640 cm−1), 2B1g (397 and 517 cm−1) and 1A1g (517 cm−1). The symmetrical stretching of O-Ti-O is represented by EG vibrational mode at 147 cm−1 and the peak is very strong and intense while the rest of the peaks represents a highly crystalline anatase TiO2 phase. The peaks correspond to previously reported findings [45, 46].

Figure 3. Raman spectra for (a) candle soot CNPs and (b) TiO2.
Download figure:
Standard image High-resolution image3.3. Brunauer–Emmett–Teller (BET) analysis
BET analysis is an important aspect of sensing materials since the basics of the sensing mechanism involving the adsorption-desorption flow of the analyte gas. This experiment took interest in the pore volume (cm3 g−1) and pore size (nm) (Table 1) which affects the diffusion rate, the analyte molecule and the sieving properties. The surface area (m2 g−1) of the materials was also determined as it affects the dissolution rate and adsorption capacity. Candle soot CNPs showed a pore volume of 0.58 cm3 g−1 , a pore size of 21.73 nm and a surface area of 125.3 m2g−1. The pore volume and surface area are higher than the previously reported pore volume of 0.29 cm3g−1 [44] and a surface area of 53.2 m2g−1 [8] and 62.18 m2g−1 [11].
Table 1. BET analysis data showing the pore volume, pore size and surface area.
| Material | Pore volume (cm3 g−1) | Pore size (nm) | Surface area (m2 g−1) |
|---|---|---|---|
| Candle soot CNPs | 0.58 | 21.73 | 125.3 |
| TiO2 | 0.19 | 16.5 | 46.5 |
| CNPs: TiO2: PVP | 00016 | 11.71 | 0.58 |
A decrease in the pore volume, pore size and the surface area were evident after forming the composite.
The TiO2 showed a pore volume of 0.19 cm3g−1, a pore size of 16.5 nm and a surface area of 46.5 m2g−1.
3.4. Transmission electron microscopy
Figure 4 shows the TEM images of the materials which give insight into their morphological properties. The image in figure 4(a) reveals the particles' fractal-like network nature and their uniform spherical structure. The spherical particles are infused with one another forming a branched-like structure which may result from diffusive bonding or diffusive adhesion between each particle thus increasing their mechanical stability [47]. The particle size ranges from 40 nm to 65 nm with an average of 52 nm denoting their smaller size characteristic. Figure 4(b) further shows the particles at a higher magnification which clearly shows fringes with a lattice spacing of 0.42 nm.

Figure 4. TEM images of (a)–(b) candle soot carbon nanoparticles, (c)–(d) TiO2 and (e) the composite.
Download figure:
Standard image High-resolution imageFigure 4(c) showed the image of anatase TiO2, the structures were very clear and pristine nanoparticles with a distinct variety of sizes and shapes. The size of the particles ranged from 34 nm to 74 nm, the two different shapes that the particles had were spherical and other particles had a heptagon-oval shape. Unlike other nanoparticles, hydrothermally synthesized anatase TiO2 has been reported to take on a lot more different hierarchical structures depending on the temperatures and precursor material used [48]. Figure 4(d) shows the visible lattice fringes with a lattice spacing of 1.10 nm and figure 4(e) shows the TEM image of the composite, the agglomerated spherical candle soot CNPs, as well as the TiO2 particles, are visible.
3.5. Scanning Electron Microscopy
Figure 5(a) shows the surface morphology of candle soot CNPs which appears as clustered structures, their morphological characteristics are not clear as the magnification of the SEM was low but aggregates are visible. The sample surface composition is displayed in figure 5(b) which shows that 92.9% of the sample composition was carbon and 7.1% was oxygen atoms which are combustion products of the candle wax flame. Figure 5(c) shows the surface morphology of TiO2 which appears as mesh-like structures with pores and the EDS displayed the samples composition of 68.1% titanium and 31.9% oxygen atoms denoting pristine TiO2.

Figure 5. SEM images showing the surface morphology of ((a),(c)) candle soot CNPs and TiO2 and ((b),(d)) their corresponding EDS spectra.
Download figure:
Standard image High-resolution image3.6. Gas sensor performance using LCR metre.
Unlike other conventional studied solid-state gas sensors which are fabricated using one or two n-type SMOs or carbon material and n-type SMOs as a sensing material, this study used carbon material (CNPs), n-type SMO (TiO2) and a polymer (PVP) to investigate the sensor performance. The reason candle soot CNPs and TiO2 were used lies in their high surface area, their electrical conductivity as well as their novelty in gas sensing application [10]. SMOs are mostly used in gas sensing due to their high carrier mobility, conductivity and stress tolerance [49]. TiO2 like other metal oxides has exhibited excellent properties in sensing application due to their polymorphic behaviour, stability and it is preferred to be used in chemi-resistive gas sensors which entails an efficient adsorption-desorption mechanism of reducing and oxidizing agents [49].
Here, three different vapour analytes with different organic functional groups, aldehyde (butyraldehyde), amine diethylamine) and ketone (isobutyrophenone) were studied for their response to the fabricated solid-state gas sensor. The vapour concentration was in the range of 8 ppm −68 ppm depending on the density of the analytes. The relative resistance (∆R) and impedance (∆Z) parameters were used for all three analytes to quantify the response against the vapour concentration (ppm).
In both parameters, the sensor responded well and increased as the analyte vapour concentration increased (see figures 6 and 7). As the analyte vapour interacts with the sensor's active layer, the responses of the sensor sharply increased and returned to the baseline when the analyte vapour was removed from the vessel (figure 6). This can be explained by the diffusion of analyte molecules through the exposed sensing material to occupy the free active sites. During this time the electrical property of the sensing material changes and is recorded as an increase in resistance (in this study) until most of the active sites are occupied. When the unreacted vapour molecules were removed from the vessel, by use of a diaphragm vacuum pump, the active sites became unoccupied and the sensor regenerated itself with oxygen species.

Figure 6. ∆R response for ((a) and (b)) Butyraldehyde, ((c) and (d)) Diethylamine and ((e) and (f)) Isobutyrophenone as a function against concentration in ppm.
Download figure:
Standard image High-resolution image
Figure 7. ∆Z response for ((a) and (b)) Butyraldehyde, ((c) and (d)) Diethylamine and ((e) and (f)) Isobutyrophenone as a function against concentration in ppm.
Download figure:
Standard image High-resolution imageThe increase in relative resistance response (∆R) of the three analytes vapour as the concentration increases indicates a linear relationship where the ∆R response is directly proportional to the concentration (figures 6(b), (d) and (f)). Although the three analytes behaved in the same manner, only the response for butyraldehyde vapour demonstrated plateaus for the first three injections (figure 6(a)).
Generally, for the butyraldehyde and diethylamine vapour, the ∆R responses were better than isobutyrophenone. The response peaks for isobutyrophenone are sharp triangle-shaped rather than a flat top bell-shaped curve. This might be due to the very low vapour pressure of 0.11 mm Hg at 25 °C of isobutyrophenone as compared to that of butyraldehyde and diethylamine, 111 mm and 237 mm Hg at 25 °C, respectively. An analyte with low vapour pressure usually has a low vapour diffusion rate which slows the analyte vapour interaction with the sensing materials resulting in longer response times than analytes with high vapour pressure.
A similar relationship between the concentration of the vapour analytes and ∆Z response was observed except for the isobutyrophenone (figure 7) where a linear relationship was observed only at low concentrations (See figure 7f inset). Generally, as the concentration increased the relative response in ∆Z increased. Also, similarly to the ∆R response, the ∆Z responses from butyraldehyde and the diethylamine vapour showed some form of bell-shaped curves, while the response curve for isobutyrophenone vapour was a sharp triangle-shape.
3.7. The sensor's sensitivity towards the analytes
Although the three analytes respond to the solid-state sensor similarly for a single measurement parameter, the sensitivity of the sensor towards the analytes for relative resistance and relative impedance varies. The sensitivity of the sensor is considered the gradient of the curve,  and
and  for relative resistance and impedance, respectively. For ∆R response, the sensor's sensitivity towards butyraldehyde, diethylamine and isobutyrophenone vapours were 0.04, 0.07 and 0.03 Ω ppm−1, respectively (See table 2). The sensor was twice more sensitive toward diethylamine vapour followed by butyraldehyde and isobutyrophenone. In the case of the impedance parameter, the sensitivity of the sensor is different from the relative resistance parameter; the sensor was three times more sensitive towards butyraldehyde vapour than diethylamine vapour. An interesting observation is that it is possible to use the same sensor to distinguish between two analytes vapour simply by changing the parameters from resistance to impedance and vice versa.
Table 2. Sensitivity of Butyraldehyde, Diethylamine, Isobutyrophenone and response-recovery time in seconds.
| Analyte at 2 μl | Resistance (Ω ppm−1) (Ω ppm−1) | Impedance (Ω ppm−1) (Ω ppm−1) | Response time(s) | Recovery time(s) |
|---|---|---|---|---|
| Butyraldehyde | 0.04 | 0.14 | 145 | 132 |
| Diethylamine | 0.07 | 0.04 | 193 | 130 |
| Isobutyrophenone | 0.03 | 0.20 a | 407 | 187 |
3.8. Response-recovery time
The response and recovery time of all the three analytes were determined from ∆R parameter and injection volume of 2 μl. The response time is defined as the time required for the sensor to reach 90% of the maximum response of the signal measured when exposed to the target analyte vapour. The time required for the sensor to recover 90% from its maximum response upon the removal of the target analyte vapour is considered as the actual recovery time. Accordingly, as table 2 shows, butyraldehyde had the fastest response time of 145 s followed by diethylamine with 193 s and finally isobutyrophenone with 407 s. The slowest response time for the isobutyrophenone vapour might be due to the lowest vapour pressure of 0.11 mm Hg at 25 °C as compared with the other two as discussed earlier. Another factor that may have led to its slower response could be attributed to a slow diffusion rate through the thin film sensing materials. This is due to the size of the isobutyrophenone as a result of its bulky structure that contains a benzene ring. A similar outcome is seen in recovery time, where isobutyrophenone showed a longer recovery time and the diethylamine was only 2 s quicker with 130 s than the butyraldehyde with 132 s. A typical response and recovery time graph is shown in (figure 8) using 2 μl (26.91) of butyraldehyde.

Figure 8. Time dependant ∆R response for 2 μl (26.91 ppm) butyraldehyde.
Download figure:
Standard image High-resolution image
3.9. Sensing mechanism
The basic adsorption-desorption process of the analyte vapour molecules on the surface of the sensing materials determines the type of sensing mechanism of a sensor [50]. The analyte molecules need to diffuse through the sensing materials then interact with adsorbed oxygen species on the sensing materials. The rate of adsorption and desorption of oxygen species on the surface of n-type and p-type SMOs results in the change in response [51].
When an n-type SMO is exposed to air, oxygen molecules from the air are adsorbed on the surface of the SMO and occupy the previously formed oxygen vacancies by taking electrons from the SMO conduction band. This results in the generation of different negatively charged oxygen species (O2 −, O−, and O2−) on the surface of the SMO and the formation of an electron depletion layer (EDL) which forces the conduction band to bend upwards and the Fermi level to move down [52]. Analyte molecules react with the adsorbed oxygen species thus promoting oxidation to form CO2 and H2O, the electrons are then released back into the conduction band and as a result, the EDL shrinks, creating oxygen vacancies, Fermi level and the conduction band re-bounce back to normal. This leads to a decrease in resistance for the n-type SMOs. With a p-type SMO, the oxygen adsorption model is still applicable after the SMO is exposed to air. However, instead of forming an EDL, it forms a hole accumulation layer which results in a decrease in electrical resistance and during an interaction of the negatively charged oxygen species with a gas in a redox reaction, an increase in resistance occurs [53, 54].
The sensing materials synthesised in this study were composed of TiO2, CNPs and PVP, of which the oxygen reactive species can be found on the surface of both TiO2 and CNPs. According to the EDS result, the CNTs are composed of 7% oxygen and 93% carbon atoms (See figure 5(b)). Since those oxygen atoms on the surface of the CNPs can transform into reacting oxygen species (O2 −, O−, and O2−), they are responsible for the total decomposition of VOCs [11, 12]. Although one of the sensing materials in the fabricated solid-state sensor is an n-type SMO, we observed that the sensor performed as a p-type sensor for all three VOCs [11, 12], 54].
Mani et al, [55] proposed that the sensing mechanism of nanostructured ZnO:Co thin film for ammonia vapour liberated N2 and H2O molecules. In a separate study by Calestani et al, [56], a high conductance change for similar concentrations (ppb) of propionaldehyde (or propanal) and acetaldehyde (or ethanal) was observed using zinc oxide (ZnO) tetrapods based gas sensor. They proposed that the propionaldehyde molecule was completely oxidized to CO2 and H2O molecules and as a result higher number of electrons were transferred to the ZnO. Similarly, Kim et al, [57] revealed that by optimizing Pt- and Pd-functionalized ZnO nanowires (NW) gas sensors, they could selectively detect toluene and benzene gases, respectively. The sensing mechanism is also explained based on the reaction between the volatile gas molecules adsorbed onto the surface of the sensor and the highly reactive oxygen species, which liberates CO2 and H2O.
Therefore, the sensing mechanism of the solid-state gas sensor designed in this study for each of the three analytes was summarized as follows:
For the Diethylamine:

For the Butyraldehyde:

For the Isobutyrophenone

Table 3 shows the ∆R of the sensor at 25 ppm of the three vapour analytes. Interestingly, the sensor resistance for the diethylamine and isobutyrophenone interaction was 2.9 and 2.5 Ω, respectively. However, for butyraldehyde vapour, the sensor's resistance was lower than the two analytes which were less than half of Isobutyrophenone, 1.1 Ω. This change in the sensor's resistance can be explained from the point of the hole accumulation layer theory. During sensing, the sensor's resistance increased as the concentration of the analytes increase, such characteristic is a p-type sensor behaviour (See figures 6 and 7). Therefore, our sensing materials captured electrons to form absorbed oxygen species and hole accumulation layers. The interaction between analytes vapour and the charged oxygen species from the surface of the sensing materials led to the oxidation of analyte vapour by the negatively charged oxygen species thus generating electrons that reduce the hole concentration in the shell layer which results in an increase in the resistance.
Table 3. The resistance of the sensor at 25 ppm as the vapour interacts with the sensing materials.
| Analyte | R (Ω) |
|---|---|
| Butyraldehyde | 1.1 |
| Diethylamine | 2.9 |
| Isobutyrophenone | 2.5 |
Interestingly, if we look at the decomposition reactions equation for diethylamine and isobutyrophenone, higher numbers of electrons were transferred to the sensing materials. However, for butyraldehyde vapour, it was less than half of the Isobutyrophenone, only 12e- were transferred to the sensing materials [56]. This makes it consistent with the relative resistance of the sensor and the electron injection back to the sensing materials.
4. Conclusion
This study presents the successful fabrication of a sensor with a sensing layer composed of candle soot CNPs, TiO2 and PVP and confirms the sensor performance using two parameters, relative resistance and impedance. The candle soot CNPs showed highly uniform spherical structures and TiO2 showed pure nanoparticles and both materials exhibited good crystallinity with a relatively high surface area which denotes good sensing characteristics. The sensor was able to detect all the analytes in different concentrations at room temperature where diethylamine was more sensitive in ∆R response and had the fastest recovery time. The Isobutyrophenone was more sensitive in ∆Z response at low concentration while butyraldehyde has the fastest response time. The study provides a different approach in the usage of sensing materials, giving a pathway to using a variation of multiple nanomaterials as a single sensing layer and parameters to provide better performance that enables sensors to operate at room temperature. We observed an increase in the sensor resistance as the analyte vapour interacts with the sensing materials due to a reduced hole concentration, this is characteristic of a p-type sensor.
Acknowledgments
The authors are grateful to DSI-NRF Centre of Excellence in Strong Materials (CoE-SM) for the financial support and Centre for Nanomaterials Science Research and the University of Johannesburg and finally, we have no conflicts of interest to disclose.
Data availability statement
All data that support the findings of this study are included within the article (and any supplementary files).
Author contributions
The manuscript was written through the contributions of all authors. All authors have approved the final version of the manuscript. All authors contributed equally.