
Abstract
Exploring new materials and synthesis recipes are required to enhance the electrochromic performance especially, when used in solid-state devices. Here, polycrystalline gadolinium titanate (Gd2TiO5 or GTO), synthesized using a simple solid-state reaction method, has been used for this purpose by combining it with polythiophene (P3HT). The electrochemical investigation of the Gd2TiO5 doped P3HT electrode has been carried out using cyclic voltammetry (CV) and electrochemical impedance spectroscopy (EIS), which reveals the dominance of diffusion-controlled mechanism over charge storage on the electrode surface as compared to the P3HT electrode. The Gd2TiO5 doped P3HT solid-state electrochromic device shows color modulation at 515 nm and 670 nm wavelengths with a color contrast of as high as 79% and 42%, respectively, under an external bias of as low as ±1.4 V. The prepared device switches between maroon to a transparent state in less than a second under the external bias (±1.4 V) with a high coloration efficiency of 346 cm2/C. The device shows improved cycle life over 100 switching cycles at both the wavelengths, which makes it more suitable for real-life applications.
Export citation and abstract BibTeX RIS

Original content from this work may be used under the terms of the Creative Commons Attribution 4.0 licence. Any further distribution of this work must maintain attribution to the author(s) and the title of the work, journal citation and DOI.
Introduction
Electrochromic devices have attracted massive attention due to their ability to modulate optical properties under the application of external bias [1, 2] and its substantial application in smart windows [3, 4], sensors [5, 6], charge storage indicators [7, 8], energy-efficient buildings [9, 10], and automobile industry [11], etc. Various electrochromic materials have been discovered over the past few decades, broadly categorized as organic materials [12], inorganic materials [13], organometallics [14], metal–organic frameworks (MOFs) [15], polymers [16], and metal complexes [17]. The polymers and derivatives (poly3-hexylthiophene (P3HT) [18], polyaniline [19], polyindole [20], and polypyrrole [21], etc) prove to be advantageous in terms of easy synthesis, flexibility, and low cost over the inorganic materials due to their rapid electrochemical reactions, whereas inorganic materials (WO3 [22], TiO2 [13], NiO [23], Co3O4 [24], V2O5 [25], and MoO3 [26], etc) proves to be advantageous in terms of their robust and high cyclic stability nature over the organic materials. Amongst all, P3HT is one of the most discussed polymers due to its vast applications in solar cells [27], electrochromism [28, 29], supercapacitors [30, 31], and memory devices [32]. Several efforts have been attempted to enhance the electrochromic performance of P3HT to make it more suitable for real-life practical application. However, the performance is mainly limited due to insufficient supporting material to diffuse more electrolyte ions into the electrode surface, enabling color-switching. Hence, new paradigms are required to enhance the diffusion mechanism in solid-state electrochromic devices.
The cyclic stability of polymer (P3HT) based solid-state electrochromic devices is compromised due to the incomplete redox activity as compared to liquid-based electrochromic devices [33]. Thus, appropriately designed diffusion-dominated electroactive materials can be doped in solid-state electrochromic devices to facilitate the diffusion mechanism over the electrode surface to complete the incomplete redox reactions and can be utilized if they are electrochemically inactive [18, 34]. The addition of diffusion-dominated electroactive materials will enhance the cyclic stability and increase the device's efficiency as less charge is stored over the electrode surface. Perovskite materials are known for their diffusion dominance property and can be further explored for this purpose by appropriately designing a device [35]. The lanthanide titanates [36–38] of composition Ln2TiO5 (Ln = Lanthanide) exhibit various exciting properties of high dielectric constant [39] and thermal stability [40]. As Ln2TiO5 is known to show applicable dielectric properties, this motivates us to analyze the doping effect of diffusion-controlled electroactive materials on the performance of the solid-state electrochromic device.
In this article, gadolinium titanate (GTO), a diffusion-controlled electrochemical material, has been exploited to enhance the electrochromic performance of the GTO_P3HT-based solid-state electrochromic device. The GTO was synthesized using the solid-state reaction route and characterized using scanning electron microscopy (SEM), XRD, and Raman spectroscopy before being utilized it as dopant in the P3HT layer. Prior to use in device fabrication, the GTO_P3HT layer was studied using cyclic voltammetry and electrochemical impedance spectroscopy to confirm the dominance of diffusion-controlled mechanisms over charge storage at the electrode surface, and it has been used to fabricate the solid-state electrochromic device. The GTO doping in P3HT-based electrochromic device reveals the overall enhancement of electrochromic performance with as high as color contrast of 72% at 515 nm, and 46% at 670 nm wavelength, switching time of less than a second. This triggers a way to design an enhanced solid-state electrochromic device by adequately exploiting the diffusion-controlled electrochemical material.
Experimental details
Chemicals used
Gadolinium oxide (Gd2O3, 99.99% purity) and titanium dioxide (TiO2, 99.99% purity), poly(3-hexylthiophene-2,5-diyl) (P3HT), polyethylene oxide (PEO, MW = 100 000), 1,2-dichlorobenzene (DCB), lithium perchlorate (LiClO4), propylene carbonate (PC) and acetonitrile (ACN) were procured commercially and used as received from Alfa AesarTM/Sigma AldrichTM.
Gd2TiO5 Synthesis
The polycrystalline sample of Gd2TiO5 (GTO) was synthesized using the conventional solid-state reaction route method. The Gd2O3 and TiO2 were mixed homogeneously in stoichiometric amounts and were grounded in agate mortar-pestle for 4 h in a volatile liquid medium of isopropyl alcohol. Then, the grounded powder was heat treated in the muffle furnace at 1300 °C for 24 h, followed by intermediate grinding and the final sintering at 1350 °C for 24 h. The synthesized GTO sample has been used for further characterization without any further purifications.
Device fabrication
For device fabrication, a film of P3HT with 0.03 wt% doping of GTO was deposited on an ITO-coated glass substrate using a simple spin coating method, as described earlier [34, 41]. Briefly, 0.03 wt% of GTO and 0.3 wt% of P3HT solution in DCB were prepared using vortex mixing. The GTO-doped P3HT solution was spin-coated on an ITO glass substrate at 500 rpm for 120 s, and the resulting film was annealed at 80 °C for 1 h. The layer of the PEO gel matrix mixed with 0.5 M LiClO4 in PC was drop-cast on another ITO substrate using the recipe as discussed earlier. At last, both electrodes were sandwiched with double-sided tape using a simple flip-chip method. For comparison, GTO undoped P3HT was also fabricated using the same method discussed above without adding 0.03 wt% of GTO in P3HT.
Characterization details
A Supra 55 Zeiss FESEM was used for the SEM micrographs. Bruker D8 diffractometer having Cu-Kα
wavelength of 1.5405  was used for the XRD pattern of Gd2TiO5. Rietveld refinement was performed on the sample using the FullProf Suite software [42–44] to extract the crystallographic information. The refinement was performed using the orthorhombic phase with the Pnam space group. VESTA (Visualization for Electronic and Structural Analysis [42, 45, 46]) software was used to extract the lattice parameter, bond length, and bond angles to comprehend the crystal chemistry and structural distortion information. LABRAM-HR spectrometer with a 633 nm excitation wavelength was used for the Raman spectrum. A Metrohm-Multi Autolab M204 potentiostat was used for all the three-electrode electrochemical measurements of GTO-P3HT and P3HT, and the Keithley 2450 workstation was used for all the electrochemical instruments of the device. The Perkin ElmerTM make lambda 365 spectrophotometer was used for all the UV–Vis measurements.
Result and discussion
The above synthesized GTO has been thoroughly characterized to check its surface morphology, phase composition, and chemical purity. The SEM image of the GTO sample shows the formation of microparticles with a particle size of a few micrometers. To determine the average size of the GTO sample, the microscopic image was analyzed using ImageJ software (figure S1, supporting information, or SI). The GTO sample contains particles of sizes as small as few hundred of nanometers. The chemical purity of the sample was confirmed by the XRD [47] pattern (figure 1(b)). The absence of any unaccounted peak in the XRD pattern confirms the sample's high chemical purity and structural integrity [36, 48]. To obtain the structural parameters, the FullProf software [49, 50] package was used to do the Rietveld refinement of the obtained XRD data. The peak profile of the refinement was fitted with a 6-parameter polynomial background and pseudo-Voigt function. The GTO was found to exist in the orthorhombic phase with the Pnam [36, 38, 51] space group at room temperature. In order to visualize the crystal structure of the prepared sample, VESTA software was used (figure 1(b): inset). The Gd atoms form a seven-coordinated polyhedral with oxygen atoms and exist in the capped trigonal prismatic molecular geometry [52–55]. The two polyhedral Gd1O7 and Gd2O7 are connected by one standard edge formed by the O2 and O3 atoms (inset: figure 1(b)). The titanium ion forms the distorted Ti-O5 polyhedral [48, 56, 57], where five oxygen atoms surround the titanium ion and form the distorted square pyramidal geometry (Inset: figure 1(b)). To further confirm the synthesis of GTO, Raman spectrum have been recorded (figure S2, SI). The Raman spectra of the GTO sample resemble the Ln2TiO5 [58] system, confirming the successful synthesis of GTO.
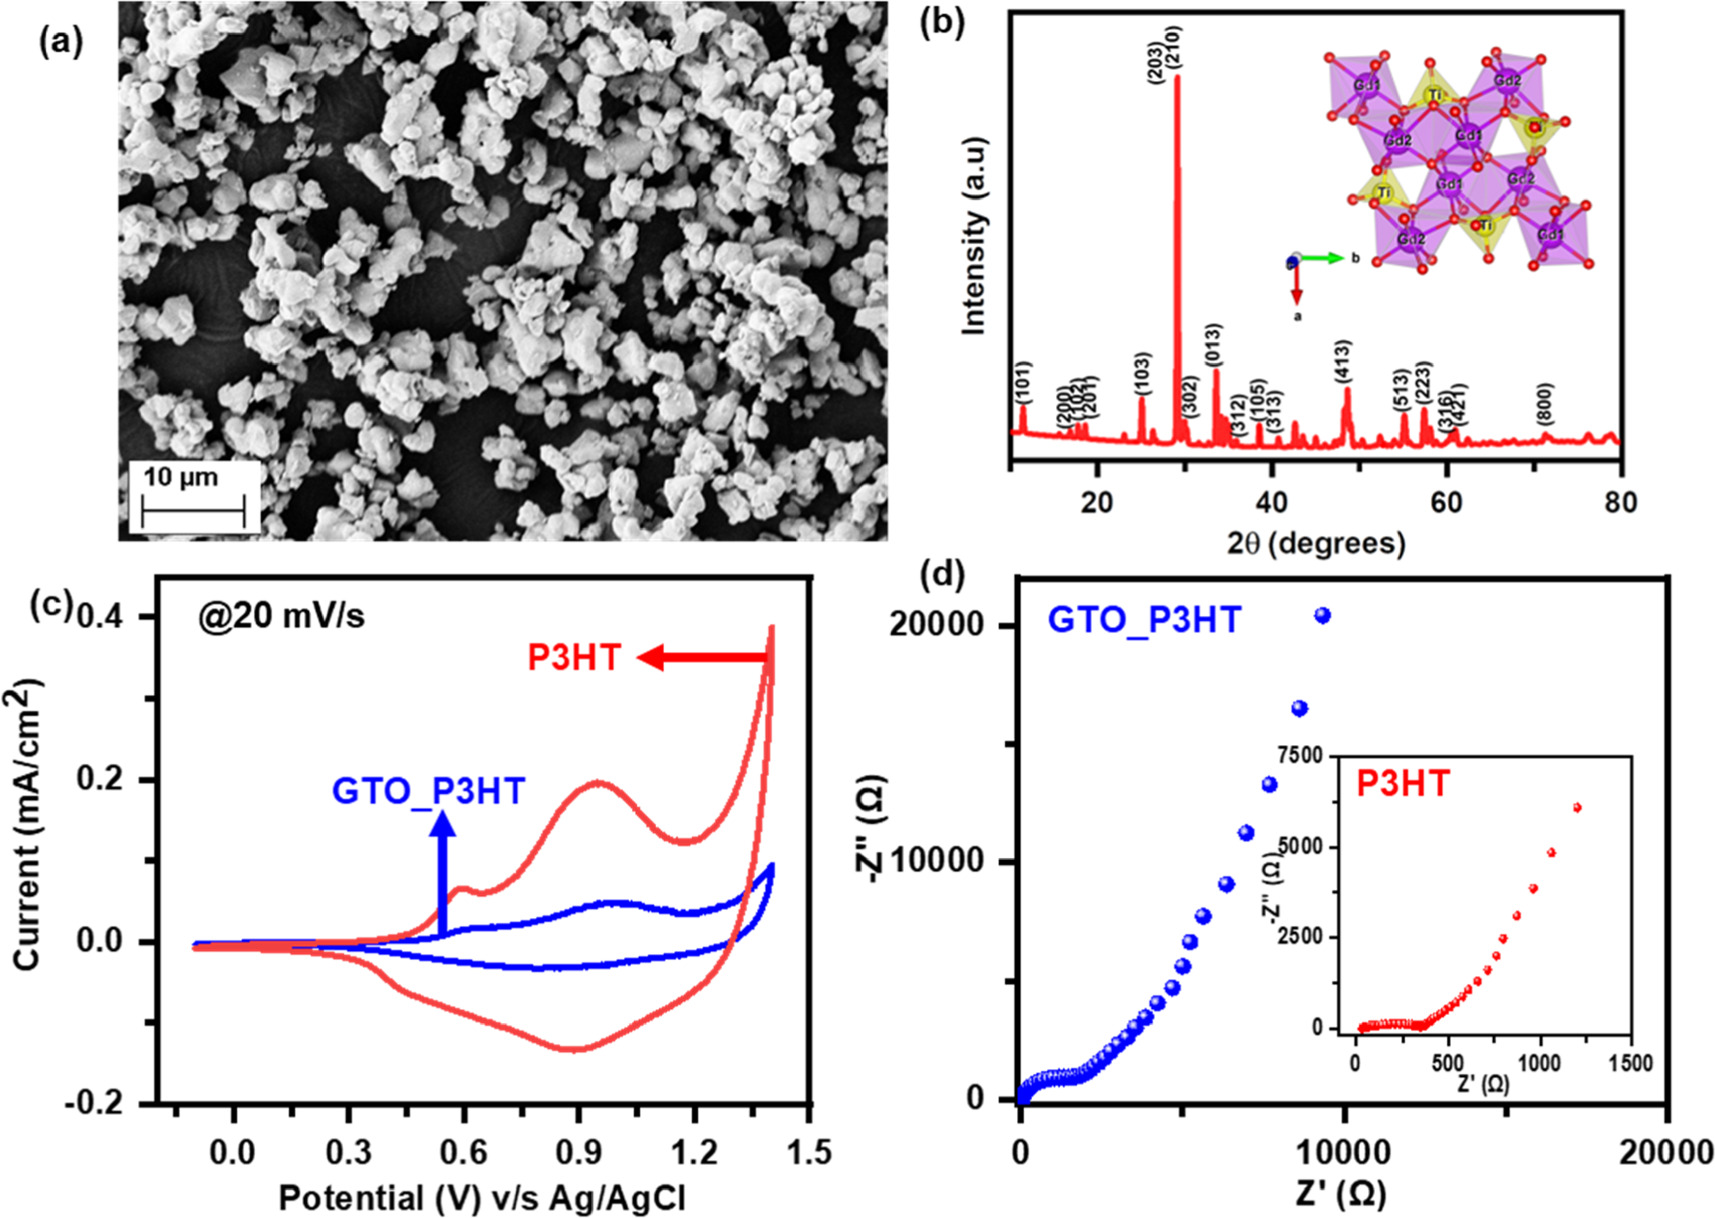
Figure 1. (a) SEM image, and (b) XRD pattern (inset: crystal structure of the orthorhombic phase) of Gd2TiO5, (c) comparative CV curves of pristine-P3HT and Gd2TiO5 doped P3HT (GTO_P3HT) electrodes at 20 mV s−1, and (d) electrochemical impedance spectra of GTO_P3HT (inset: EIS of P3HT).
Download figure:
Standard image High-resolution imageThe above-characterized GTO was used as a dopant in the P3HT electrode using the recipe described earlier in the experimental section to check its electrochemical performance prior to being used in a solid-state electrochromic device. Before their electrochemical performance, the film thickness and its morphology were checked using SEM (figures S3 and S4). The SEM image of the GTO_P3HT electrode shows the successful doping of GTO in the P3HT layer. The pristine P3HT layer is uniformly distributed all over the surface of the ITO substrate (inset: figure S3). In addition, the P3HT layer covers the GTO particles uniformly which is crucial for high electrochemical and electrochromic performances. The film thickness of the P3HT and GTO_P3HT layer was determined using cross-sectional SEM (figure S4). A few micrometers thick GTO_P3HT layer can be seen from the cross-sectional SEM image (figure S4(a)). The electrochemical activity of GTO-doped P3HT (GTO_P3HT) was measured and compared with the P3HT electrodes using CV tests at various scan rates (figures S5(a) and S5(b), SI). The current response of the electrodes increases with an increase in scan rate, typical behavior showing the faster diffusion of electrolyte ions on the electrode surface at higher scan rates. Both the electrodes show redox activity at ∼1.0 V, indicating the diffusion-controlled charge storage mechanism. Upon doping of GTO in P3HT, the current density of the electrode decreases with a decreasing area under the CV curve (figure 1(c)), indicating the decrease in charge stored on the surface, implying all the charge is available for the diffusion mechanism in redox activity and can increase the color contrast and coloration efficiency of the electrochromic device, being the charge stored on the surface at the denominator in coloration efficiency formula. Electrochemical impedance spectroscopy (EIS) has been done in the frequency range of 10 kHz to 10 mHz (figure 1(d)) to understand the diffusion mechanism further. The Nyquist plot for the electrodes shows the semicircle in the high-frequency region with a low solution resistance of ∼30 Ω. The low solution resistance of the electrodes indicates the faster diffusion of electrolyte ions on the electrode surface for both electrodes, a crucial factor in enhancing the electrochromic performance of electrodes. The straight arc in the low-frequency region with the low slope value for GTO_P3HT indicates the diffusion dominance over the charge storage mechanism, whereas the high slope value for the P3HT electrode indicates the dominance of the charge storage mechanism over the diffusion-controlled process (inset: figure 1(d)). The above electrochemical performance of the GTO_P3HT electrode shows enhanced diffusion mechanisms of electrolyte over P3HT, which can be utilized in electrochromic devices to increase its switching time and coloration efficiency.
The above-characterized GTO_P3HT electrode was further used to fabricate a solid-state electrochromic device (GTO_P3HT ssECD) using the recipe discussed in the experimental section to obtain a device that can be represented as schematic shown in figure 2(a) and has been compared with the undoped P3HT ssECD device. The as-prepared device appears light magenta due to the inherited color of P3HT, the white color of the GTO dopant, and the transparent PEO gel matrix (inset: figure 2(b)). The color of the device changes from magenta to nearly transparent (owing to its polaronic state) (inset: figure 2(b)), whereas the P3HT device changes from magenta to light blue color (owing to its bipolaronic state) (inset: figure S6) under the external bias of +1.4 V. The same can be verified from the in situ bias-dependent absorption spectra of the device under the external bias of ±1.4 V. The device absorbs the maximum green band (near 525 nm) and transmits a magenta color in its initial state, whereas the overall absorbance of the device decreases over the visible spectrum range, thus giving a nearly transparent state in its ON state (+1.4 V) (figure 2(b)). On reversing the external bias, the device regains its initial magenta color, indicating high repeatability under the external bias. On the other hand, the P3HT device mostly absorbs the green wavelength, giving a magenta state initially; under the external bias of +1.4 V, the P3HT device absorbs a maximum of orange and red wavelengths, giving a light blue color in the ON state (figure S6).

Figure 2. (a) Schematic diagram of fabrication of ITO/GTO_P3HT//PEO/ITO ssECD and its corresponding in situ absorption spectra at various potentials (b) (inset: digital photograph of GTO_P3HT device in colored and bleached state).
Download figure:
Standard image High-resolution imageOwing to the high optical modulation repeatability of the device, the device's electrochromic performance parameter is investigated to check the effect of diffusion-controlled GTO doping on device performance. The maximum change in the device's absorbance is observed at wavelengths of 515 nm and 670 nm (figure 2(b)). Hence, all the electrochromic performance parameters have been calculated at 515 nm and 670 nm wavelengths. The color contrast of the device at 515 nm and 670 nm has been calculated using equation (1) from bias-dependent absorbance spectra (figure 2(b))

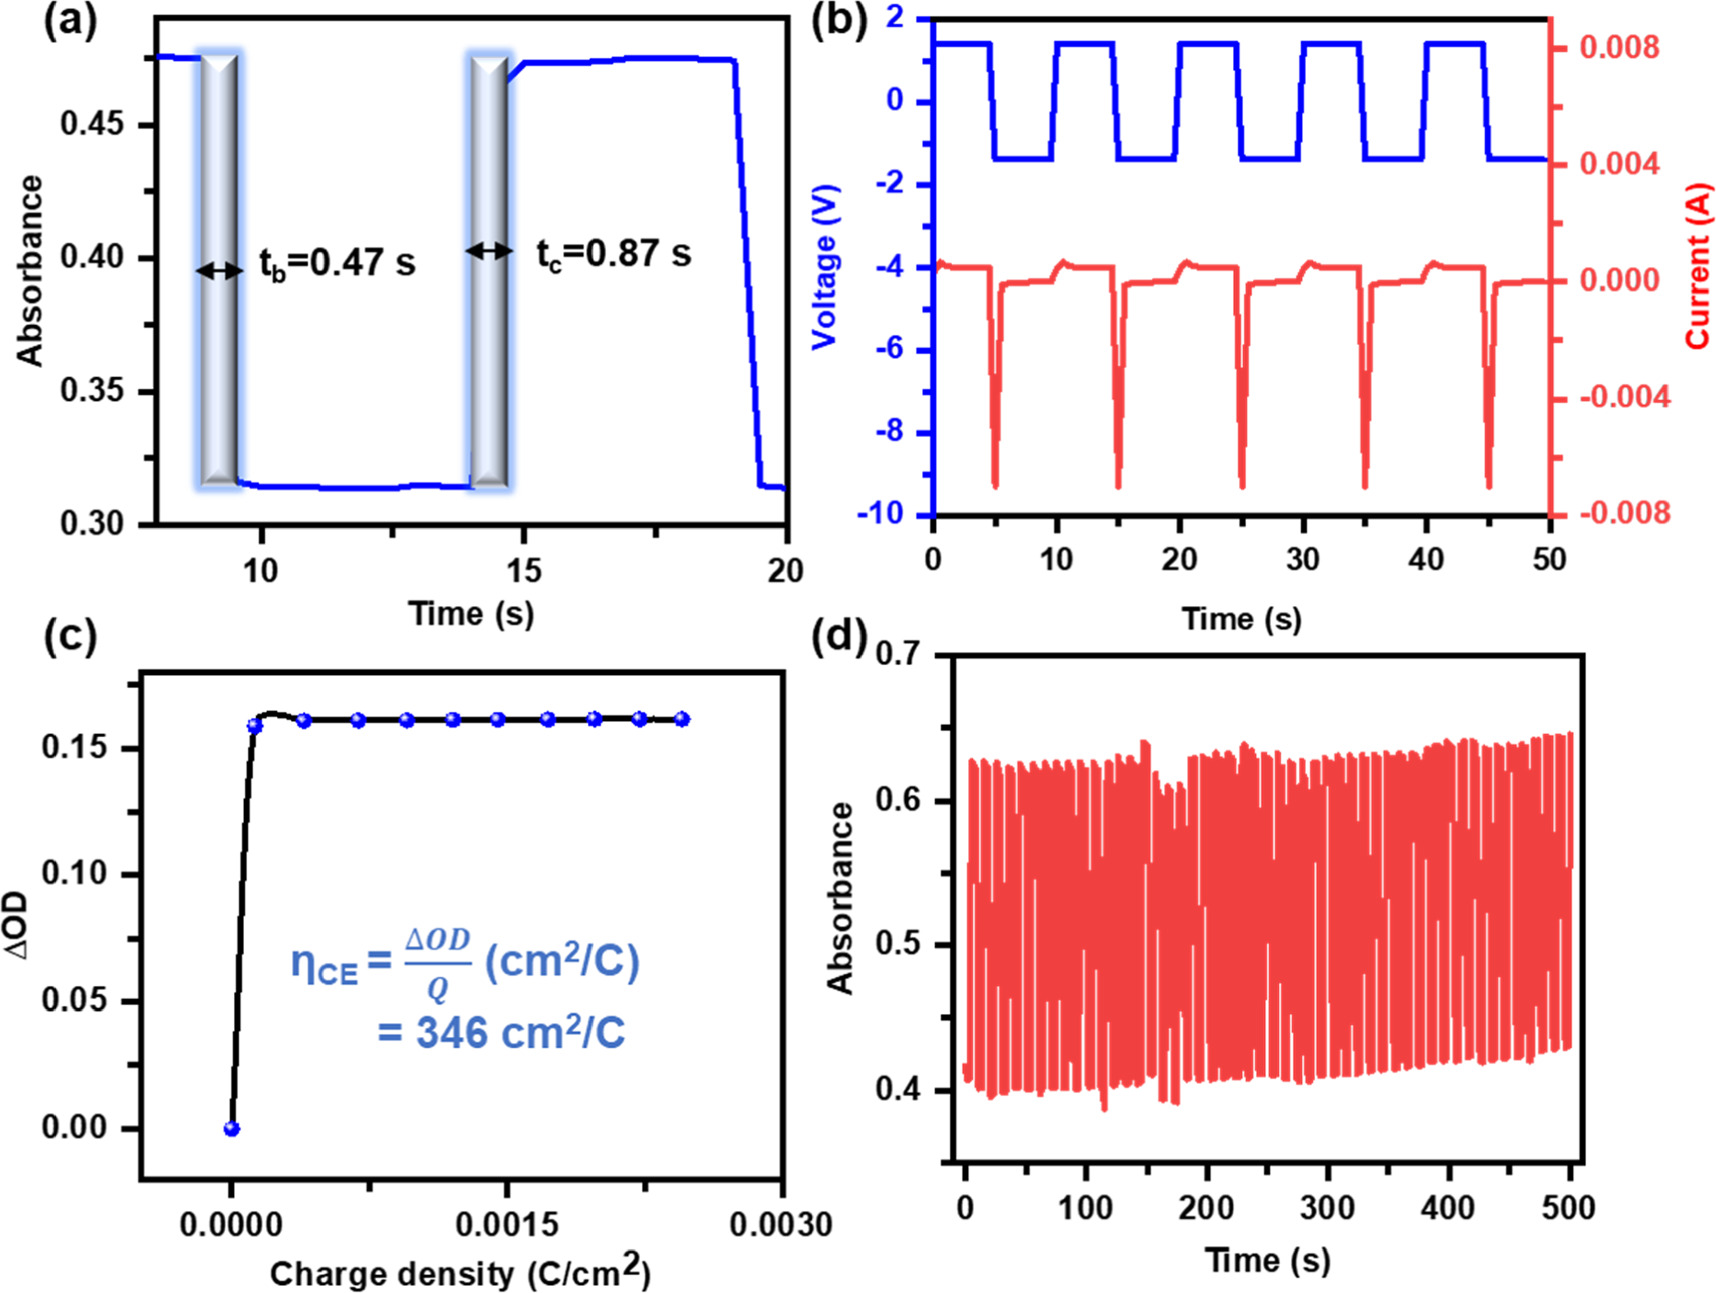
where AON and AOFF are the absorbances in the ON and OFF states of the device. A maximum of 79% at 515 nm and 42% at 670 nm of CC has been observed for the GTO_P3HT device (figure 2(b)), whereas a maximum of 21% at 515 nm and 12% at 670 nm of CC has been observed for the P3HT device (figure S6, SI). The high color contrast of the device is because the GTO_P3HT device changes from magenta to a transparent state, implying low absorbance in its ON state, whereas the P3HT device changes from magenta to blue state, implying comparatively high absorbance in its ON state. The color switchability of the device was calculated using in situ absorbance spectra under the external voltage pulse train of ±1.4 V at 515 nm and 670 nm (figures 3(a) and S7, SI, respectively). The device takes 0.47 s to switch from colored state to the bleached state (bleaching time, 90% of its minimum absorbance) and 0.87 s to switch back from the bleached state to the color state (coloration time, 90% of its maximum absorbance) at 515 nm wavelength (figure 3(a)), whereas the device takes 0.97 s to switch from colored to bleached state and 0.67 s to switch back from the bleached state to the colored state (figure S7). On the contrary, the coloration and bleaching times for the P3HT device at 515 nm wavelength were found to be 1.15 s and 0.47 s (figure S8(a), SI), and at 670 nm, they were found to be 2.0 s and 2.5 s (figure S8(b), SI). The low switching time of the GTO_P3HT device is due to the dominance of the diffusion mechanism over the charge storage mechanism, making charge available readily for optical modulation on the electrode surface.
Figure 3. (a) Single switching cycle of colored and bleached state and its corresponding current response under the bias pulse train of ±1.4 V (b), (c) coloration efficiency, and (d) stability measurement for the device under continuous bias pulse train for 100 switching @ 515 nm wavelength.
Download figure:
Standard image High-resolution image
The coloration efficiency of the device is one of the crucial factors in estimating its electrochromic performance. Prior to estimating the coloration efficiency, the current response of the device, and hence the charge stored on the electrode surface under the external pulse train of ±1.4 V, was observed (figures 3(b), and S9, SI). The current response for the GTO_P3HT and P3HT devices shows excellent current stability under external voltage stimuli. It is also worth noticing that the maximum current for the GTO_P3HT device is less than that of the P3HT device (figure S9), implying low charge storage on the GTO_P3HT device compared to the P3HT device. The coloration efficiency of the device has been estimated using the equation (2):

where ΔOD is the change in optical density, and Q is the charge stored on the electrode surface under the external stimuli of ±1.4 V. The change in optical density (ΔOD) has been calculated by measuring the change in absorbance between colored and bleached states from the switching cycle of the GTO_P3HT device under an external pulse train of ±1.4 V. The value of maximum absorbance (0.475) has been subtracted from the absorbance value under the bleaching cycle as also summarized in table S1 in SI. The coloration efficiency of the device was 346 cm2/C (figure 3(c)), whereas the coloration efficiency of the undoped P3HT device was 50 cm2/C at 515 nm wavelength (figure S10, SI). The evident increase in coloration efficiency of the GTO_P3HT device is due to the decrease in charge stored on the electrode surface (the charge stored on the electrode surface being in the denominator of equation (2)) and the high difference in optical density. The above-mentioned electrochromic performance data has been summarized in table S2 in SI for better visualization.
The device's cyclic stability is one of the major parameters that define the suitability of electrochromic devices for real-life applications. For this, a continuous pulse train of ±1.4 V for 100 cycles has been applied to both devices, and corresponding absorbance spectra have been recorded at 515 nm and 670 nm wavelengths. The constant change in absorbance over the 100 switching cycles for the GTO_P3HT device indicates excellent absorbance stability over 100 cycles for both wavelengths (figures 3(d) and S11, SI). The continuous decrease in the change in absorbance for the P3HT device at 515 nm wavelength (figure S12(a), SI) indicates poor absorbance stability, which is due to the storage of charge on the electrode surface, whereas the P3HT device shows good stability at the 670 nm wavelength (figure S12(b), SI). The excellent stability of the GTO_P3HT device is due to the diffusion-controlled mechanism of the device, while in the case of P3HT, which is a surface charge storage-controlled process. Overall, passive doping of the diffusion-controlled properties of GTO on the electrochromic layer can be exploited to improve the electrochromic device's overall electrochromic performance and make it more suitable for real-life applications.
Conclusion
Pure Gadolinium titanate complex synthesized using a simple solid-state reaction method when doped in P3HT increases the dominance of the diffusion-controlled mechanism over charge storage on the electrode surface compared to pure P3HT electrode. Solid-state electrochromic device fabricated using GTO doped P3HT layer as an anodic electrode and an ITO layer as a cathodic layer with PEO gel matrix as an electrolyte switch between marron (colored) to transparent state with less than half of a second. The doping of GTO in P3HT increases the coloration efficiency of the device by five times (346 cm2/C) with a maximum color contrast of 79% at 515 nm and 46% at 670 nm wavelength as compared to pure P3HT device due to the decrease in charge stored over the electrode surface. In addition, the GTO_P3HT device shows excellent stability at both wavelengths for over 100 switching cycles, making it more suitable for real-life applications. The doping of diffusion-controlled electrochemical material in electrochromic materials shows excellent performance enhancement and can be utilized in future real-life applications.
Acknowledgments
Authors thank funding received from Anusandhan National Research Foundation (ANRF)/Science and Engineering Research Board (SERB), Govt. of India (Grant: CRG/2019/000371; CRG/2022/02787). Facilities received from SIC (IIT Indore) and Department of Science and Technology (DST), Govt. of India, under FIST scheme (Grant SR/FST/PSI-225/2016) is highly acknowledged. Author RN thank UGC, Govt. of India (NTA Ref. No.: 191620205943) for fellowship. Author LB acknowledges Council of Scientific and Industrial Research (CSIR) for financial assistance (File 09/1022(12309)/2021-EMR-I). Mr. Prashant Gupta and Dr. Nitin Upadhyay for technical assistance are highy acknowledged.
Data availability statement
All the data that supports the finding is available in the article and/or the supporting information. The data that support the findings of this study are available upon reasonable request from the authors.
Supplementary data (3.9 MB PDF)