
Abstract
In disordered materials, the ordinary understanding is that charge carriers tend to occupy energetically favorable sites known as ion-conducting channels. Many studies have revealed that the inherent fractal properties of such pathways lead to a sub-diffusive behavior. The linearity or branching of these pathways is crucial for determining how the charge carriers move. It can be thought that as the space dimensionality decreases, the average distance between the highest energy barriers along the conduction paths increases. In this study the finite dimension of those pathways is computed using an extended version of the classical Hausdorff dimension. Also, the Arrhenius behavior of the most mobile lithium ions is proved, confirming that such are responsible for conductivity behavior. The lithium ions mobility behavior in response to temperature changes and the finite dimension allowed to identify the ion diffusion regions fractal features. The reported results demonstrate that as the temperature increases the conducting channels become broadener, facilitating the transfer of electrical charge through the glassy matrix, below the transition temperature. The pathways behavior confirms the increase of the ionic conductivity when the temperature increases as it is experimentally observed.
Export citation and abstract BibTeX RIS

Original content from this work may be used under the terms of the Creative Commons Attribution 4.0 licence. Any further distribution of this work must maintain attribution to the author(s) and the title of the work, journal citation and DOI.
1. Introduction
In disordered materials, alternating current (AC) conductivity curves often reveal consistent patterns. Several studies have documented systematic deviations on such curves that suggest a correlation with changes in the charge carrier local environment [1–3]. It has been proposed that modifier ions within an initially polymerized glassy matrix may induce a depolymerization of the oxide network. This depolymerization process could lead to a change in the average oxygen coordination of charge-compensating ion sites as ion concentration varies; consequently, modifying the local ion environment and the dimensionality of the conduction space [4]. Additionally, glasses containing a mixture of alkali ions exhibit distinct conductivity variations compared to those with only one type of alkali ion [1]. In the case of metaphosphate glasses, distinguished by their highly polymeric oxide structures, researchers have observed systematic alterations in the correlated motion of ions, all together with variations in cation size relative to available free volume [5]. This has led to the hypothesis that an effective local dimension of the conduction space might govern correlated ion motion. Therefore, further studies are needed to fully understand these phenomena of glassy matrix depolymerization and changes in the average oxygen coordination that modifying the local ion environment of the conduction space of these materials, since it becomes increasingly apparent that the effective dimensionality significantly influences the behavior of these materials.
The common interpretation is that charge carriers in disordered materials are confined to energetically favorable sites known as ion channels. These channels serve as pathways that guide the migration of ions within the material. Moreover, groundbreaking research by Dyre et al [6] has unveiled how inherent fractal characteristics in disordered systems can give rise to sub-diffusive dynamics in charge carriers. Those inherent fractal characteristics depend on the timescale at which charge carrier dynamics are observed. Depending on such timescale, the mean squared displacement exhibits distinct behaviors, following a power law with an exponent either smaller than one (indicating sub-diffusion) or equal to one (indicating normal diffusion).
Within this context, questions naturally arise about the dimensionality of charge carrier paths and its role in conditioning their dynamic behavior. Therefore, the linearity or branching of these paths becomes a critical factor in determining the observed behavior.
One way to conceptually understand why the ionic channel dimensionality affects the system is to assume that as the dimensionality decreases, the average distance between the highest energy barriers along the conduction paths increases. The ions move back and forth between these barriers. When this back-and-forth motion covers a larger spatial area, it leads to a stronger dielectric relaxation force. As a result, the shift from alternating current (AC) dispersive conductivity to direct current (DC) conductivity occurs more gradually. This sensitivity to dimensionality is particularly noticeable in the RBM (Random Barrier Model), where alterations in dimensionality similarly change the conductivity spectra. For instance, in two dimensions, the conductivity increases less steeply with frequency compared to three dimensions [6, 7]. The close relationship among the distance separating the highest barriers, dimensionality, and the characteristics of the transition from DC conductivity to dispersive conductivity was studied in considerable detail by Dyre et al [8].
Fascinatingly, traces of fractal structure have been uncovered in the conductivity spectrum of specific ion-conducting tellurite glasses. A noteworthy study, detailed in [7], identified oscillations at the MHz scale, revealing log-periodic modulation in the root mean square displacement of ion carriers at mesoscopic scales. This finding underscores the presence of a fractal structure within the intricate network of conduction channels [9–11].
Additionally, fractals, have been recognized as recurring patterns both in mathematical representations and the natural world, exhibiting a distinctive property known as self-similarity. This property implies that each constituent of a fractal pattern statistically resembles the entire pattern, regardless of the scale [12]. The concept of fractals carries profound significance across various scientific and industrial domains [13–18]. In nature, fractal patterns manifest diversely, from snowflakes and tree branching to mountain contours, coral reefs, and leaf arrangements. These patterns optimize resource utilization, energy efficiency, and adaptability to environmental conditions. Moreover, fractal attributes are evident in river networks, plant capillaries, and root systems, enhancing efficient water and nutrient transport [19].
The primary goal of our study is to explore the behavior of the regions where the charge carrier moves in a glassy matrix of an ionic conducting glass, as a function of the temperature. Our focus centers on lithium metasilicate glass, a well-established system, meticulously examined through molecular dynamics simulations, where the graphs generated by the most mobile ions are subjected to a comprehensive analysis from the explored region finite dimension perspective. Central to our analysis is the calculation of the finite dimension (dimf), a mathematical concept introduced in prior works [20–22]. This concept extends the classical Hausdorff dimension [23] to finite sets, offering innovative insights. It plays a key role in our research, providing valuable insights into the behavior of lithium ions within the metasilicate glassy matrix in response to temperature variations.
The results of this investigation provide profound insights into the intrinsic nature of mobile ions inside of a conducting glass, greatly enhancing our understanding of the finite dimensions that define the pathway network in ionic glasses (amorphous systems). These pathways facilitate the movement of mobile ions, which are responsible for their electrical conductivity.
2. Method
The metasilicate system is formed by 3456 total atoms according to the formula Li2SiO3. The pair potential of Gilbert-Ida type including the r−6 term was applied like it was used in previous works [24, 25]. First, temperature was steeply increased to 3500 K and then cooled to 700 K, 900 K, 1100 K, 1200 K, 1300 K, 2000 K and 3500 K with the same quenching rate. The glass transition temperature of this system was determined and resulted to be 1200 K. Simulations were performed, and the reported density was reached. The Verlet algorithm, periodic boundary conditions and time step of 1 fs was used to integrate the motion equations. LAMMPS software and NPT ensemble (isothermal–isobaric) to obtain 101 configurations at intervals of 200 fs of each trajectory, were performed avoiding a strong structural decay, similarly to those results previously published (see details on it and references there in) [25]. Now, such trajectories are studied to analyze the lithium spatial evolution.
All the lithium ions displacements were analyzed. To compute the lithium-ion displacement, first the standard deviation of the averaged position over the 101 configurations was taken. Second, the standard deviation displacement frequency distribution of all lithium ions was determined. This was evaluated at every temperature. This method allows to identify the most mobile lithium ions given the condition: a lithium ion is the most mobile if its standard deviation is higher than one. Therefore, as the temperature increases the number of mobile ions also increases Such condition is independent from any molecular dynamics model criteria and allows to identify those truly mobile ions. Their spatial evolution can be followed by assuming that they move through the certain regions of the glassy matrix, that are called ion channels, and this method acts as an exploratory probe.
Once the most mobile and the least mobile lithium ions were classified, the Euclidean distance between coordinate points was converted into a finite metric space, denoted as (M, d). Afterwards, the chemical details were dismissed and only the geometry was preserved, i.e., the lithium ions are points in a graph. A finite graph G = (V, E) (V vertices (or nodes) and E edges) consists of two sets which must also be finite. In this work the plotted variables were finite, undirected, connected, simple and loop-free. It is simple if the vertices (x, y) share a maximum of one edge. A graph is undirected if (x, y) = (y, x) and it is valid for all the edges and it has two distinct ends. The graph is connected if every pair of vertices can be connected by a path. Those paths have a length defined as the sum of the lengths of each of their edges. Taking the smallest length among all paths connecting a given pair of vertices, a new distance, the path length dG in V, was defined. Next, the graph G was plotted, and finite dimension of G was calculated. In this work, the length of each edge was assumed as 1 using the Connected Sparse Graph CSG(M), The metric space on which the dimf (finite dimension) was computed, was straightforward calculated using equation (1):

where CCN (Click Covering Number) denotes the covering number of CS (connected space) and its diameter. Calculating CCN is known to be an NP-complete problem [26], i.e., it is an algorithmically difficult problem. In contrast, the calculation of Dia (diameter) [22] is straightforward calculated. But, since all CSs composed from the simulations turn out to be trees, then the computation of CCN becomes a simple problem. Therefore, the finite dimension of CS was computed with the program SAGEMATH [27].
A Glycan Space (GS) is an easy finite dimension graphical representation [28], where the finite dimension (dimf) is related to the diameter (Dia) by a plane.
To bring out a more intuitive interpretation of the dimf and Dia, figure 1 shows the opposite graph behaviors that could be observed in the graphs originated by some system. Consequently, when the graph of dimf resembles a 'rope,' as depicted in figure 1(a), it tends to approach a value of dimf = 1. On the other hand, when the graph exhibits greater connectivity resembling a 'pom-pom', as shown in figure 1(b), the dimf value increases. This highlights the usefulness of dimf in understanding the connectivity of lithium ions within the system studied in this work and enables to reveal the footprint of an ionic channels map, illustrating the pathways through which the most mobile lithium ions are connected in this kind of material.
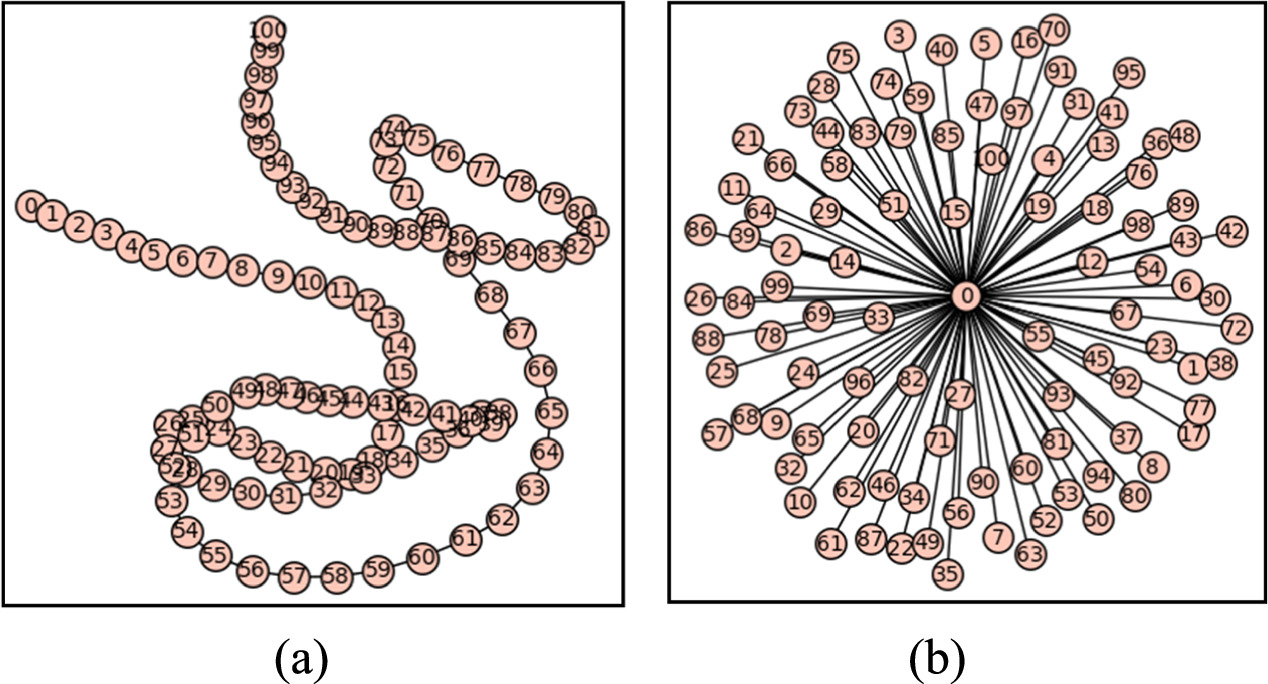
Figure 1. Opposite graph behaviors that could be observed in a system. (a) graph that shows results resembling a rope with dimf = 1 and Dia = N–1; (b) graph that shows greater connectivity that resembling a pom-pom, with higher dimf and Dia = 2.
Download figure:
Standard image High-resolution imageFigures 1(a) and (b) show two graphs with the same particle number N = 101. In figure 1(a) a rope shape can be observed where each particle has two neighbors, and no cycle is formed. From the results, it can be inferred that N-2 particles have two neighbors, and each particle has only one link to a neighboring particle at both endpoints. The number of CNN that covers the object can be calculated as [int(N/2)+1] and the diameter (Dia) is set as N-1 (considering that the Dia is defined as the largest distance that can joint two element in the graph). However, in figure 1(b) with the same particle number as in figure 1(a), all the particles have a single link with the central particle. Again, no cycle is formed, but in this case the number of clicks required to cover the object is N-1, and its Dia is equal to 2. Because of their different Dia and Clicks both graphs have a quite different finite dimension (dimf) which allows them to capture such different geometrical features.
3. Results and discussion
First, the lithium-ion mean square displacement at intervals of 200 fs was analyzed at each temperature. From the averaged position ( ) obtained of each lithium ion along a trajectory of 20 ps the root mean-square fluctuation (Δr) was computed as in equation (2). The obtained results were plotted in figure 2 for all the lithium-ions at each temperature. This figure reveals the expected mobility behavior with the temperature. While temperature rises, the number of lithium-ions with larger displacements increases, the most mobile lithium ions were identified as those ions whose displacement deviation was higher than an absolute deviation higher than one at each temperature between 2000 K to 3500 K, as it was explained above.

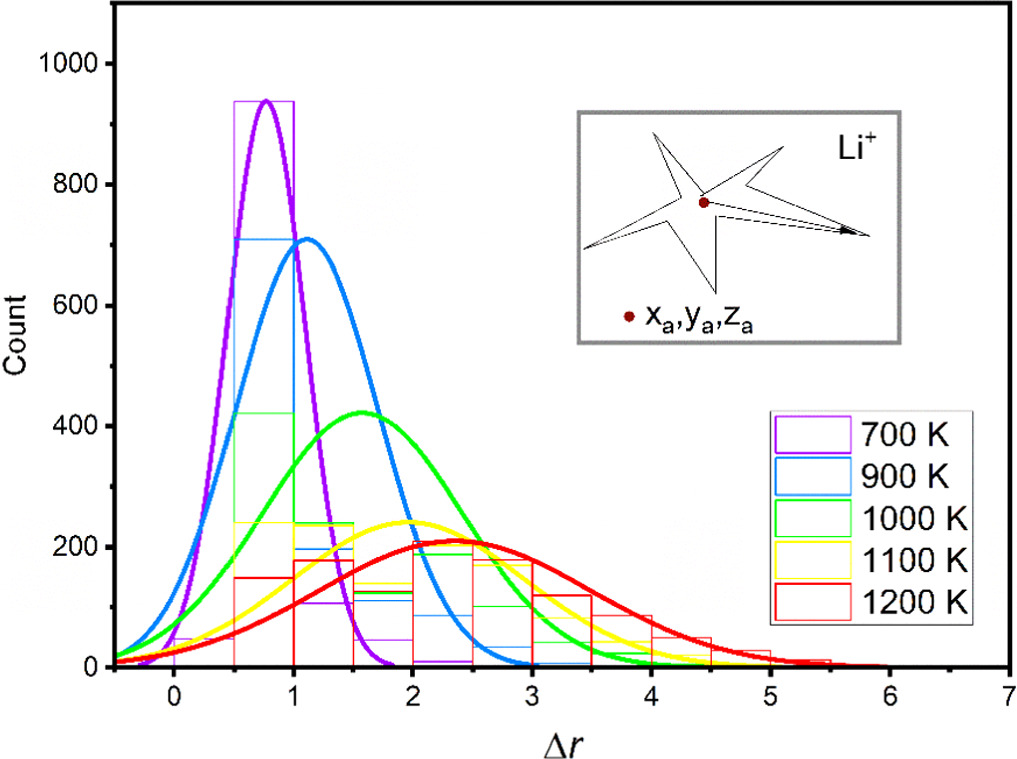
Figure 2. The distribution of root mean square fluctuation for all lithium ions at each temperature.
Download figure:
Standard image High-resolution imageEach graph of the most mobile and the least mobile ion is plotted following the rules described above at every studied temperature. This procedure allows transforming the system real space in a graph, like it is shown in figure 3.

Figure 3. Transform of the lithium metasilicate glass real space into a lithium-ions graph.
Download figure:
Standard image High-resolution imageThe number of the most mobile ions was obtained at each temperature and the log of the most mobile lithium-ions number was plotted as a function of T−1. Figure 4 shows the Arrhenius behavior observed for those temperatures below the glass transition temperature (Tg) of the present lithium metasilicate glass and its corresponding deviation at temperatures above. Therefore, considering that this is a thermally activated mechanism, inherent to the lithium-ion diffusion in this kind of material, it is assumed that the method used in the present work is an indirect method to relate the charge migration with the temperature allowing to validate the way to identify those ions that moves transporting the charge through the bulk. Charge migration is responsible for the electrical conductivity as a function of the T−1 and this behavior was experimentally observed [29]. Thus, the data presented in figure 4 reproduce the experimental conductivity behavior involving the Arrhenius linearity below the Tg and its deviation when the temperature surpasses that Tg as previously reported in literature [30]. Considering the equations (3) and (4):


where σ (equation (3)) is the material electrical conductivity that is caused by the migration of N charge carriers with mobility μ. While, σ (equation (4)), below the Tg, can well characterized by the Arrhenius law due the temperature-activated mechanism, where Ea is the activation transport energy and kB and T have the usual meaning; it is possible to accept that the obtained results support the model chosen to determine those ions that effectively contribute to the electric charge transport process in the system [29–32].
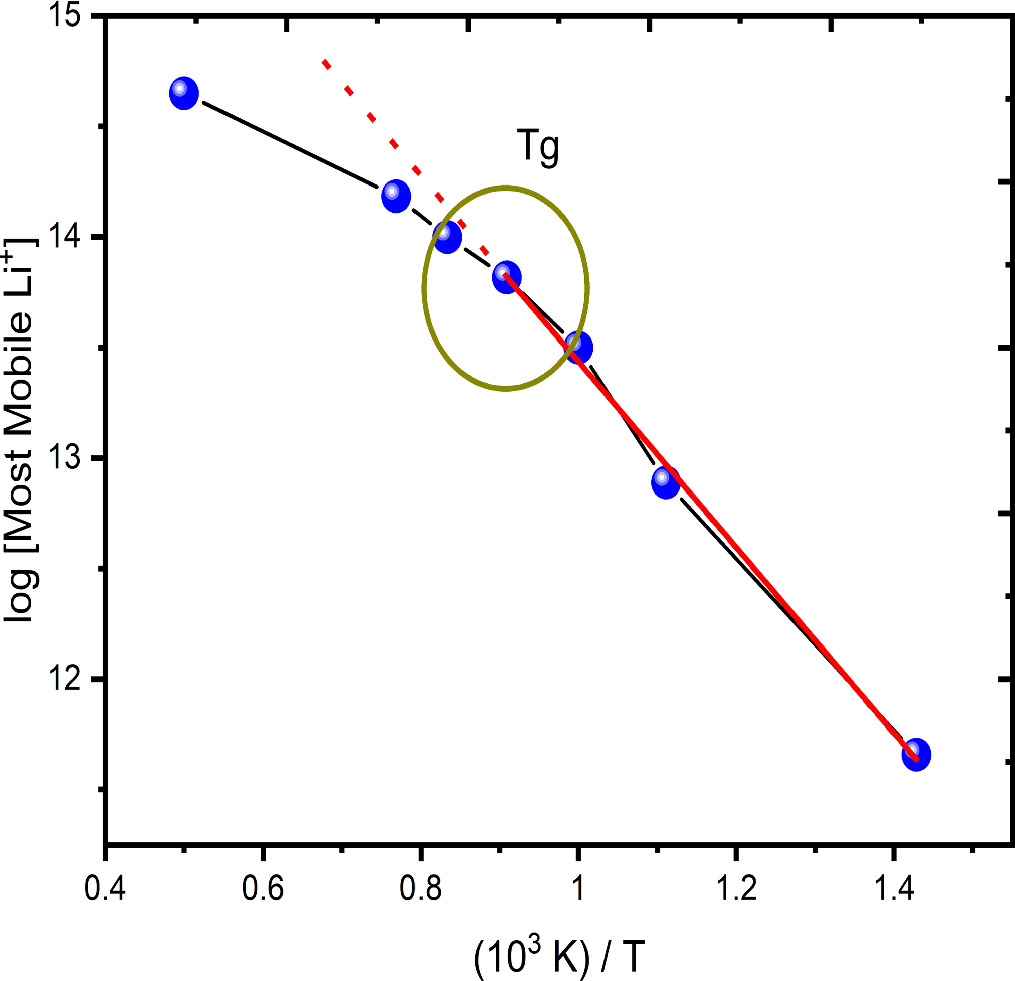
Figure 4. Logarithm of the number of most mobile lithium-ions as a function of T−1. The Arrhenius behavior is observed below the glass transition temperature (Tg).
Download figure:
Standard image High-resolution imageThe average distance between lithium ions was calculated as the total sum of the links in each graph divided by the number of ions linked: first, the average distance for the graph formed by the most mobile lithium ions was determined, and second, the averaged distance for the graph formed by the least mobile lithium ions, at each temperature. Starting from 700 K, where the system is a glass, passing by the Tg where the system becomes a supercooled liquid until to reach the liquid state at 3500 K, the least mobile ions' averaged distance grows as the temperature increases. Figure 5 shows a kind of divergence when the temperature reaches Tg. The number of the most mobile particles decreases when the temperature decreases deep in the glass state, and the number of the least mobile particles decreases when the temperature approaches the Tg, therefore, the uncertainty interval becomes larger evidencing that such particles are dispersed into the bulk and do not form a cluster.

Figure 5. Total sum of the links of each lithium type divided by the number of ions linked as a function of T−1. Least mobile ions' averaged distance (blue data) and the most mobile lithium ions' averaged distance (red data).
Download figure:
Standard image High-resolution imageSuch behavior confirms that those trapped lithium ions are uniformly distributed in the bulk and there is no cluster in any region. Next, when temperature increases, every lithium ion becomes mobile. Observing the most mobile lithium ions' average distance, as the system approaching the Tg, the lithium ions dynamic behavior is more like ion dynamic in a liquid state and, as the temperature increases, the average distance becomes temperature independent because all the lithium ions are equally mobile [30–34].
Previously, it was demonstrated that applying the method to determine the finite dimension only to those atoms that build the glassy matrix, i.e. silicon and oxygen atoms of the lithium metasilicate studied here, it was possible to identify its glass transition temperature [22]. Considering that such method seeks to describe the explored regions due to the ions movements, now it is analyzed the Glycan Space of that ions which are responsible for the charge transport, i.e., it is analyzed the space that relates the diameter (Dia) of the most mobile ions graph with its finite dimension (dimf). The Glycan Space (GS) of lithium ions in the lithium metasilicate glass is shown in figure 6 along a dynamical trajectory (20 ps) at each temperature. The results show that when temperature increases from 700 K to 1100 K (just some degrees below the Tg = 1200 K) the diameter (Dia) of the graph increases and a well-defined region for each temperature is delimited, like in a phase space. Moreover, if the diameter is normalized by particle (figure 7). Such relation (dimf, Dia) reveals that both have a shape that resembles a rope but while at 700 K the shape is thinner and longer, at higher temperature the graph still resembles rope but thicker. Thus, the increase of the finite dimension reveals that the most mobile ions increase the number of potential sites to visit and therefore, facilitates their migration increasing in that way, the ionic conductivity.
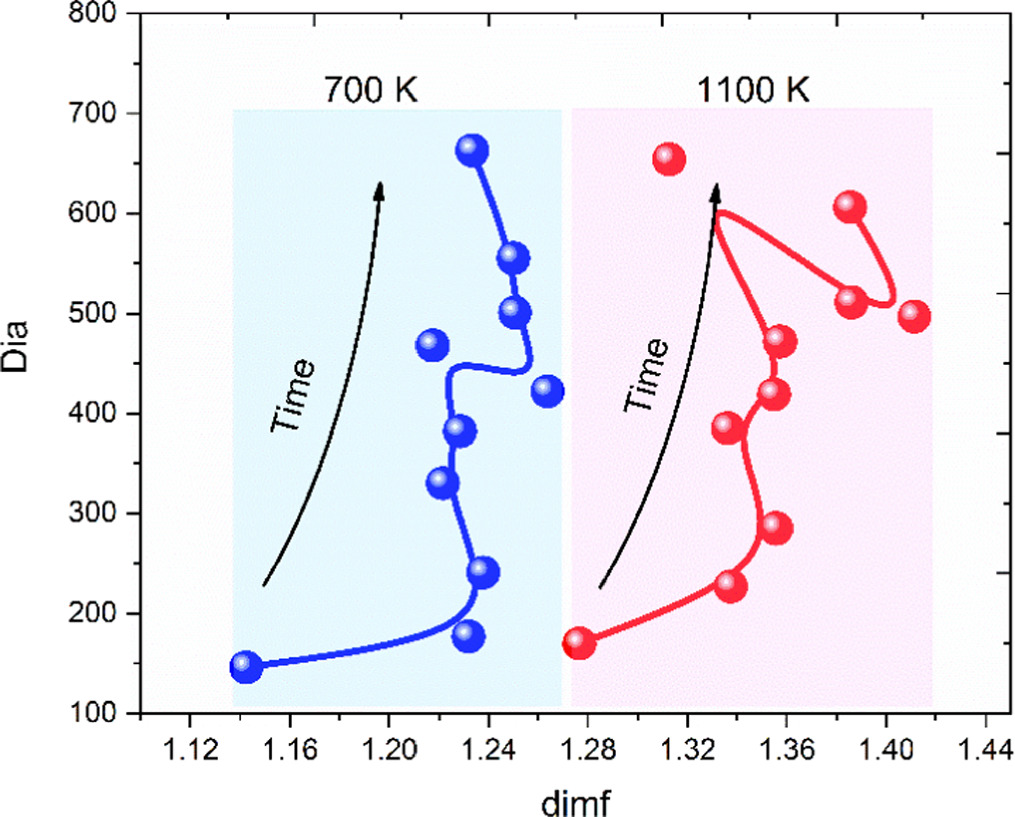
Figure 6. Glycan Space to describe the explored regions through the relation between the diameter of the most mobile ions graph as a function of its finite dimension.
Download figure:
Standard image High-resolution image
Figure 7. Diameter normalized by particle to identify that both resemble a rope but while at 700 K the shape is thinner and longer, at higher temperature the graph still resembles rope but thicker.
Download figure:
Standard image High-resolution imageSuch result agrees with the result previously proposed by Sidebottom, where demonstrated that the conductivity dispersion is the result of localized ion motion that take place on the atomic length scale [35] with K Funke in the jump relaxation model [36] and with Balbuena et al regarding the ion dynamic diversity into the glassy matrix [37].
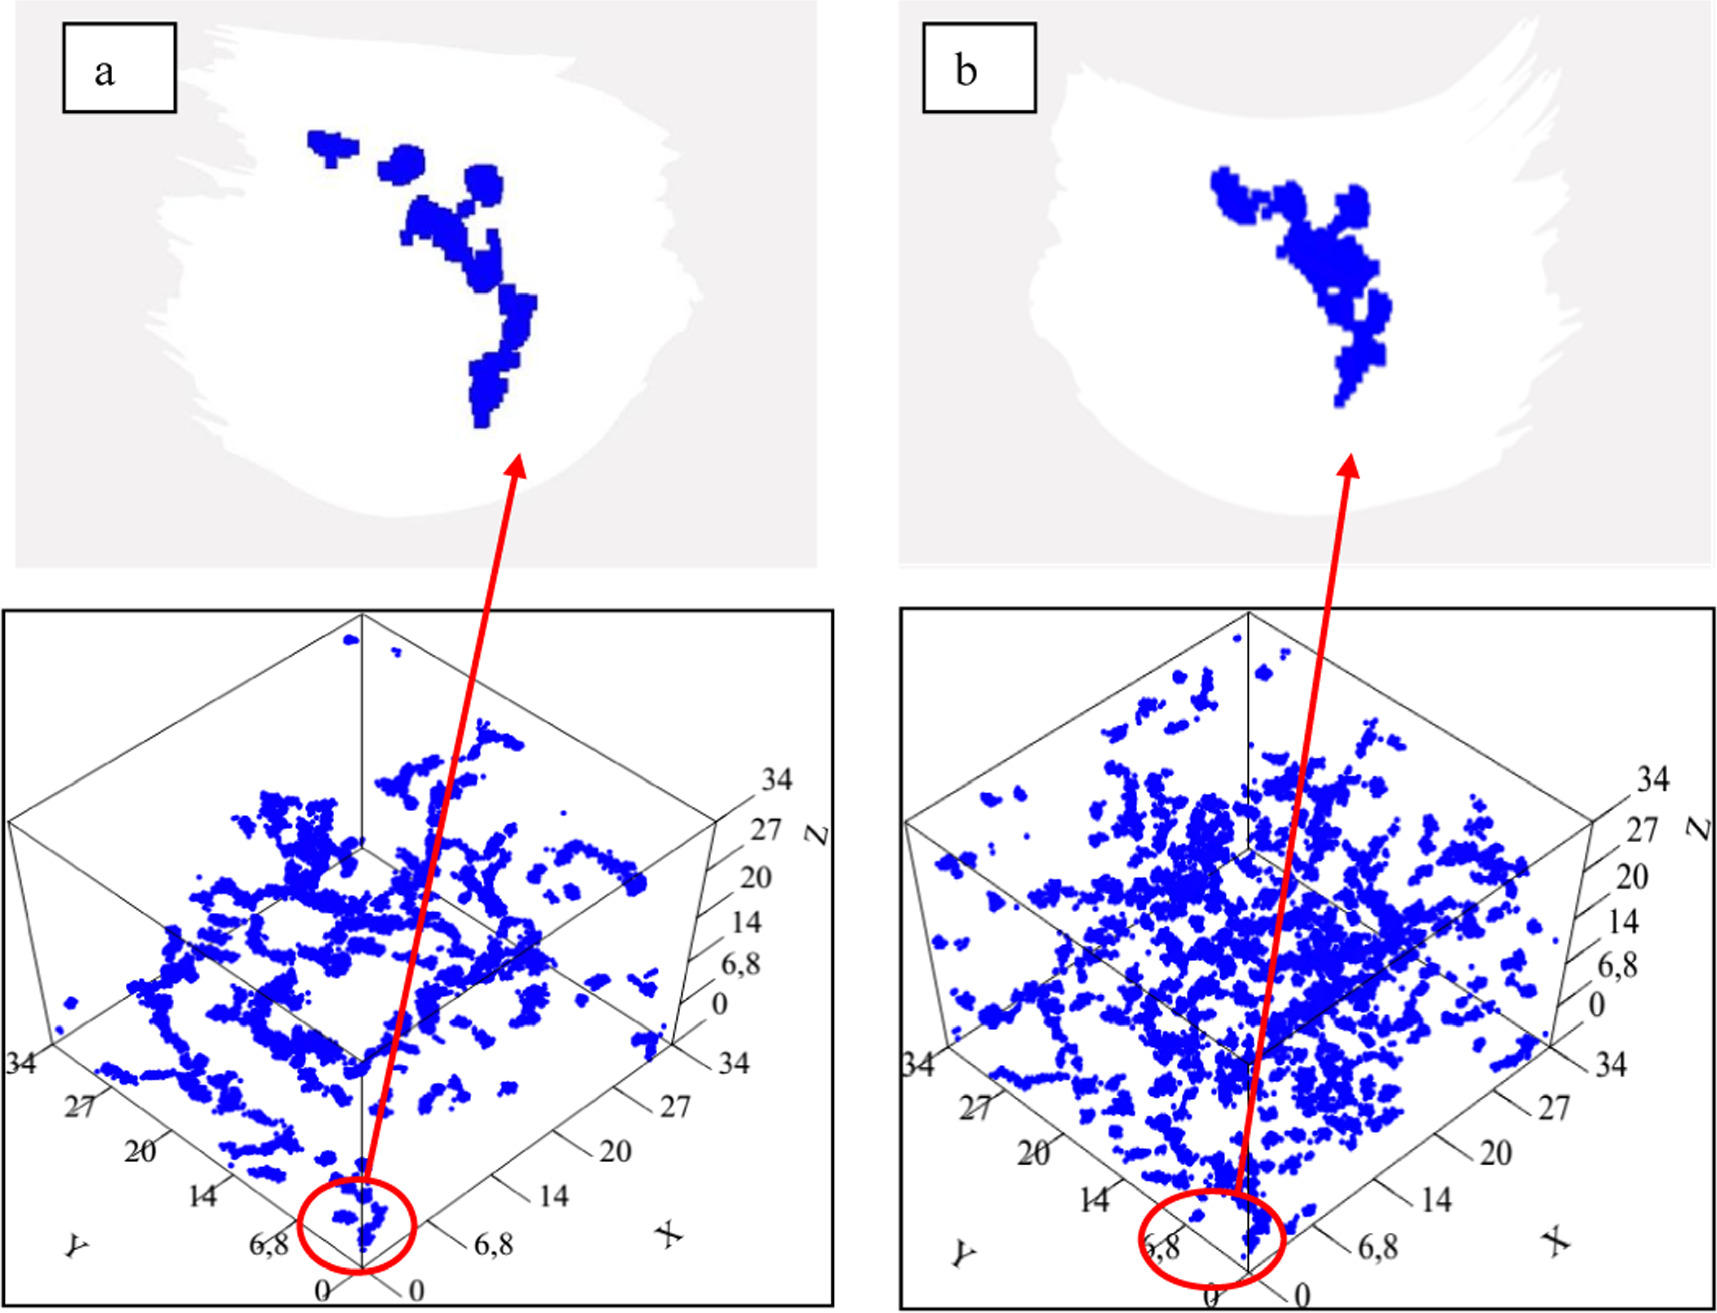
Figure 8 shows all the most mobile lithium-ion positions in a trajectory at: (a) 700 K and (b) 1100 K, where the formation of conduction channels is possible to visualize. Such pictures allow evidencing the usefulness of this tool, the dimf. Figure 8(a) shows the positions of all the most mobile lithium ions in the trajectory at 700 K where the paths have been identified through the formation of almost linear and thin objects (dimf tends to 1) which resemble a rope as in figure 1. Such regions give rise to the so-called ionic conduction channels and are distributed throughout the volume of the system as the value of the computed Dia, which agrees well with similar results obtained by Balbuena et al through the isoconfigurational method [24]. Figure 8(b), shows the obtained shape depicted by of the most mobile lithium-ion positions in the trajectory at 1100 Kwhich resembles a thick rope. As it was said before, those regions that build the ionic channels have increased the number of sites between the most mobile ions in a way that they can interact. As a result, the dimf increased around 20% but the Dia/particle decreased by 50%. Considering that the modifying ions depolymerize the covalent skeleton of a glassy matrix, which becomes less connected as the temperature increases to reach its Tg, the obtained result in the present work agrees with the explanation given by J. Smith and D. Siegel on glassy 75Li2S–25P2S5. These authors showed that the mobility of lithium ions is allowed from the concerted movement with the complex anions that build the glassy matrix, giving rise to regions through which the mobile ions move [38]. From another point of view, Rao et al showed that when the network diminishes its ramification, and its density increases the mobile ion pathway connectivity in glasses involves higher activation energy values that corresponds to a diminution of its electrical conductivity [39].
Figure 8. (a) Positions of all the most mobile lithium ions in the trajectory at 700 K. Formed paths are almost linear and thin; (b) most mobile lithium-ion positions in the trajectory at 1100 K, paths are still like a rope but thicker than at lower temperature.
Download figure:
Standard image High-resolution image
4. Conclusion
It was demonstrated that the ionic channel finite dimension increases with the temperature increasing, while the global diameter in a trajectory does not show a significant difference. Observing the ratio diameter/particle it becomes evident that it undergoes a significant decrease. This evidence shows that as the temperature rises, the ions enabling the transfer of electrical charge encounter more facilitated migration routes. Ion conduction channels widen with increasing temperature if it is lower than Tg. This structural change observed in the paths of ionic migration elucidates the experimentally observed rise in ionic conductivity when the temperature increases.
Acknowledgments
This work has been possible to the financing support by Universidad Nacional del Sur (PGI 24/Q112) and PICT 2021-I-A-00288, Agencia Nacional de Promoción Científica y Tecnológica (ANPCyT), PIP 2021-2023 GI 11220200100317CO. This research was supported by the Universidad Nacional de Mar del Plata, 15/E1040, and Consejo Nacional de Investigaciones Científicas y Técnicas, PIP1748/21. Universidad Tecnológica Nacional, Facultad Regional San Rafael (Argentina) under project 8104 TC.
Data availability statement
The data cannot be made publicly available upon publication because they are not available in a format that is sufficiently accessible or reusable by other researchers. The data that support the findings of this study are available upon reasonable request from the authors.
: Data availability
The data that support the findings of this study are available upon reasonable request to the authors.