
Abstract
Polymeric nanocomposites have emerged as a promising class of materials with improved strength, stiffness, and toughness compared to pure polymers. The incorporation of nanoparticles into polymer matrices, such as carbon nanotubes, graphene, clay nanoparticles, and metal oxides, has shown considerable potential for enhancing the properties of the produced nanocomposites. Herein, the influence of filtered multiwalled carbon nanotubes (MWCNTs) on solution-cast polyurethane (PU) nanocomposite is explored. Scanning electron microscopy (SEM), x-ray diffraction (XRD), Raman spectroscopy, thermogravimetric analysis (TGA), and x-rays photoelectron spectroscopy (XPS), respectively, were employed to characterize the morphology, crystal structure, phase, thermal stability, and oxidation states of the samples. MWCNTs with a higher weight% of MWCNTs showcased superior mechanical properties compared to base polymer (PU). The nanocomposite with 1 wt% of MWCNTs and 99 wt% of PU exhibited the highest stress (19.25 N mm−2) and strain (700.22%) among all fabricated samples. Also, Modulus of elasticity (∼25%), Ultimate tensile strength (∼21%), and elongation at break (∼11%) are increased by incorporating 0.5 wt% MWCNTs into PU matrix. The attainment of these remarkable mechanical properties could be attributed to excellent dispersion, interfacial bonding and structural stability of filtered MWCNTs in the nanocomposites.
Export citation and abstract BibTeX RIS

Original content from this work may be used under the terms of the Creative Commons Attribution 4.0 licence. Any further distribution of this work must maintain attribution to the author(s) and the title of the work, journal citation and DOI.
1. Introduction
In recent years several industries including aerospace, automotive, energy storage (separator) and biomedical have placed a strong emphasis on the development of new polymeric materials with enhanced mechanical/chemical and electrochemical properties [1–5]. Polyurethane (PU), a flexible polymer, has emerged as a promising candidate for such applications because of its extraordinary features, such as great flexibility, outstanding abrasion resistance, and strong chemical stability [6]. Despite all these advantages, pure PU exhibits low tensile strength (≤20 MPa) and elastic modulus hampering its widespread deployment in engineering applications which prompted researchers to investigate novel techniques for improving its mechanical properties [7–10].
The insertion of various nanofillers (e.g., graphene, MoS2, CNTs WS2) at ∼0.5 wt% into polymeric matrices have been regarded as a particularly promising strategy because of considerable improvement in the mechanical, creep and physical properties of base polymers have been reported [2, 8, 11, 12]. Among them, carbon nanotubes (CNTs) have been widely employed in polymer matrices since their discovery by Lijima in 1991, owing to their excellent electrical and thermal conductivity [13, 14]. CNTs could be categorized into single-walled (SWCNTs), double-walled (DWCNTs), multi-walled (MWCNT) and functionalized carbon nanotubes (fCNTs) based on their structure, stacking layers and diameter [15]. For example, typical SWCNTs have greater electrical conductivity than multi-walled carbon nanotubes (MWCNTs). SWCNTs can exhibit electrical conductivities in the range of 104 to 106 S m−1. In comparison, MWCNTs typically have lower electrical conductivities, ranging from 102 to 104 S m−1. On the other hand, MWCNTs showcase extraordinary mechanical and thermal properties because of their one-dimensional nanostructure arrangement [6, 16, 17]. Concentric layers are piled in a tubular configuration to generate MWCNTs, which have an excellent tensile strength (∼150 GPa), a high aspect ratio ranging from 10:1∼1000:1, and exceptional stiffness [18]. In addition, MWCNTs have a diameter that varies from 1.4 nm to 100 nm and an elasticity modulus of 270 GPa and 1 TPa, respectively [19–22], making them more appealing to be utilized in polymeric matrices to enhance the mechanical properties. Numerous attempts have been undertaken to investigate the influence of MWCNTs incorporation on the physio-mechanical characteristics of nanocomposites. For instance, Turaka and coworkers [23] studied the impact of MWCNTs, graphene nanoparticles (GNPs) and their hybrid combination at various weight fractions (0.1 wt% ∼ 0.3 wt%) in glass/epoxy nanocomposites. The findings showed that the flexural strength, modulus, and interlaminar shear strength (ILSS) were greatly enhanced by 62%, 205%, and 298%, respectively, when compared to pure glass/epoxy resin. Prabhakaran and coworkers reported an enhancement in the mechanical properties of unstitched plain weave/polyester resin composites and biaxial non-crimp/polyester composites upon the incorporation of multi-walled carbon nanotubes (MWCNTs), as compared to composites made just from neat polyester resin [24]. Rong and coworkers successfully prepared nanocomposites of poly-ether-ether-ketone and 5 wt% MWCNTs resulted in a 20% increase in Young's modulus and a 3% increase in the tensile strength, respectively [25]. Despite extensive research on MWCNT-reinforced polymeric nanocomposites, the specific impact of MWCNT incorporation on the tensile properties of polyurethane (PU) based nanocomposites has not been well studied. Existing literature primarily focuses on other polymer matrices, such as epoxy and polypropylene, poly-ether-ether-ketone, and polystyrene. Hence, the investigation of the mechanical properties of MWCNTs-PU nanocomposites remains a formidable task for researchers. The potential method by which multi-walled carbon nanotubes (MWCNTs) enhance the mechanical properties of polyurethane nanocomposites is believed to be through load transmission facilitated by strong interfacial bonding and the restriction of polymer chain mobility. The utilization of multi-walled carbon nanotubes (MWCNTs) in polyurethane (PU)-based composites may facilitate efficient transmission of load due to their high aspect ratio and strength, hence resulting in enhancements in both tensile strength and modulus. Therefore, the primary aim of this research is to examine the impact of integrating multi-walled carbon nanotubes (MWCNTs) into polyurethane (PU) matrices on the tensile characteristics of the resultant nanocomposites. Additionally, this study investigates the influence of MWCNT filtration on the tensile characteristics of polyurethane (PU) nanocomposites.
2. Experimental section
2.1. Raw material
Polyurethane (PU; granules) and multiwalled carbon nanotubes (MWCNTs; BET surface area: ∼220 m2 g−1) with bulk density of ∼0.23 g cm−3 and average tube size: 0.5∼20 μm (L) were purchased from Sigma Aldrich Pvt Ltd and American elements Ltd, respectively. Tetrahydrofuran (THF; anhydrous, ≥99.9%) was provided by Sigma Aldrich Pvt Ltd and used as a solvent for the preparation of polyurethane solution and for the dispersion of MWCNTs.
2.2. Preparation of polyurethane solution
To fabricate the nanocomposites, a solution of PU was prepared separately in glass vial of 100 ml. Typically, 5 g of pristine PU granules were dissolved in 100 ml of tetrahydrofuran (THF, purity ≥99.9%) solvent by stirring (VELP Scientifica) for ∼40 min at room temperature (25 °C). The obtained clear PU solution was used for the preparation of PU+MWCNTs nanocomposites.
2.3. Preparation of MWCNTs solution and nanocomposites
To incorporate the filtered/unfiltered MWCNTs into nanocomposite samples, MWCNTs dispersion is prepared separately in glass vial of 100 ml. Typically, 100 mg of MWCNTs were mixed with 100 ml tetrahydrofuran (THF) solvent and blended for ∼40 min with magnetic stirring at room temperature (25 °C) to achieve uniform dispersion. Then, dispersion is filtered using 0.22 μm thick nylon filter paper using a vacuum filtration flask. Some 82.7 mg of filtered MWCNTs in powder form were obtained. Then, the obtained MWCNTs on the filter paper were dried using an electric oven (DZF-6000, Standhill) at a high temperature of 150 °C for 12 h and dispersed again in 100 ml of THF solvent. The dispersion was sonicated for 2 h at the temperature (25 °C) using a bath (DSA50-Sk1,1.81 L capacity) at a frequency of 45 k Hz to ensure uniform dispersion. The dispersed MWCNTs were then added into the PU polymer matrix according to desired weight concentrations (table 1). The sample weight (100 g) of the solid PU-x wt% of MWCNTs (x = 0, 0.1, 0.5, 1) composite after 24-hour natural drying at room temperature (25 °C) is maintained constant. Therefore, as the weight proportion of MWCNTs increases, the PU polymer matrix is counterbalanced to maintain the sample weight constant. This approach is in accordance with the previously published reports [2, 4, 21, 26]. For comparison of tensile properties, the dispersed MWCNTs without filtration were also incorporated into the polyurethane (PU) solution (50 mg ml−1) to develop the nanocomposites. Figure 1 represents the complete flow of processes involved in fabricating the nanocomposites with and without filtration of MWCNTs for tensile measurement.
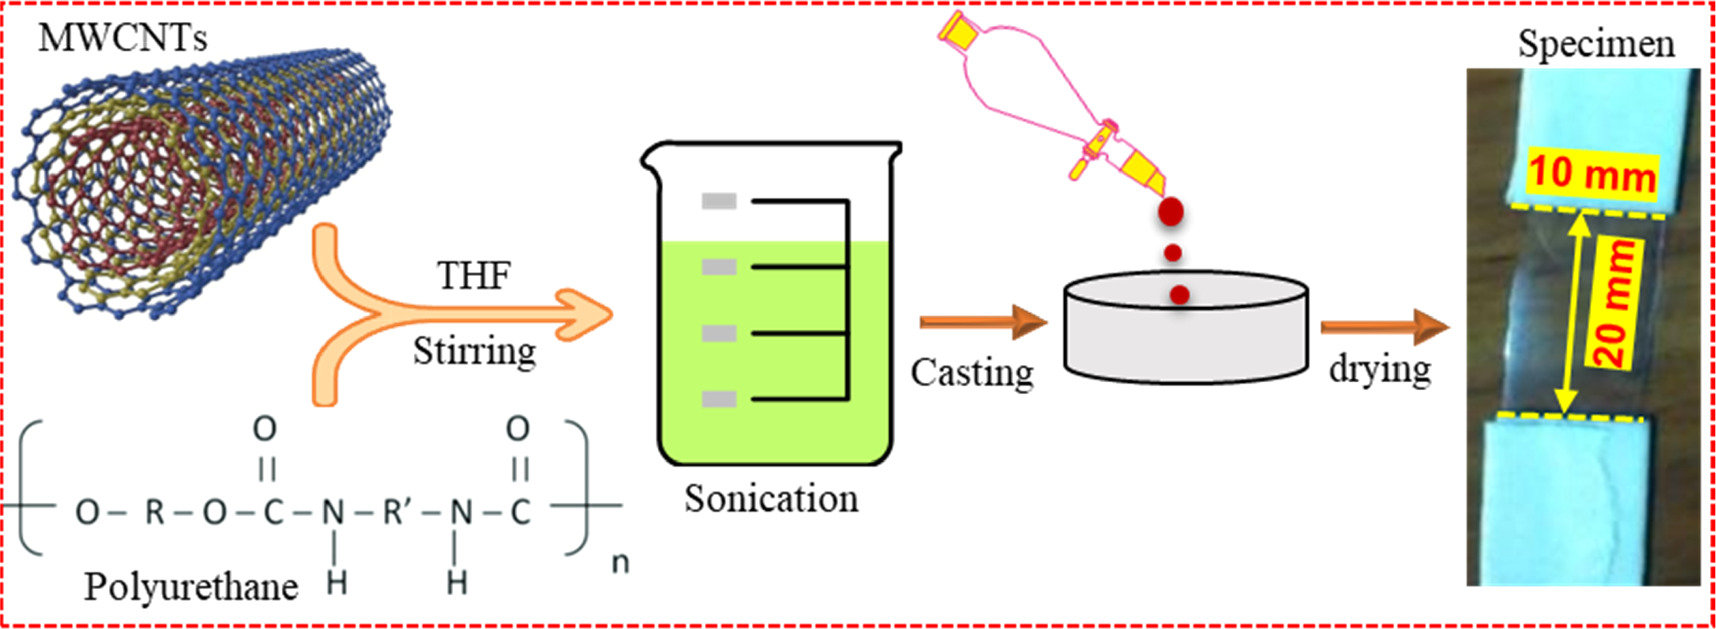
Figure 1. Schematic diagram for preparation of specimen for tensile testing.
Download figure:
Standard image High-resolution imageTable 1. Concentrations of Polyurethane and MWCNTs.
| Sr No. | Nomenclature | Wt.% of Polyurethane | Wt.% of MWCNTs |
|---|---|---|---|
| 1 | Pure polyurethane | 100 | 0 |
| 2 | PU+ wt.0.1% MWCNTs | 99.9 | 0.1 |
| 3 | PU+ wt.0.5% MWCNTs | 99.5 | 0.5 |
| 4 | PU+ wt.1% MWCNTs) | 99 | 1 |
2.4. Preparation of specimen for tensile testing
The tensile specimen was fabricated using a solution casting technique. The PU solution and filtered/unfiltered MWCNTs were mixed (desired ratio) and sonicated for 2 h to ensure the uniform mixing of MWCNTs in the polymeric composite samples. An extra 2 ml THF solvent is also added to further dilute the composite solution and facilitate incorporation of MWCNTs into the polymer matrix [26]. Then, the solution containing PU+ x wt% of MWCNTs (x = 0, 0.1, 0.5, 1) was cast in petri dishes and kept for natural drying at room temperature (25 °C) overnight. Afterwards, the solid polymeric nanocomposite samples were obtained and cut into 20 mm (length) and 10 mm (width) for tensile testing. The complete fabrication process is shown in the schematic (figure 2). Three specimens of each concentration were fabricated for tensile testing to ensure the repeatability of results, as discussed in the subsequent sections.
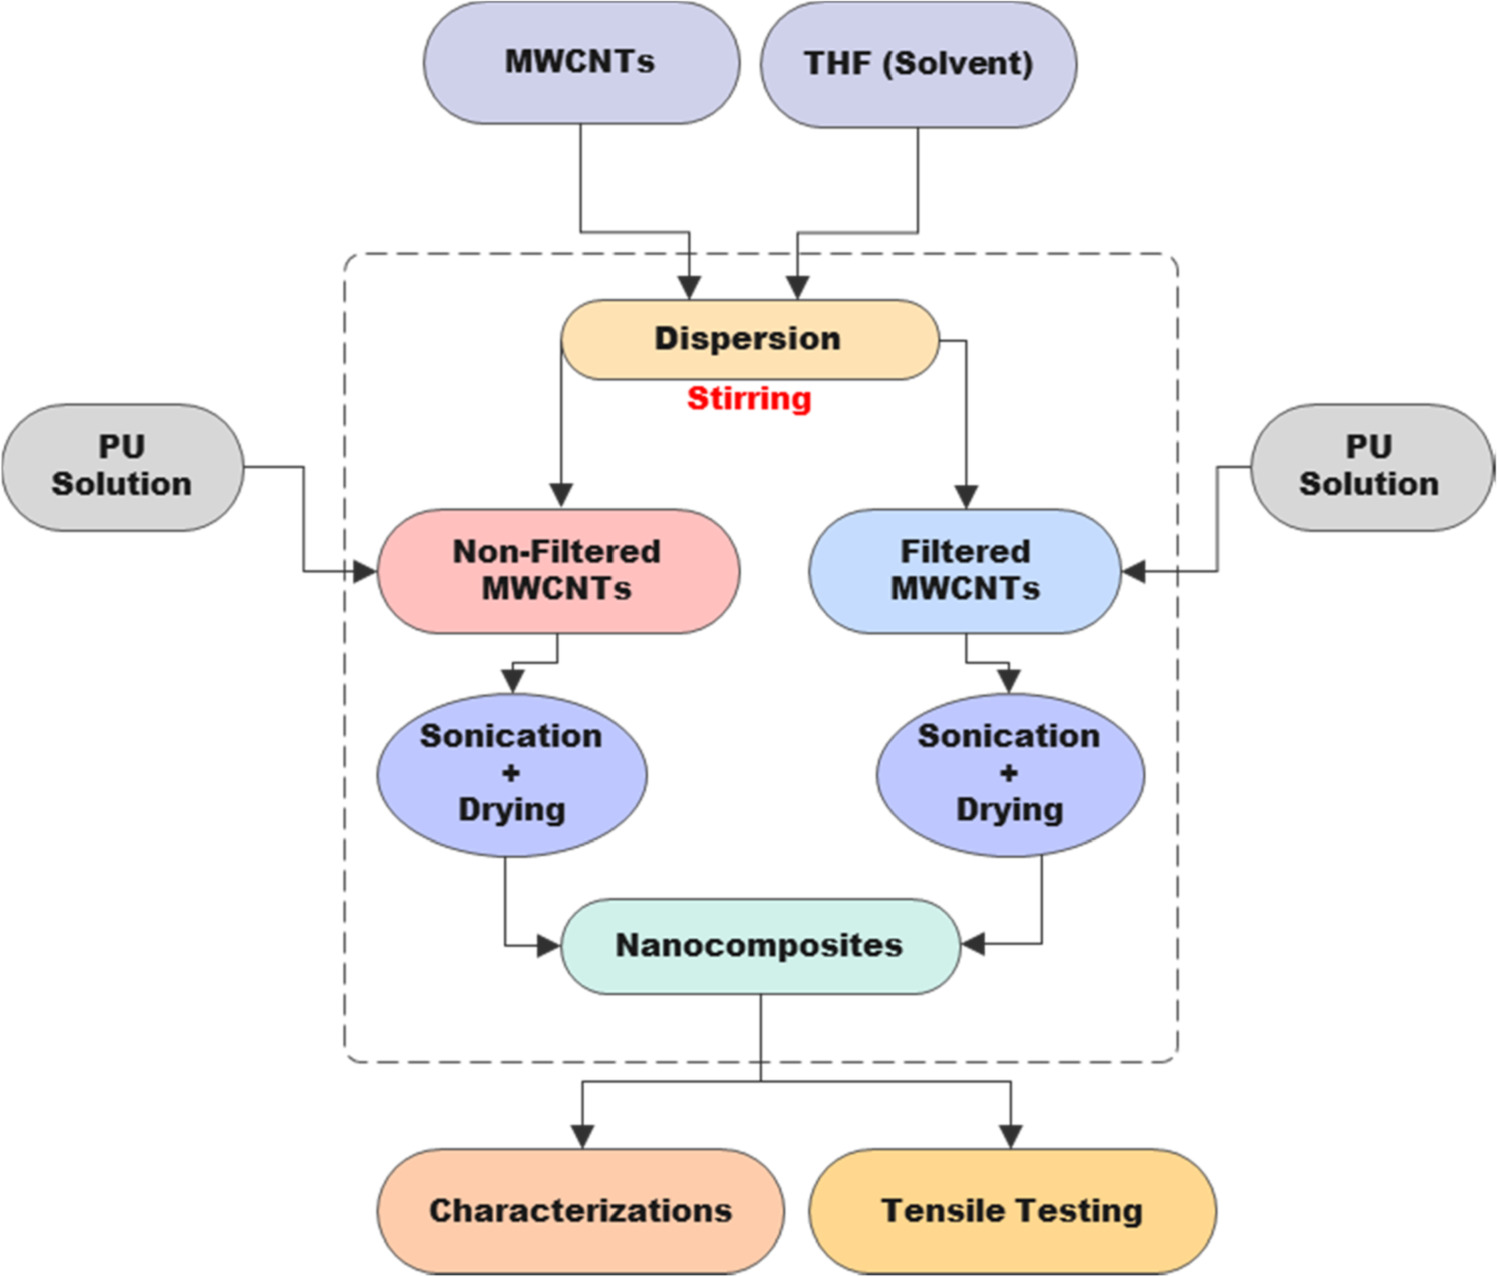
Figure 2. Flow chart of producing nanocomposites with and without filtration of MWCNTs.
Download figure:
Standard image High-resolution image3. Microstructural characterization
The morphology of MWCNTs and cross-sectional views of prepared nanocomposites samples were provided by Scanning electron microscopy (SEM; TESCAN VEGA3) operated at 20 kV accelerating voltage. X-ray diffraction patterns (XRD) with a Cu Kα radiation (λ = 0.154 nm) were obtained at 2θ = 0∼80° with the speed of 5° min−1 to understand the crystalline structure of a material by using a diffractometer (Rigaku smart lab). The Raman spectrometer (Renishaw Micro-Raman Spectroscopy) with 532 nm laser the excitation source is utilized to measure the carbon structures. Thermal stability of PU and PU + 0.5 wt% of MWCNTs (filtered/unfiltered) nanocomposites were measured with a Thermogravimetric analyzer / Differential Scanning Calorimeter (Mettler Toledo TGA/DSC3+) in air environment with a ramp of 1 °C min−1. The oxidation states and chemical composition is characterized by an x-ray photoelectron spectrometer (XPS, Thermo Scientific Nexsa). To measure the tensile properties specimen of 20 mm (length) x 10 mm (width) x < 0.05 mm (thickness) were fabricated. Tensile testing was conducted on a universal testing machine (UTM) SHIMADZU (Screwed AG-X 100KN) operated with the trapezium-X user interface. Specimen was tested with a feed rate of 10 mm min−1. The maximum force of the universal testing machine employed in this study is 100 KN. All the measurements were repeated three times and average values were used to ensure the reproducibility of experimental results.
4. Results and discussions
The Raman shift of filtered MWCNTs from 500 cm−1 to 3000 cm−1 is presented in figure 3(a). It validates the sp3 defects of carbon (D-band) at a wavelength of 1348 cm−1. The in-plane tangential stretching of C–C bonds in carbon shells (Sp2 defects of carbon atoms) may be responsible for the appearance of the G band located at 1590 cm–1. Another D' band can be found at ∼1500 cm−1, which could be attributed to amorphous bonded forms. The 2D peak can be found at ∼2677 cm−1, and it is the second order of mode of the D peak [27]. Singular-walled carbon nanotube (SWNT) diameters have been extensively measured using radial breathing mode (RBM), which is specific to cylindrical symmetry in Raman spectra. One might anticipate seeing the RBMs from MWNTs since an ideal MWNT is thought to be composed of several coaxial SWNTs with progressively larger diameters centered around a common axis. Thus, RBM band in MWCNTs (figure 3(a)) provides valuable information about the diameter distribution and structural characteristics of the nanotubes. Our results are well consistent with published literature about RBM mode in MWCNTs [28].

Figure 3. (a) Raman spectrum purified MWCNTs; (b) XRD Pattern of PU, PU+0.5 wt% of MWCNTs (filtered and filtered).
Download figure:
Standard image High-resolution imageThe x-ray diffraction (XRD) pattern of the pure PU and PU+ 0.5 wt% MWCNTs is displayed in figure 3(b). The peak intensity in arbitrary units (i.e., a. u.) with respect to two theta led to the presence of MWCNTs in the nanocomposite while the planes indicating the polyurethane presence in the fabricated samples. Two broad peaks at ∼18.7° and 41.7° were detected in the pure polyurethane spectrum, which shows a typical pattern with less crystallinity of polymer (PU). Following the preparation of the nanocomposite, both samples (PU + 0.5 wt% of MWCNTs, filtered and unfiltered) showed identical XRD pattern without any significant peak shift. This indicates that the addition of MWCNTs, both filtered and unfiltered, did not alter the structure but decreased the crystallinity of the base polymer, and that interaction between the polymer and the nanotubes may help to improve the mechanical properties, such as the modulus of elasticity (E), percentage elongation, and ultimate tensile strength (UTS), as will be seen in the following sections.
X-ray photoelectron spectroscopy (XPS) was utilized to investigate the surface chemistry as well as the chemical composition of filtered MWCNTs in a very thin layer, about 2 ∼ 5 nm from the top of the sample surface. Figure 4(a) displays the XPS survey spectrum of pure PU and nanocomposites (PU + 0.5 wt% of MWCNTs). Two characteristic peaks at around 283.3 eV and 532.5 eV correspond to C1s and O1s respectively, evident from both pure PU (pristine) and nanocomposites samples. It confirms the successful formation of polymeric nanocomposite. Furthermore, the high-resolution spectra of C1s and O1s are presented in figures 4(b), (c). In C1s deconvoluted high resolution spectra (figure 4(b)), the main peak at around ∼284.5 eV, which could be attributed to sp2 hybridized carbon atoms existing in MWCNTs structure. Another prominent peak exhibited at around ∼285.2 eV might be ascribed to the sp3 C–C bond, which represents defects in the conjugated rings of the MWCNTs in the PU + 0.5 wt% MWCNTs (filtered) samples. The peak at around ∼289.4 could depict the corresponding carboxyl groups (O–C=O) in the filtered MWCNTs. In addition, high resolution spectra of O1s illustrated the bonds of C=O, C–O and O–C=O at around ∼532 eV, 532.6 eV and 533.1 eV, respectively (figure 4(c)), which also indicate the existence of carbonyl, ether/alcohol, and carboxyl groups on MWCNTs surface. It elucidates that all functional groups existing in nanocomposites are beneficial to achieve superior mechanical properties of PU+MWCNTs nanocomposites.
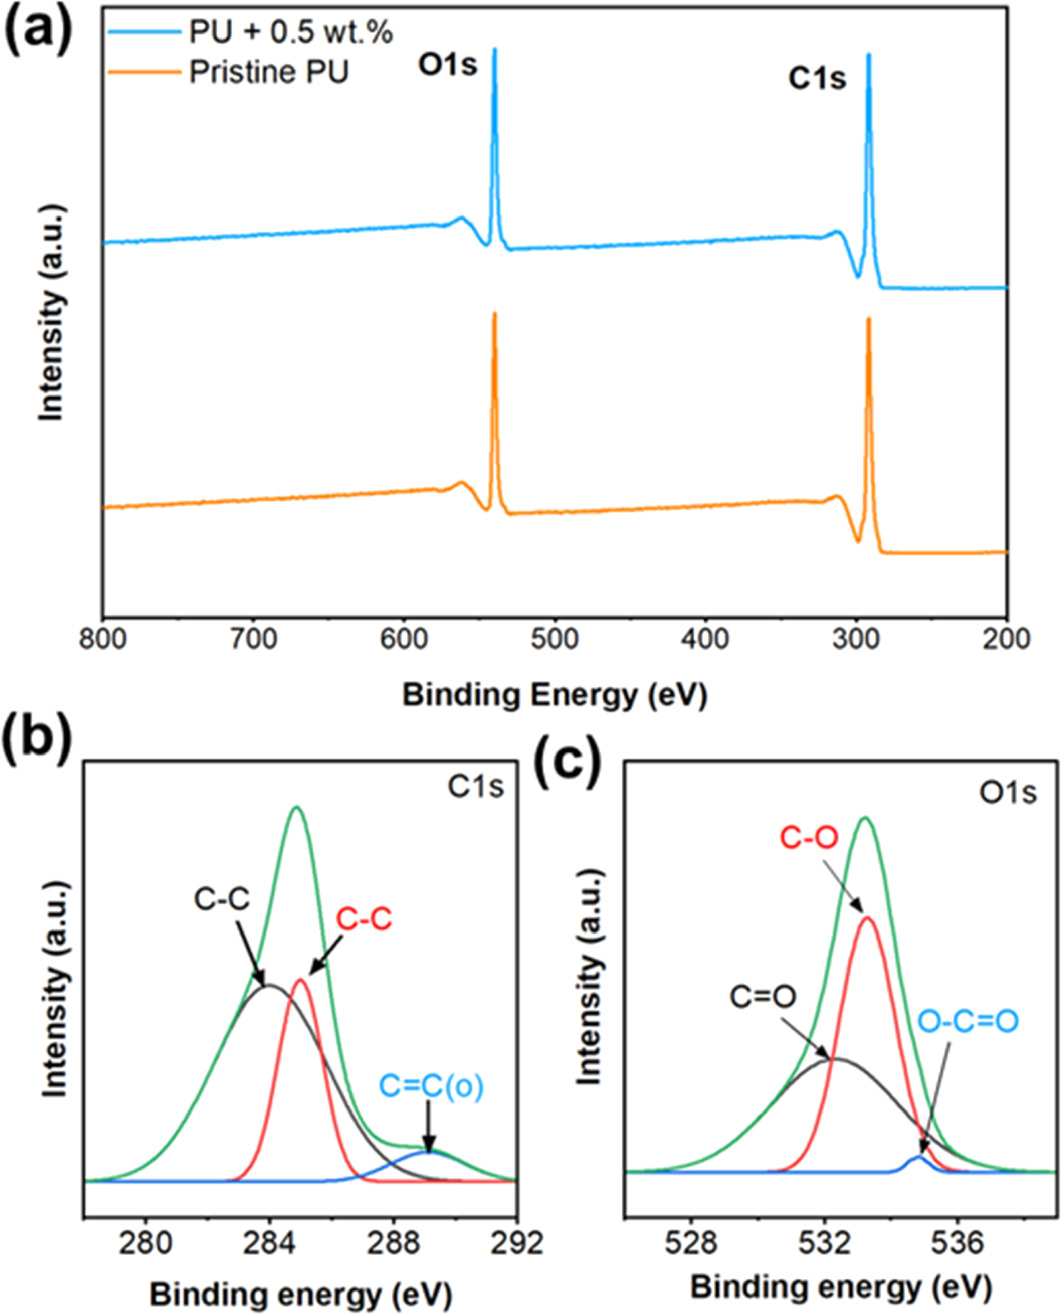
Figure 4. (a) XPS spectrum analysis of PU and PU+0.5 wt% of MWCNTs; (b) High resolution spectrum of C1s; (c) High resolution spectrum of O1s.
Download figure:
Standard image High-resolution imageIn addition, thermogravimetric analysis (TGA) was utilized to evaluate the thermal stability of PU nanocomposites that contained 0.5 wt% of nanofillers (i.e., filtered and unfiltered MWCNTs). Pristine PU underwent two stages of thermal degradation. The initial stage of PU degradation was the decomposition of the urethane linkage (–HN–COO–) to the initial polyol and isocyanate. The polyols and diisocyanates then began their respective decompositions.
Notably, the nanocomposite samples exhibited enhanced thermal stability when the concentration of filtered multi-walled carbon nanotubes (MWCNT) was 0.5% by weight. It is worth mentioning that the thermal stability of PU composites containing 0.5 wt% of MWCNTs (filtered) is superior to those of pure PU and PU + 0.5 wt% of MWCNTs (unfiltered) samples (figure 5). Filtered MWCNTs filler uniformly interacted with the PU molecular structure, as evidenced by the fact that their addition delays the thermal degradation of the PU matrix. There was a significant increase in the temperature of PU + 0.5 wt% of MWCNTs nanocomposites where the complete degradation temperature reaches over 500 °C. However, pure PU decomposed at 300 °C and completed degradation at 440 °C. The formation and stabilization of the MWCNTs bonded macroradicals, as well as the homogeneous dispersion of MWCNTs were the main factors for enhancement of the thermal stability of PU + 0.5 wt% MWCNTs (filtered) nanocomposites.

Figure 5. TGA curve of pure PU (without MWCNTs) and PU + 0.5 wt% of MWCNTs nanocomposite.
Download figure:
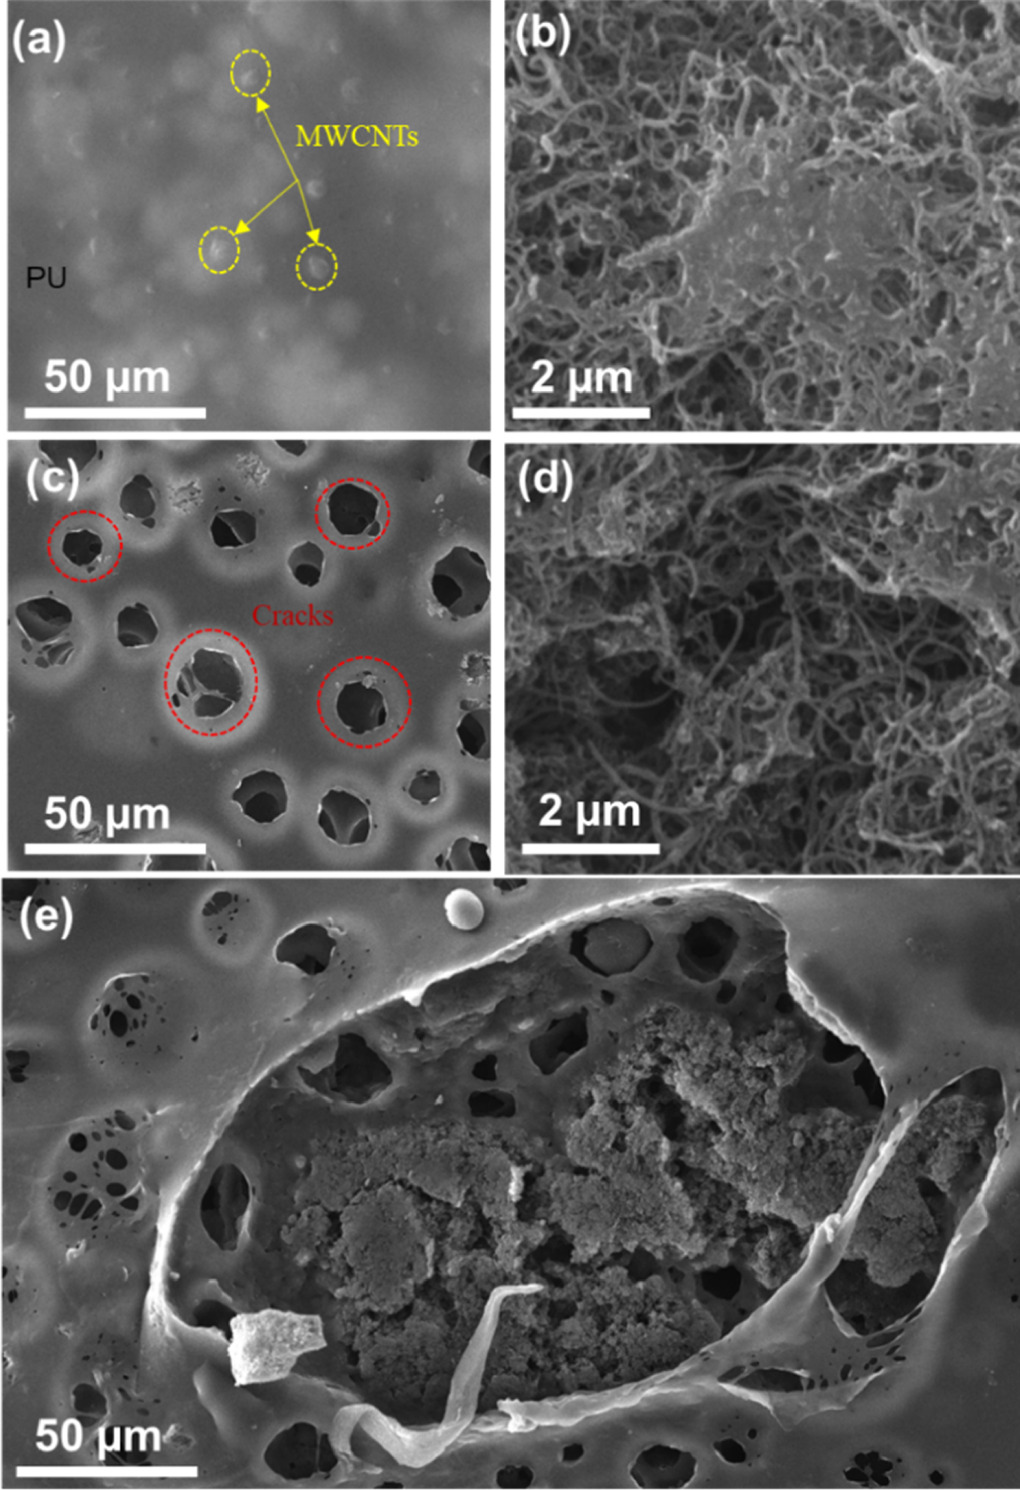
Standard image High-resolution imageSEM images at varying magnifications confirmed the nanotube morphology of filtered MWCNTs (figures 6(a), (b)). Clusters of MWCNTs were present, and those were subsequently incorporated into PU matrix to prepare nanocomposites. The SEM images of polyurethane/MWCNTs nanocomposites at different filler concentrations are shown in figure S1. The analysis of energy dispersive x-ray (EDX) spectra confirms the existence of oxygen and carbon in the MWCNTs and nanocomposites. Furthermore, carbon and oxygen are evenly distributed as shown in the EDX elemental mapping (figures 6(c)–(e)). A low-magnification cross-sectional image of PU + 0.5 wt% of unfiltered MWCNTs nanocomposites indicates the successful incorporation of MWCNTs into polymer matrix (figure 6(f)). High-magnification cross-sectional image reveals that the prepared sample thickness (i.e., PU + 0.5 wt% of unfiltered MWCNTs) is ∼59 μm (figure 6(g)). This estimated value is consistent with the measured value of thickness of fabricated samples, which were tested at UTM to measure the tensile properties of PU + MWCNTs samples.

Figure 6. (a), (b) SEM images of filtered MWCNTs; (b) EDX area spectrum of filtered MWCNTs (c)–(d) Cross-sectional view prepared solid sample of PU+ 0.5 wt% of unfiltered MWCNTs nanocomposites
Download figure:
Standard image High-resolution image4.1. Stress–strain curve
The stress–strain curves of pure PU and PU with variable concentrations (x = 0.1, 0.5, 1 wt%) of MWCNTs (filtered or/and unfiltered) showed clear evidence of a change in the tensile properties of pure polymer matrices (figures 7, S2). It should be noted that the stress and strain curves peaked at 14.11 MPa and 5.5%, respectively, in pure PU samples is significantly lower than PU + x wt% of MWCNTs (x = 0.1, 0.5, 1, filtered). The surging trend is observed in stress–strain curves with the increase of MWCNTs (filtered) concentration in the nanocomposite samples. Table 2 lists the stress (N mm−2) and strain (%) values of the tested PU+MWCNTs nanocomposite specimens with and without filtration of MWCNTs. It can be seen that the stress (9.11289 N mm−2) and strain (414.230%) value of the PU+ unfiltered MWCNTs composite sample is comparatively lower than pure PU at 0.1 wt% of filtered MWCNTs. This decrease could be attributed to surface cracks of samples originated from the poor interfacial bonding of unfiltered MWCNTs with polymer matrix because of impurities. Furthermore, these stress–strain graphs could be used to approximately estimate the elongation at break (% elongation), Modulus of Elasticity (E), and ultimate tensile strength (UTS), which are discussed in the following sections. The addition of MWCNTs is linked to the tensile properties of PU, as evidenced by the increasing trend of the stress–strain curves. Pure PU exhibits enhanced mechanical properties (stress, strain) in proportion to the amount of filtered MWCNTs present. Both the uniform distribution of MWCNTs and the strong adhesion between PU and MWCNTs may be responsible for this. It is important to note that filtered MWCNTs improved the area under the elastic region of stress–strain diagram compared to non-filtered WMCNTs (figures 7, S1). These findings corroborate previous research showing that MWCNTs and other nanomaterials (graphene, MoS2) successfully interact with polymer matrices to distribute tensile loads over longer times [2, 8, 16, 24, 26, 29].

Figure 7. Stress–strain diagram of Polyurethane/MWCNTs (filtered) nanocomposites.
Download figure:
Standard image High-resolution imageTable 2. Stress–strain values with and without filtration of MWCNTs.
| Specimens | Stress (N mm−2) | Strain (%) |
|---|---|---|
| With filtration | ||
| Pure Polyurethane | 14.1197 | 504.455 |
| PU+ 0.1 wt. % MWCNTs | 15.2010 | 553.223 |
| PU+ 0.5 wt. % MWCNTs | 18.1516 | 623.989 |
| PU+ 1 wt. % MWCNTs | 19.2551 | 700.229 |
| Without filtration | ||
| PU | 14.1197 | 504.455 |
| PU+ 0.1 wt. % MWCNTs | 9.11289 | 414.230 |
| PU+ 0.5 wt. % MWCNTs | 10.0136 | 553.872 |
4.2. Percentage elongation
Both the filtered and unfiltered concentrations of MWCNTs have a considerable impact on the values of percent elongation of nanocomposites (PU + x wt% of MWCNTs; x = 0, 0.1, 0.5). Figure 8 depicts the incremental increase (0, 0.1, 0.5 wt%) in the concentration of filtered MWCNTs in pure PU. As a result, the percentage elongation of nanocomposites increased significantly. The maximum percentage elongation of ∼128.07% was achieved at a 0.5 wt% of filtered MWCNTs. In comparison, percentage elongation by adding the concentration of MWCNTs without filtration is also measured. The results revealed percentage elongation remained lower compared to filtered MWCNTS. Typically, at 0.1 wt% of MWCNTs (unfiltered) exhibited percentage elongation (∼108.59%), which is comparatively lesser than ∼113.52% for filtered MWCNTs. The increase in mechanical properties resulted from intense interfacial contact between polymer chains and filler (MWCNTs, filtered) accompanied by adequate scattering/dispersion in the polymer matrix. These results are consistent with published literature reports [4].

Figure 8. Effect of addition of MWCNTs on (a) Percentage elongation (b) Modulus of elasticity (E).
Download figure:
Standard image High-resolution image4.3. Modulus of elasticity (E)
Young's modulus is a measurement of the resistance of an object in opposition to the distortion when the pressure is applied to it. The column chart in figure 8(b) shows that the modulus of elasticity is changing considerably by adding the various concentrations (0 wt%, 0.1 wt% and 0.5 wt%) of MWCNTs (filtered). Additionally, the column chart indicates that the highest stress value of composite (PU+ 0.5 wt% MWCNTs, filtered) reaches 0.035 N mm−2. This value is ∼25% greater than bare samples (PU). In comparison to pure PU, the modulus of elasticity also increased gradually when various concentrations (0.1 wt% and 0.5 wt%) of MWCNTs were added to polymer matrix (Pure PU polymer) without filtration. The maximum value of 0.03 N mm−2 at the 0.5 wt% of MWNCTs (unfiltered) is attained, which is ∼14% lesser than that of filtered MWCNTs based nanocomposites (PU+ 0.5 wt% of filtered MWCNTs). Cracks on the surface of unfiltered MWCNTs-based nanocomposites create uncontrolled fluctuations in the stress and strain, which is the main reason for a low modulus of elasticity. These findings indicate although modulus value is increasing with the addition of unfiltered MWCNTs, but the filtration has a more positive impact on the mechanical properties. It could be attributed to robust interfacial interaction between the polymer matrix and filtered MWCNTs is evidenced by the smooth surface and absence of cracks in the nanocomposite samples.
4.4. Ultimate tensile strength
Figures 9(a), (b) depicts the comparison of ultimate tensile strength (UTS) of PU + x wt% of MWCNTs (x = 0.1, 0.5) with and without filtration. Both filtered and unfiltered MWCNTs displayed a positive impact of UTS as compared to pure PU based nanocomposites. It can be seen that PU+ filtered MWCNTs exhibited the highest value of UTS (∼18.1516 N mm−2) at 0.5 wt% of MWCNTs. In comparison, PU+ unfiltered MWCNTs could display ∼15.0136 N mm−2 at corresponding filler loading comparable to the published reports [30, 31].

Figure 9. Measurement of ultimate tensile strength with the addition of MWCNTs (a) Filtered (b) without filtration.
Download figure:
Standard image High-resolution imageIt is worth mentioning that filtered MWCNTs enable the composites to achieve ∼20% superior UTS value in comparison of unfiltered MWCNTs composites. Pure PU was able to achieve ∼14.1197 N mm−2, which is ∼28% and ∼6% inferior to the filtered MWCNTs and unfiltered MWCNTs, respectively. As for as interaction mechanism is concerned, after incorporation of filtered MWCNTs, the polymeric chains become straight and applied load bearing capability is increased, consistent with published literature [4, 26, 32]. Thus, enhanced mechanical properties are obtained. The primary reason for the inferior UTS value of filtered MWCNTs could be poor interfacial bonding, agglomeration of MWCNTs, and surface cracks originating from the present impurities.
4.5. Postmortem analysis
In order to further investigate the morphological variations induced by tensile testing, SEM images of specimens with filtered and unfiltered PU + x wt% of MWCNTs (x = 0.5) nanocomposites (broken samples) have been shown in the figures 10(a)–(e). It is worth noting that MWCNTs are uniformly distributed in the samples PU + x wt% of MWCNTs (x = 0.5, filtered) indicating the better interaction of MWCNTs with base polymer matrix leading the higher mechanical properties (figures 10(a), (b)). In addition, smooth morphology of PU + x wt% of filtered MWCNTs (x = 0.5) nanocomposite could be evident in the broken samples after removing the tensile load. High resolution image of SEM clearly shows filtered MWCNTs were present and effectively interacting with polymer matrix to share to the applied load. In contrast, noticeable cracks are originated on the surface of PU + x wt% of unfiltered MWCNTs (x = 0.5) nanocomposites. Poor interaction of unfiltered MWCNTs and PU could be a primary reason for the early failure of composite materials (figures 10(c), (d)). These might be because of poor dispersion of unfiltered MWCNTs in the composite material and not interacting properly with polymer matrix. Figure 10(e) shows a very big crack on the surface of PU + x wt% of unfiltered MWCNTs (x = 0.5) which could not share the tensile load during tensile testing and polymeric nanocomposite undergone early failure.
Figure 10. (a), (b) SEM image of PU + x wt% of filtered MWCNTs (x = 0.5) nanocomposite after tensile testing; (b)–(d) SEM image of PU + x wt% of unfiltered MWCNTs (x = 0.5) after tensile testing; (e) SEM image of crack causing failure of PU + x wt% of unfiltered MWCNTs (x = 0.5) nanocomposites.
Download figure:
Standard image High-resolution image
5. Conclusion
In this study, multi-walled carbon nanotubes (filtered/unfiltered) were successfully incorporated into polymer matrix (polyurethane) to fabricate nanocomposite (PU + x wt% MWCNTs; x = 0∼0.5 wt%) materials. Mechanical properties including modulus of elasticity (E), ultimate tensile strength, and percentage elongation have been measured from tensile tests. The morphology, crystal structure, phase, thermal stability, and oxidation states of the materials were characterized by scanning electron microscopy (SEM), x-ray diffraction (XRD), Raman spectroscopy, thermogravimetric analysis (TGA), and x-rays photoelectron spectroscopy (XPS), respectively. MWCNTs with a greater percentage of carbon by weight exhibited improved mechanical characteristics compared to the basic polymer (PU). The sample containing 1 wt% carbon nanotubes and 99 wt% polyurethane demonstrated increased stress of 19.25 N mm−2 and strain of 700.22%, respectively. When comparing nanocomposites that include unfiltered multi-walled carbon nanotubes (MWCNTs) to those that include filtered MWCNTs, it was shown that the latter exhibited enhanced mechanical properties. By including 0.5% filtered MWCNTs into a polymer matrix, the modulus of elasticity (∼25%), ultimate tensile strength (∼21%), and elongation at fracture (∼11%) are enhanced. The exceptional mechanical properties of these nanocomposites can be due to the superior dispersion, interfacial bonding, and structural stability of filtered MWCNTs.
Data availability statement
The data that support the findings of this study are available upon reasonable request from the authors.
Conflict of interest statement
The Authors have declared that they have no conflicts of interest.
Authorship contribution statement
1. Ghulam Abbas Gohar: formal analysis, methodology, review-editing, writing-original draft.
2. Awais Akhtar: formal analysis, methodology, review-editing, writing-original draft.
3. Hassan Raza: conceptualization, formal analysis, methodology, review-editing.
4. Ghulam Mustafa: formal analysis, review-editing.
5. Mahreen Fatima: formal analysis, review-editing.
6. Habib Ur Rehman: data curation, formal analysis.
7. Muhammad Waqas Aslam: data curation, methodology.
8. Abrar Ul Haq: data curation, formal analysis.
9. Waqar Manzoor: data curation, methodology.
Supplementary data (0.1 MB PDF)