
Abstract
Under different plasma conditions and electric fields in a complex plasma the plasma particles organize themselves in a string-like or chain-like manner. A phase transition from string-like to an isotropic particle distribution is observed at different electrical conditions. The streaming of charged ions around plasma particles with the surrounding electric field gives the plasma its electrorheological properties. The visibility of individual particles in a complex plasma opens up the opportunity to examine properties and phase transitions of such electrorheological fluids in detail. Because of the limited one-dimensional symmetry, determining the configuration of a particle and recognizing strings in particle distributions is not always straightforward. Several approaches have already been used to analyse particle clouds while either considering each particle locally or considering the particle cloud as a whole without providing information about single particle configurations. This paper presents a new machine learning approach that takes advantage of particle distributions over the entire particle cloud and detects all string-like particles at once, using a convolutional neural network in form of an encoder-decoder network with asymmetric kernel convolutions. This not only enhances the result quality but also accelerates the evaluation process, possibly enabling real-time analyses on electrorheological phase transitions, while achieving an accuracy of over 95% on manually labelled data.
Export citation and abstract BibTeX RIS

Original content from this work may be used under the terms of the Creative Commons Attribution 4.0 license. Any further distribution of this work must maintain attribution to the author(s) and the title of the work, journal citation and DOI.
1. Introduction
When micron size monodisperse particles are introduced to a plasma, a complex plasma is formed and the particles interact with the electrons, ions and neutral gas atoms. With electrons being much hotter and therefore faster than ions and neutral gas atoms in low-temperature plasmas, that normally forms the background for complex plasmas, the high amount of electrons impacting on the injected particles charge them up negatively. Due to this charging effect long range Coulomb forces arise leading to strong interactions among the particles [1]. When illuminated with a laser particles in a thin two dimensional plane of the cloud are made visible and can be recorded with a camera. With particle distances of typically more than 100 µm single particles and their movements are resolvable. This strongly coupled system, therefore, is the basis for simulating many body systems for studying various physical fundamentals, such as convection flows [2], turbulence [3] and phase transitions between the liquid and crystalline state of matter [4].
The Plasmakristall-4 (PK-4) experiment is a setup, where such complex plasmas can be generated and investigated. It consists of a Π-shaped glass tube, which is evacuated and filled with a noble gas, such as Argon or Neon. Electrodes on either side of the glass tube exert a high-voltage electric field onto the low pressure noble gas, ionizing it partially and generating a low temperature plasma. Multiple particle injectors provide monodisperse particles to the plasma, creating the complex plasma. From the sides of the glass tube a planar focused laser illuminates a plane of particles in the plasma, which are then recorded by cameras. The electric field for plasma generation in this case is a DC field. The negatively charged particles, therefore, move according to the direction and strength of this field. To stop the movement of particles in the field of view of the cameras, the DC field is turned into a high frequency AC field of around 1 kHz. This frequency is chosen to be high enough so that the heavy and inert particles cannot react to the fast changing fields and thus only experience the time averaged electric field, which is zero, while the smaller electrons are accelerated back and forth to further ionize neutral gas atoms and maintain stable plasma conditions. With particles in the field of view, several manipulation options, such as a ring electrode, radio frequency coils, a thermal element and a manipulation laser are available to exert disturbances onto the particles [5]. A sketch of the PK-4 experimental setup is shown in figure 1. Under laboratory conditions the particles tend to gather at the bottom of the plasma tube, since the gravitational force pulls them down. For an undisturbed and uniform distribution of particles these experiments are usually conducted under micro gravity at drop towers, parabolic flights or on the International Space Station.

Figure 1. This is a sketch of the PK-4 experimental setup provided by the Thoma research group of the JLU Giessen. The Π-shaped plasma tube, the particle observation cameras (xiQ/PO2) and the devices for manipulating the plasma particles are shown. D1 to D6 denote the different particle injectors to insert plasma particles.
Download figure:
Standard image High-resolution imageElectrorheological properties have been observed in complex plasmas [6]. An electrorheological fluid is a suspension of non-conducting particles in an isolating fluid. Applied external electric fields have a drastic influence of the fluids properties [7], as for instance the fluids viscosity can be increased by many orders of magnitude by increasing the external electric field. This is due to the arising attractive forces in the direction of the electric field. This process is generally very fast and reversible. Similar properties were observed in complex plasmas. In a DC electric field, electrons and ions move in accordance to the field in opposite directions. When particles in the plasma are levitated against gravity they create a wake potential in the ion flow with several minima and maxima [8]. This results in non-Hamiltonian attractive forces onto other particles located in this potential, since the force acts only onto the subsequent particle and not also in the other direction. Therefore, particles have a tendency to align in the direction of ion flow. When an AC electric field is applied in PK-4 to keep the plasma particles in the field of view of the cameras, an analogue alignment of particles takes place. With ion flows changing rapidly in direction, the time averaged wake potential of the now stationary particles is symmetric in the direction of electric field. A phase transition between isotropic and string-like configurations in these electrorheological plasmas has been observed when continuously changing the electric field from DC to AC [9].
To investigate phase transitions in electrorheological plasmas a determination method of the particles string-like configuration is needed. This determination is not trivial task. Several different approaches have already been made in this regard, using global measures like the anisotropic scaling index [6, 10, 11], or using local measures, such as the bond orientational order [12] or irreducible minkowski tensors [13], which all deliver insufficient results. A newer approach using machine learning [9] delivers much better results on local string-like detection. This paper presents a new and improved machine learning approach, providing even better string-like detection, while considering all particles on a global scale simultaneously and connecting particles that are forming a string.
2. Machine learning
Strings forming in a two dimensional image of particles are easy to identify with the bare eye. But when it comes to evaluating single particles, it is noticeable that it is very hard to decide on many particles. Especially, when not only clear strings or isotropy are present but a mixture of both. This is due to strings only showing a comparably weak symmetry. With only two neighbors that account for a particle being in a string compared to for example six neighbors in a hexagonal structure. The last particle at the end of a string even only has one neighbor that is defining it to be a part of the string. Other undefined fundamentals such as the minimum number of particles that are needed for a structure to be a string and the maximum connection angle for particles to still be part of a preceding string make decisions even harder. In some cases strings come together at the end which raises additional challenges for a correct differentiation. In addition, isotropic particle configurations partly consist of randomly arranged particles in short strings, which makes it hard to distinguish string formations from other formations. Exemplary images of such particle configurations are shown in figure 2 for visualisation. Therefore, analogue approaches in general face many difficulties. As already shown, machine learning is a promising way of overcoming these problems [9]. Additionally, strings in complex plasmas can often become lengthy, which is why local investigations focusing only on proximate surroundings of a particle ignore helpful information that could potentially be incorporated into the decision-making process. A global machine learning approach therefore shows great potential.

Figure 2. Exemplary images of real string-like and isotropic particle distributions. On the left a string-like particle configuration is visible. The red circles mark areas, where strings come together that make the string detection difficult for certain particles. On the right an isotropic particle configuration is visible with a string-like formation marked in red. Distinguishing a string in an isotropic configuration from randomly evenly spaced particles is challenging.
Download figure:
Standard image High-resolution imageTo realize this, an analogical method to [14] is chosen, where the original image is fed through a convolutional U-Net [15], that is trained to binarize the image. The neural network outputs a binary image of original size representing a mask, that shows, where the network found particles. This way, only the positions of these masks need to be read out to localize the particles. In a similar way, the neural network presented here uses an image of the entire particle cloud as input and outputs a binary mask. Hereby, the neural network masks all present strings and gives out an empty image, when no strings are present. Comparing the generated mask to all particle positions, the string-like or isotropic configuration of each particle can be easily read out. Furthermore, length and vertical elongation of each string can be analyzed.
2.1. Machine learning model
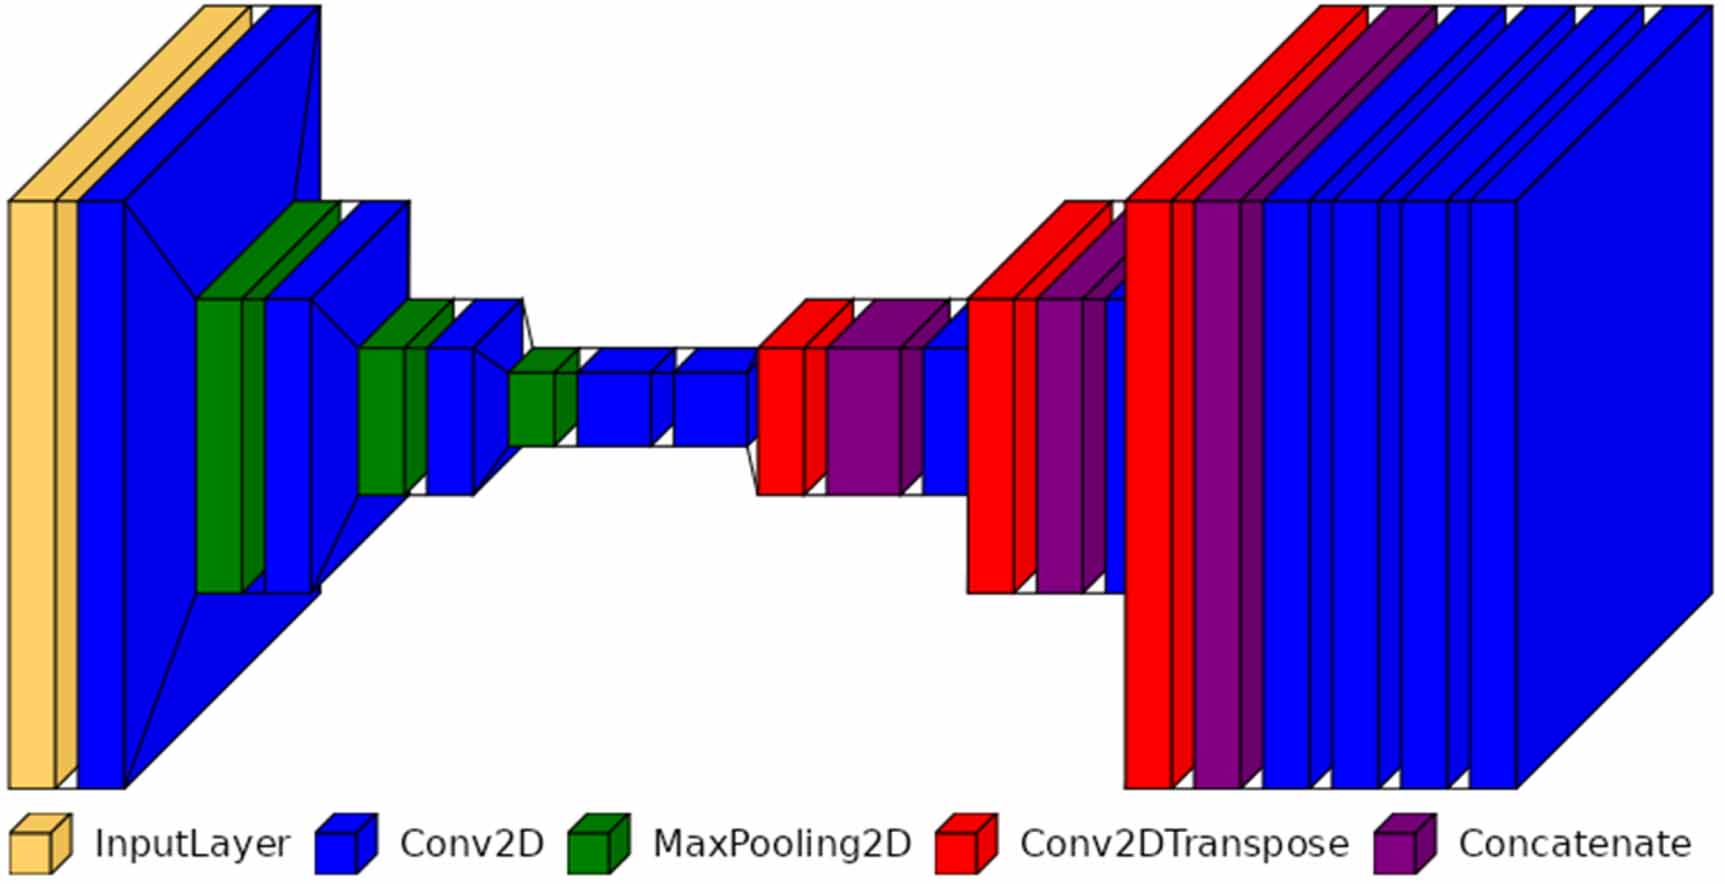
To achieve this binarization we make use of a fully convolutional network with an encoder-decoder architecture. The neural network is split up into two parts: an encoder and a decoder. The encoder constitutes the first part of the network and is designed to sample down the input to a certain degree. Afterwards, the input image is sampled back up to original size as seen in figure 3. This is meant to reduce the original image to just the necessary information that is needed. Using this information, the neural network is then able to reproduce a mask of the image highlighting all strings. To regain the positional information of the input image after downsampling, several forward concatenations are built into the model after each sampling step. The downsampling steps are realized by two dimensional convolutions, followed by activation functions, and finalized by two dimensional pooling layers. The upsampling is then realized by two dimensional convolutional layers, activation functions and followed by transposed two dimensional convolutional layers. These layers form the basis of a U-Net model [15].

Figure 3. Illustration of the neural network used for string detection created with [16]. The concatenation layers connect the preceding transpose layers with the foregoing convolutional layers of the same size.
Download figure:
Standard image High-resolution imageThe disadvantage of this U-Net is its immense size. With all downsampling steps the number of channels is increased, reaching a value of 1024. This is not just memory intensive but also computationally intensive and increases latency times of the neural network. Especially, when large images are fed through the network, large memory and computing resources are needed. The high amount of channels is not needed in this case and is therefore reduced starting with 4 channels for the first convolution, doubling in size every convolution until 32 channels are reached in the bottleneck of the network and then halving in size each convolution until 4 channels are reached for the last convolutions. This largely decreases the size of the network from 389 521 to 25 581 trainable parameters, while simultaneously decreasing latency times. Furthermore, all particle strings form in the direction of electric field, which in the case of PK-4 means, that all particle strings form horizontally. With these directed phenomena to be detected, asymmetric kernel sizes for convolution, deconvolution and pooling layers are deployed to account for this asymmetry and to get better results. Thus all kernel sizes are also elongated horizontally with decreasing kernel elongation towards the network constriction. This enables a broader activation of neurons to increase the recognition of strings. An illustration of the used neural network is shown in figure 3.
2.2. Training
The finalized convolutional network needs an appropriate training before being applicable. Sufficient training data is needed for training. In the case of this binarizing encoder-decoder network suitable training images with corresponding labels, in form of binary masks, are required. While enough real image data of complex plasmas with isotropic and string-like particle distributions is present, no fitting string masks to operate as training labels are available. With several thousands of training images and masks needed for training, labelling images by hand would not just be too inaccurate but also too elaborate. Therefore, artificially created data is used for training.
The process of generating training images in a way that the output string masks reliably detect string formations is a trial and error process. To display a string on the input image, randomized coordinates for a single particle in the field of view are generated. Next to that, six additional particle coordinates are generated to be situated on the left and on the right side of the initial particle in a string formation. These coordinates are generated with a fixed distance in horizontal direction.
A limited random offset in vertical direction is also added for each particle on the side to make the generated string not entirely straight. The x and y distances to neighboring particles are additionally superimposed with a certain degree of random noise in x and y direction to create more realistic string formations. In addition to that, the whole string is rotated by a limited random angle, to make the string not entirely horizontal. This way an artificial string is created. With a single string visible on the input image, the network would take large amounts of images for sufficient training. Therefore, and to make the input images even more realistic, randomly chosen either two or three strings are generated per image in a limited random vertical distance to each other, preventing overlapping. Looking at real string formation data, some strings show a sort of kink, where two string ends come together. To further improve the realness of artificial training images, this kink is also introduced with a small vertical offset in the string. All limits for random values and noises are chosen to resemble real data as much as possible.
Next to training the network on recognizing string formations it also needs to be trained to recognize isotropic particle formations and not to mask these in the output mask. To address this, randomly distributed particles are added into the areas, where no strings are generated. Furthermore, additional images with randomly distributed particles containing no strings at all are also generated. All particles are displayed on images of 128 to 128 pixels in size. This resolution has shown to be high enough for successful training, while being small enough to be handled in large numbers by a conventional GPU.
The input images are generated by displaying particles at the position of generated particle coordinates on the image. When particle sizes, form and brightness are chosen to resemble real image data from preceding PK-4 campaigns, the low input values are not decisive enough for recognising particle strings. Therefore, binarized particle images are used as input for the neural network. The original image data is fed through a convolutional network, as described in [14], outputting a binarized mask of the original image, where all pixels containing a particle are set to 1, while all others are set to 0. This process is used for particle localization on PK-4 data and is therefore already available at no further computational costs. In a similar manner, the artificially created training images consist of a binary mask of all particles at the position of the generated coordinates in varying sizes.
The according labels are then generated, by simply displaying four pixel wide connection lines between the coordinates of all particles, that are situated in a string. The thickness is chosen so that the labels are distinct enough to be reconstructed by the network and to make sure that the marked particles are reliably covered by the output mask. The string masks are also displayed binary with value 1 on a background with value 0. This way, only strings are visible on the labels and all labels for training images with only an isotropic particle distribution are completely empty. An example of the artificial training images is shown in figure 4.

Figure 4. Example training images and labels. The according labels only mask the generated strings, ignoring the randomly placed particles and leaving the labels for isotropic distributions empty. Both input image and label are binary images. Image (a) shows an input image containing 3 strings, image (b) shows the according label containing only the strings, image (c) shows an isotropic input image and (d) shows the according empty label without any strings.
Download figure:
Standard image High-resolution imageBest results are then achieved by training with 3000 training images containing strings and 3000 images containing no strings and only isotropic distributions. These 6000 images are shuffled and used in training for 20 epochs with a batch size of 50 images. The Adam optimizer with a constant learning rate of 0.001 was used. The loss was calculated with a weighted binary cross entropy function as in

with Ti and Pi being the truth and predicted value of each pixel, N being the number of pixels and ε being a small value of 10−4, to prevent taking the logarithm of zero. The weight of the value 1 w1 was chosen to be 10, while the weight of the value 0 w0 was chosen to be 1, since the amount of pixels with the value 1 is significantly lower for the used images. With this loss function the cross entropy loss for each pixel is calculated, while giving the fewer but more meaningful pixels with value 1 more weight.
3. Application and results
After training the network is ready for application. To detect strings on image data, the image first needs to be binarized and all particles need to be located, following [14]. The binarized image is then input into the neural network, that outputs the string mask. This mask can be displayed to gain a visual impression of all formed strings in the image. Next to that, the value of the string mask is read out on all coordinates, where particles are present. If the pixel containing the particle coordinate has the value 1, the particle is found to be part of a particle string and vice versa. This way all visible particles are evaluated simultaneously. To gain an impression of how the image data, input and output of the network looks it is shown in figure 5 . Furthermore, x and y elongation of coherent string mask areas are read out.

Figure 5. Illustration of the original image, the binarized input, the generated string mask and finally the analyzed particles. The original image is used as input for the first convolutional network. This networks binarized output is used as binarized input for the convolutional network that detects string formations. The output of this string formation network is the string mask to mark all particles that are inside a string formation, with all particles inside strings marked in blue and all particles outside of strings marked in red.
Download figure:
Standard image High-resolution image3.1. Evaluation
To evaluate the trained model it is first tested on artificial data. For this, additional artificial validation data is generated in the same way as for the training process, to gather data that is unknown to the trained network. Evaluated on 240 images the accuracy of the network is 99.25% considering the prediction of pixels in the output image, which normally tends to be high, since most pixels are background pixels. When it comes to recognizing particle formations, the model detects 96.06% of particles in the correct formation. Of the incorrectly recognized particles roughly 98% are particles, that do not belong to a string, but have been detected in one. The model therefore tends to detect more particles in strings than are present.
To confirm the high accuracy of the model on artificial data, the model needs to be verified on real data to assure the the neural network has generalized to problem and has not just adapted to the training data. Since the artificial data is of the same kind as the training data, these high accuracies were foreseeable. The strings in the training data are randomly generated to only resemble strings in real data. Real images are much more particle filled and tend to form many more and longer strings, than present in training data. Furthermore, the resolution of real images with 2048 to 2048 is much higher than on the training images. It needs to be shown, that the network has learned to recognize particle strings, by recognizing real particle strings. Because no labelled string data exists for this case, manually labelled data is used. Particles in real images of preceding PK-4 experiments are marked considering their string-likeness. This is done on 20 images with 10 images predominantly showing particle strings and 10 images predominantly showing isotropic distributions. In some cases, deciding on a particles configuration is not possible by hand, since no clear rules exist. Therefore, clearly string-like and isotropic particles are marked as such, while undecidable particles were left out of consideration. These particles are used as an estimation, whether the network is more likely to mask particles as string-like or not.
The trained model predicts 95.3% of all marked particles in real data correctly. This proves that the model has generalized the problem and is able to recognize string-like formation also on new and unknown data, that looks entirely different than the training data. Of the incorrectly evaluated particles 53% have been falsely predicted as string-like and 47% have been falsely marked as isotropic. This demonstrates, that the network does not prefer a configuration over the other on real data. In the manually labelled images 4.26% of particles have been marked as undecidable by hand. Of these particles 22% have been marked as string-like and 78% as isotropic. So it seems as the network rather marks particles as isotropic, when the distinction is not possible by hand.
3.2. Model limits
To verify the applicability of the model to real data, it is helpful to determine the limits to which the string detection accuracy holds up. Since the neural network uses camera image data to generate string masks, its sensitivity to input image quality, such as noise, lighting conditions, and image resolution, should be assessed. As mentioned in section 2.2, the original camera images must be fed through a convolutional neural network in a preprocessing step to binarize them, otherwise they would be too indecisive for analysis. This ensures a consistent, high signal intensity and low noise. In the following, these binarized input images are modified in different ways to assess the influence of image quality. Figure 6 shows the accuracy results of the same labelled data used for testing as above, degraded for lighting conditions by scaling the input intensity from 1 to 0, reduced image resolution by scaling the image resolution by factors of 1 (original) to 16, and image noise by adding Gaussian noise with signal to noise ratios of 50 to 1. It can be seen that the accuracy of the model drops significantly when the input intensity is more than halved, the image resolution is more than halved and the signal to noise ratio is less than 20. These results show that the sensitivity of neural networks to image quality degradation is not high. Typically, the signal to noise ratio of real PK-4 image data is between 100 and 150, which is far from the point where accuracy starts to degrade. In addition, the preprocessing step of image binarization prevents such drops in accuracy due to image quality entirely.

Figure 6. Accuracy test results on manually labelled data with various types of degradation, such as lower lighting conditions, image resolution reduction and Gaussian noise.
Download figure:
Standard image High-resolution imageString detection performance has been tested and verified in a range of complex plasma conditions. Our real experimental data includes pressures from 0.4 to 1 mbar, plasma currents from 0.5 to 1 mA, AC electric field frequencies of 250 and 1000 Hz and particle sizes of 2.05, 3.4 and 6.8 µm. Changing the background plasma conditions does not noticeably change the visual appearance of the plasma particles and therefore does not have a major effect on the string detection performance. Particle sizes and densities, however, do change the visual appearance of the plasma strings. In order to cover all the different configurations, the artificial training data has been matched as closely as possible to the real data. As a result, there is no significant loss of performance during the experiments. Strings with very different particle sizes and densities could potentially lead to losses in the accuracy of string detection. In this case, the artificial training data could be extended with such examples and the model retrained to cover such cases. Other disturbances in complex plasmas, such as dust acoustic waves, can possibly distort the strings to such an extent that the model is no longer able to detect them. Plasma waves should therefore be avoided or kept to a minimum in string formation experiments.
4. Comparison to preceding methods
While the accuracy of the presented network is very high, it still needs to be compared to preceding conventional methods to verify its usefulness and improvement. To gain an overview of the accuracy of other methods, they are implemented accordingly and evaluated on the same data.
4.1. Anisotropic weighted scaling index
At first the anisotropic weighted scaling index is compared to the machine learning approach. According to [6, 10, 11] the weighted scaling index α is implemented by calculating the logarithmic derivative of  with respect to r, where ρ is the local weighted cumulative point distribution of each point particle pi
and r being the scale parameter. With
with respect to r, where ρ is the local weighted cumulative point distribution of each point particle pi
and r being the scale parameter. With

and

the scaling index simplifies to

The exponent q controls the weight of the points contribution to α based on their distance to pi
. With increasing q points with  are more and more neglected, leading to a more local measure. In this case q = 2 has been used. This way a scaling index for every particle is calculated. The value of α is a measurement of the particles surrounding structure with α ≈ 0 suggesting a cluster-like structure, α ≈ 1 suggesting a filamentary structure, α ≈ 2 suggesting a sheet-like structure, α ≈ 3 suggesting a uniform distribution and α > 3 indicating points in underdense regions but in the vicinity of structures [11].
Furthermore, longitudinal and transverse scaling indices  and
and  can be calculated by adding an eigenvector q to dij
as in
can be calculated by adding an eigenvector q to dij
as in

Since in this case all strings lay parallel in x-direction the eigenvectors  and
and  are used to calculate
  and
and  .
.
The anisotropic weighted scaling index could be an indication of string-like structure in particle clouds and the differences of longitudinal and transverse scaling index distribution a classification of if the present image is filled with string-like structures or not.
4.2. Modified bond orientational order parameter
As shown in [12] the modified bond orientational order parameter

can be calculated for each particle i, using a number of nearest neighbors N(i) and Legendre Polynomial of the order n, with θij
being the angle between the two particles i and j. This parameter is used to illustrate structural transitions from weakly anisotropic fluids to string fluids and gives out a value of string-likeness for each particle. Since this approach is heavily dependent on the nearest neighbors, its accuracy for two-dimensional string structures is limited. In particular, the two ends of each string cannot be detected. By choosing a threshold value for  a distinction between string-like and isotropic particles can be made. In this evaluation six nearest neighbors N(i) and the second order Legendre polynomial n = 2 was used.
4.3. Pair correlation function
Previous studies evaluating string formations in complex plasmas in three [17, 18] and two [19] dimensions make use of pair correlation functions to determine the structural properties of particles. The pair correlation function in two dimensions, expressed in polar coordinates, is given by [19]

with N being the number of particles, σd
being the particle density,  and
and  being the distance and angle of the vector connecting particle i and j and ρ and α being the current particles polar coordinates.
Visualizing the pair correlation function with respect to ρ and α a distinction between an isotropic and string-like ordered system is visible.
For an isotropic distribution the pair correlation function is distance and angle independent and for ordered structures maxima in the pair correlation function are visible at certain distances and angles. After estimating the ordered distance and angle regions, all particles with neighbors that have an according distance and angle can be viewed as string-like. In this case it needs to be decided, whether one string-like neighbor is enough for defining a particle as in string, while enabling possible wrong classifications, or if two string-like neighbors are needed, while then not recognizing string ends as part of the string.
4.4. Preceding machine learning approach
To analyze phase transitions in electrorheological complex plasmas a machine learning approach based on a small convolutional neural network is presented in [9]. Here, the particle positions are extracted out of the original image at first. A 24 to 24 pixel image is then generated for each particle displaying an area of 5 times the median particle distance in total. The image is binary with every pixel containing a particle being 1. This image is fed through two convolutional layers, each followed by a batch normalisation, activation, pooling and dropout layer, and finally flattened by several fully connected layers to a two dimensional output. An illustration of this neural network is shown in figure 7. This way every particle is classified into either string-like or isotropic. The network is trained on partly real and artificial data. After classifying all particles falsely categorized strings are filtered out by reviewing the neighborhood of each particle.

Figure 7. Illustration of the neural network used for string detection in [9] created with [16]. The input size of the network is a 24 to 24 pixel image and the output is 2 different classes.
Download figure:
Standard image High-resolution image
After training this convolutional neural network reaches an accuracy of 96.6% [9]. This evaluation is, at least partly, done on artificially created data. While this approach is very promising, it will be applied to the same manually labelled data to verify its performance.
4.5. Comparison results
The results of applying each implementation of the different methods on the same set of manually labelled data is shown in table 1. Applying the anisotropic weighted scaling index method to the real data it is quickly visible that no clear distinction between string-like and isotropic particles can be made. Even modifying the parameters of index calculation does not give results that could be decisive by some kind of threshold particle-wise. Therefore, no result is shown in table 1. Calculating the longitudinal and transverse scaling indices for the whole particle cloud image-wise, the delta between both indices is a good indication of if the particle cloud is filled with strings or not. But in this case no information about individual particles is given. Using the modified bond orientational order parameter to recognize strings is equally prone to errors. While in this case a connection between the order parameter and a particles string-likeness is perceptible, the accuracy is just slightly higher than 50% which can be compared to just guessing the particles configuration without seeing it. Even adjusting the decision threshold and the number of neighbors used in the calculations does not improve the results.
Table 1. Comparison of string detection accuracy of different approaches on manually labelled data. The values correspond to the methods using the encoder-decoder network with asymmetric kernels presented in this work, the anisotropic weighted scaling index, the modified bond orientational order parameter, the pair correlation function using one neighbor and two neighbors and the preceding machine learning approach with a smaller convolutional neural network [9].
| Method | Accuracy |
|---|---|
| Encoder–Decoder with asymmetric Kernels | 95.24% |
| Anisotropic Weighted Scaling Index | — |
| Modified Bond Orientational Order Parameter | 52.66% |
| Pair Correlation Function (1 Neighbor) | 81.83% |
| Pair Correlation Function (2 Neighbors) | 77.21% |
| Convolutional Neural Network [9] | 77.11% |
The pair correlation function method delivers much more useful results in comparison. Table 1 shows both outcomes for implementations considering one and two nearest neighbors. With over 80% accuracy the method using only one neighbor performs best. This way the last particle of each string is also detected as string-like. On the other hand this way also some number of false classifications are made with particles that do not form a string but coincidentally have a neighbor in the fitting distance and angle. The smaller convolutional neural network approach from [9] performs comparably well with over 77% accuracy, while not reaching the 96.6% accuracy that was evaluated after training.
The machine learning approach using a convolutional encoder-decoder network with asymmetrical kernels presented here performs best in comparison. While the improvement in accuracy is very apparent and distinct, it is crucial to consider, that these yielded lower values could be influenced by differences in implementation details and the adaptation on the new data.
4.6. Computational efficiency
Comparing computational efficiency is a difficult task, since it depends very much on the code implementation and also on the hardware used, since in this case the conventional analysis methods are executed on a CPU and the neural networks on a GPU. Besides these differences, the main advantage of the presented approach is its independence from the number of particles. While the presented neural network has a fixed interference time of only about 0.03s on a NVIDIA RTX3060M graphics card, including the preprocessing convolutional network, for fullsize images (2048 × 2048 pixels), the previous methods analyse the particles one by one, which has scaling disadvantages. On smaller images (512 × 512 pixels) with about 2000 particles, these methods already have latencies of 2 to 6s per image. When scaled up to fullsize images with easily over 20 000 particles, the latency times rise to over a minute on a CPU core of an Intel i7-12 700 H. Of course, these processes could be accelerated using different implementations and multiprocessing techniques, but these approaches would always suffer from scaling effects. Therefore, the new approach shows a significant acceleration compared to previous methods.
5. Conclusion
In conclusion this paper presents a new machine learning approach to recognize string-like particle formations in complex plasmas using a convolutional encoder-decoder network with asymmetric kernels. This new approach improves the accuracy of string detection immensely compared to preceding methods up to above 95% accuracy on manually labelled data, while also enabling a global evaluation, considering all particles of the cloud at once and not just particle-wise, simultaneously accelerating the whole evaluation process and possibly enabling real-time video analyses. A convolutional U-Net was adapted, reduced and improved to suit the anisotropy of the present string formation phenomenon. Adequate training data and labels were artificially created to ensure good network training. Real complex plasma image data were manually labelled to validate, that the trained network has generalized the problem and is applicable to real data and to assess the real performance of the network.
In direct comparison to preceding methods on similar data the networks performance is superior. This improvement opens up new possibilities in particle string evaluation and could possibly improve previous findings in this field of science. Simultaneously, the new approach makes further analyses of the present strings more simple, because length and vertical elongation of the strings can be easily read out of the string mask, without any further complex calculations necessary.
The current method is limited to two dimensional image data, but could also be applied to three dimensional scans of particle clouds, providing further information about plasma crystals. Since the PK-4 setup is limited to two dimensional images of particle planes within the particle cloud, a scan of the particle cloud can be performed to obtain three dimensional information about the particles. The resulting two dimensional string masks could be stacked, taking into account the scanning speed and camera frame rate, to obtain a three dimensional string mask. Similar experiments have already been carried out using preceding analysis methods [17, 18] to obtain more information about the boundary regions of particle strings and their density distribution. A long-term evolution of the string-like order is observed, showing a redistribution of particles that significantly modifies the plasma conditions. Furthermore, crystalline structures and phase transitions such as melting and recrystallisation [19] could be observed in three dimensions, providing further information on electrorheological fluids.
The newer complex plasma setup COMPACT [20] could potentially improve insights into such dynamic processes because it can provide time-resolved three dimensional particle positions using four stereoscopic cameras rather than slow two dimensional scans [21]. These three dimensional particle coordinates could be analyzed in a completely different way, possibly using a three dimensional convolutional voxel based neural network.
In future work this neural network could be extended. As of now, binarized input images that are generated by another U-Net are used is input for the network, making two neural networks necessary for application. These networks could be conjoined to further simplify and accelerate the whole process.
Acknowledgments
This work is supported by the German Aerospace Agency (DLR). We thank the research group around Markus H Thoma and M. Kretschmer at Justus Liebig University Giessen for providing the data used in this study and the German Aerospace Society for providing powerful PCs in accordance with the funding decision, which facilitated the studies. This project was supported by the German Federal Ministry of Economic Affairs and Climate Action under Contract No. 50WK2270B.

Data availability statement
All data that support the findings of this study are included within the article (and any supplementary files).