
Abstract
Meningitis, characterized by meninges and cerebrospinal fluid inflammation, poses diagnostic challenges due to diverse clinical manifestations. This work introduces an explainable AI automatic medical decision methodology that determines critical features and their relevant values for the differential diagnosis of various meningitis cases. We proceed with knowledge acquisition to define the rules for this research. Currently, we have established the etiological diagnosis of Meningococcaemia, Meningococcal Meningitis, Tuberculous Meningitis, Aseptic Meningitis, Haemophilus influenzae Meningitis, and Pneumococcal Meningitis. The data preprocessing was conducted after collecting data from samples with meningitis diseases at Setif Hospital in Algeria. Tree-based ensemble methods were then applied to assess the model's performance. Finally, we implement an XAI agnostic explainability approach based on the SHapley Additive exPlanations technique to attribute each feature's contribution to the model's output. Experiments were conducted on the collected dataset and the SINAN database, obtained from the Brazilian Government's Health Information System on Notifiable Diseases, which comprises 6729 patients aged over 18 years. The Extreme Gradient Boosting model was chosen for its superior performance metrics (Accuracy: 0.90, AUROC: 0.94, and F1-score: 0.98). Setif's hospital data revealed notable performance metrics (Accuracy: 0.7143, F1-Score: 0.7857). This study's findings showcase each feature's contribution to the model's predictions and diagnosis. It also reveals critical biomarker ranges associated with distinct types of Meningitis. Significant diagnostic effect was found for Meningococcal Meningitis with elevated neutrophil levels ( 40%) and balanced lymphocyte levels (40%–60%). Tuberculous Meningitis demonstrated low neutrophil levels (
 60%) and elevated lymphocyte levels (
 60%). H. influenzae meningitis exhibited a predominance of neutrophils (
 80%), while Aseptic meningitis showed lower neutrophil levels (
 40%) and lymphocyte levels within the range of 50%–60%. The majority of the AI automatic medical decision results are twinned with validation by our team of infectious disease experts, confirming the alignment of algorithmic diagnoses with clinical practices.
Export citation and abstract BibTeX RIS

Original content from this work may be used under the terms of the Creative Commons Attribution 4.0 license. Any further distribution of this work must maintain attribution to the author(s) and the title of the work, journal citation and DOI.
1. Introduction
Meningitis diseases pose a significant threat to public health, and their rapid transmission can lead to widespread outbreaks if not managed effectively. Early detection and interventions are critical to reducing the morbidity and mortality associated with these diseases. Delayed diagnosis and treatment can result in severe complications such as brain damage, hearing loss, and even death [1]. According to the world health organization, approximately 1 in 10 people with bacterial Meningitis die, and 1 in 5 suffer from long-term severe complications [2]. Rapid and accurate diagnosis allows for promptly initiating appropriate treatment and isolation measures to prevent further transmission. Therefore, developing and implementing fast and accurate diagnostic tools are crucial for preventing the spread of Meningitis diseases and reducing associated morbidity and mortality. Although culture and smear microscopy are commonly used for meningitis diagnosis, low sensitivity limits their effectiveness. One can miss up to 30% of cases [3], especially when patients have received antibiotics before testing. Additionally, traditional diagnostic methods can be time-consuming, invasive, and costly, leading to delays in treatment and increased healthcare expenditures. This limitation highlights the pressing need for more reliable diagnostic methods to improve the early detection of Meningitis and enhance patient outcomes.
Machine learning (ML) models have shown great potential in diagnosing various medical conditions, including infectious diseases [4]. A recent study implements and validates an artificial AI model for early aetiological determination of patients with encephalitis and Meningitis. Considering four categories (autoimmune, bacterial, tuberculosis, and viral), based on the initial 24 h data, it identifies essential factors among these aetiologies in the classification process [5]. Furthermore, artificial intelligence (AI) played a significant role in the healthcare and medical field, particularly during the COVID-19 pandemic, assisting with vaccination and improving human decision-making. AI has been employed to analyze large datasets related to COVID-19, encompassing infection rates, transmission patterns, and demographic information. This analysis enables targeted interventions, diagnosis, and preventive measures to reduce human-to-human infectivity of COVID-19. The employment of AI has also shown great potential in advancing COVID-19 vaccine development by predicting potential epitopes with antigenic characteristics and detecting virus mutations through deep convolutional neural networks (CNN) [6, 7]. Similarly, applying deep learning approaches has yielded promising results in identifying Acute Lymphoblastic Leukemia (ALL). A novel approach leveraging ensemble CNN models was introduced to overcome the limitations of traditional methods, such as peripheral blood smear examination, which is laborious, time-consuming, and heavily reliant on specialists' expertise to detect ALL. These models have demonstrated promising results for feature extraction from images and the classification of B-ALL lymphoblast and normal cells [8]. Moreover, recent studies employing CNN models have shown promising outcomes in diagnosing different types of malaria using blood smear images comprising various strains, specifically Falciparum, Vivax, and Ovale, and samples from healthy individuals [9]. These models can analyze vast amounts of data, offering accurate predictions that can improve diagnostic accuracy and reduce the time required for diagnosis. However, the lack of interpretability in these models poses challenges in clinical practice. Indeed, clinicians struggle to understand and trust what they perceive as black boxes. This work deals with ML-interpretability for diagnosing meningitis disease. Indeed, interpreting ML models for diagnosing Meningitis is critical and challenging, given the diverse clinical presentations and the importance of understanding the model's decisions in medical applications. Recognizing the need for effective resolution of medical problems, we are focusing on a clinical decision support system (CDSS) to aid medical teams in making automated decisions for diagnosing different types of meningitis cases, including Meningococcaemia, Meningococcal Meningitis, Tuberculous Meningitis, Aseptic Meningitis, H. influenzae meningitis, and Pneumococcal Meningitis.
In this paper, we propose an innovative approach to improve meningitis diagnosis using SHapley Additive exPlanations (SHAP) model-agnostic techniques applied to the outcome predictions of an XGBoost classifier. Our study addresses a significant gap in the existing literature by examining the clinical presentations of meningitis across various classes, including Meningococcaemia, Meningococcal Meningitis, Tuberculous Meningitis, Aseptic Meningitis, H. influenzae meningitis, and Pneumococcal Meningitis. By employing SHAP values, we identify influential factors in the model's predictions, highlighting essential biomarkers and attributes such as Neutrophils and lymphocyte levels, white cell count (WCC), Protein and Glucose ratios, and clinical signs. Notably, our analysis reveals variations in the impact of these features across different meningitis types, aligning with established clinical associations. These insights lay the groundwork for an automated meningitis diagnosis tool and suggest avenues for further investigation. Furthermore, our experiments, conducted on both the SINAN database and a real dataset from Setif's hospital in Algeria, demonstrate the efficacy of our methodology in balancing model accuracy and interpretability, offering a promising approach to enhance meningitis diagnosis and improve patient outcomes.
2. Related works
The systematic literature review was presented in two focus groups. The first part focuses on the current state-of-the-art CDSSs for Meningitis, and the second part, focuses on current explainability approaches for various healthcare domains.
2.1. CDSSs for Meningitis diagnosis
CDSSs are intelligent systems that assist medical professionals in facilitating decision-making at different stages of the diagnosis and treatment of diseases using specific recommendations [10].
CDSSs are classified into knowledge-based or non-knowledge-based, with the latter leveraging ML and AI or statistical pattern recognition. However, non-knowledge-based systems face challenges, such as understanding AI's logic (black boxes) and obtaining high-quality data due to fragmentation, inconsistent formats, and privacy concerns [11]. Several studies have been proven effective in diagnosing different pathologies.
Regarding Meningitis diagnosis, the work presented by D'Angelo et al [12] aims to improve the discrimination between bacterial and viral Meningitis etiologies through the use of ML-based methodologies. Two cases were considered: one in which both blood and cerebrospinal parameters were taken into account and another in which only blood data were used. The results showed that a combination of clinical parameters is necessary to distinguish between the two Meningitis etiologies properly. The study used four classifiers: Naive Bayes, multilayer perceptron (MLP), Decision tree-J48, and genetic programming (GP). The GP classifier achieved the best performance. It obtained 100%
Zaccari and Marujo [13] focused on developing a quantitative measure to help healthcare professionals decide whether or not patients need to undergo a cerebrospinal fluid (CSF) exam to diagnose Meningitis. Their approach involves using ML techniques to analyze data from blood and urine exams and patient chief complaint reports to identify patterns that could indicate the presence of Meningitis. The study used seven classifiers: Adaptive Boosting (AdaBoost), Decision Tree, Gradient Boosting, K-nearest neighbors, Logistic Regression, Random Forest and Support Vector Machines. Their analysis found that the Decision Tree model had the best performance, with an accuracy of 96.18%
Authors in [14] aimed to develop a system to classify subjects with Meningitis using a feedforward artificial neural network (ANN). They employed two learning algorithms to develop the ANN: Levenberg-Marquardt training algorithm, suitable for pattern recognition, and particle swarm optimization to adjust the decision threshold. The goal was to achieve better performance by optimizing the decision threshold using a database that included several parameters such as temperature, CSF/blood glucose ratio, proteins, CSF leukocytes, glucose, lactates, erythrocyte sedimentation rate (ESR), and C-reactive protein (CRP).
This study [15] aimed to identify the best classification model to assist in diagnosing Meningitis. The researchers examined the performance of seven classification techniques applied to nine clinical symptoms of a patient, as well as their age, sex, and geographical location. They found that all models could predict Meningitis even before the completion of laboratory tests, indicating the possibility of a non-invasive and early diagnosis. The best classification technique was determined to be the J48 decision tree.
The researchers expanded their research on Meningitis [16] by creating a computerized decision support system (CDSS) that can help doctors identify the illness. They developed three decision models: DM1 determines if a patient has Meningitis based on observable symptoms, DM2 predicts the probability of meningococcal Meningitis using the same symptoms, and DM3 explores the disease's cause using chemical and cytological test data. The decision models achieved a high classification accuracy of 94.3% for Meningococcal Disease Meningitis. Evaluation of the system with real patient data showed that diagnosing Meningitis based solely on observable symptoms is challenging, but the CDSS correctly diagnosed 88% of Meningitis cases from the database.
The same researchers [17] explored data-driven techniques to differentiate between viral and bacterial Meningitis using a dataset of 26 228 patients and 19 attributes. They experimented with various sampling, feature selection, and classification models, finding that combining ensemble methods with decision trees achieved the best performance. The best classifiers had precision, recall, and f-measure of 89% and an AUC value of 95%. Their results suggest that this approach outperforms previous work using only decision trees.
2.2. Models explainibility
Despite the promising results of previous studies in accurately predicting diagnosis, the black-box nature of these models poses a challenge for their adoption in clinical settings [18], as it can be challenging to comprehend the reasoning behind the model's predictions. This transparency is essential as it involves both the acknowledgment of AI usage and understanding how AI arrives at its conclusions or classifications [19]. Ensuring transparency in AI usage is essential, and it involves both the acknowledgment of AI usage and the understanding of how AI arrives at its conclusions [19]. Applying rigorous controls and testing from the medical field to AI deployment in healthcare reinforces this transparency, providing clear explanations of AI decision-making to ensure safety, accountability, and responsible use in medical settings [20].
Choi et al [5] conducted a study on meningitis and encephalitis classification in patients hospitalized within the initial 24 h. Various ML models were applied, including XGBoost, Random Forest, Light Gradient Boosting Machine, KNN, Gaussian Naive Bayes, and TabNet. An ensemble model (80% XGBoost, 20% TabNet) achieved the highest performance, with accuracy, precision, recall, and F1 score of 0.89 and AUROC of 0.91. Classifiers were applied to baseline characteristics, medical history, vital signs, and diagnostic results (CT, CXR, EEG). Laboratory findings from CSF, blood, and urine were also considered. Model-agnostic techniques (PIMP, LIME, SHAP) provided explainability. AI models slightly outperformed human clinicians due to the absence of certain factors considered in actual clinical practice. However, the researchers highlighted that AI still performed very well, suggesting it could be helpful for neurologists in making quick treatment decisions.
Yang et al [21] conducted an insightful retrospective study on febrile infants aged  60 days, which involved using a deep neural network to develop a predictive model of invasive bacterial infection (IBI). The model's performance was then compared to that of the IBI score. The SHAP technique was used to explain the model's predictions at different levels. Five influential predictive variables (absolute neutrophil count, body temperature, heart rate, age, and C-reactive protein) were identified using SHAP. The study resulted in developing an explainable deep learning model that performs better than previous scoring systems and provides insight into how it arrives at its predictions through individual features and cases.
This study [22] aimed to predict the severity of COVID-19 by using ML and Deep Learning algorithms that consider various clinical markers, vital signs, and critical factors. The researchers evaluated five data-balancing techniques and twelve classifiers to find the most effective method. They discovered that Random Forest trained on Borderline SMOTE balanced data was the best-performing method, achieving an 83% recall rate in predicting COVID-19 severity. To better understand the models, the team deployed Explainable AI tools such as SHAP, Local Interpretable model-agnostic explanations (LIME), ELI5, Qlattice, Anchor, and Feature Importance to determine the importance of critical features in predicting COVID-19 severity. Their findings showed that respiratory rate, blood pressure, lactate, and calcium values were the primary contributors to the increase in severity of a COVID-19 patient. Ultimately, this architecture aims to serve as an explainable decision-support triaging system for medical professionals in countries lacking advanced medical technology and infrastructure to reduce COVID-19 fatalities.
Laatifi et al [23] investigates the impact of cytokines on the severity of SARS-CoV-2 infection. Plasma levels of 48 cytokines were measured in 87 participants from the COVID-19 study. Five models (Random Forest, XGBoost, Bagging Classifier, Decision Tree, and Gradient Boosting Classifier) were trained on synthetic data, with the Gradient Boosting Classifier showing superior performance. The interpretations of the Gradient Boosting model by SHAP and the LIME (Local Interpretable Model-agnostic Explanations) provide detailed insights into the cytokine dataset. The results revealed significant variations in cytokine levels among COVID-19-infected patients, with VEGF-A, MIP-1b, and IL-17A showing elevated levels in severe cases. At the same time, M-CSF, IL-27, IL-9, IL-12p40, RANTES, and TNF were associated with non-severe cases and healthy individuals. These findings suggest the involvement of these cytokines in disease promotion and offer new possibilities for prevention and treatment.
In contrast, Mercaldo et al [24] adopted a different approach by utilizing medical images to detect coronavirus disease. They introduced a deep learning method that categorized computed tomography (CT) images into healthy patients, patients with pulmonary disease, and patients affected by Coronavirus 19. To provide explainability in their model, they employed the Gradient-weighted class activation mapping (Grad-CAM) algorithm, which automatically highlighted the symptomatic areas of infection within CT images. This technique enhanced the diagnostic process by offering visual insights into the regions contributing to disease detection. Integrating Grad-CAM with deep learning improved the efficiency and accuracy of disease detection, providing valuable information for medical professionals. Shi et al [25] employed ML techniques to diagnose tuberculous Meningitis, offering a potential solution to enhance diagnostic accuracy.
Building on previous works, our current work determines which signs or indicators have the highest predictive value by analyzing the Meningitis disease, providing valuable insights for accurate disease diagnosis. Our method derives the underlying factors influencing the IA-based algorithms' outcomes, allowing clinicians to trust and effectively incorporate AI-based recommendations into their clinical practice of Meningitis.
3. Method
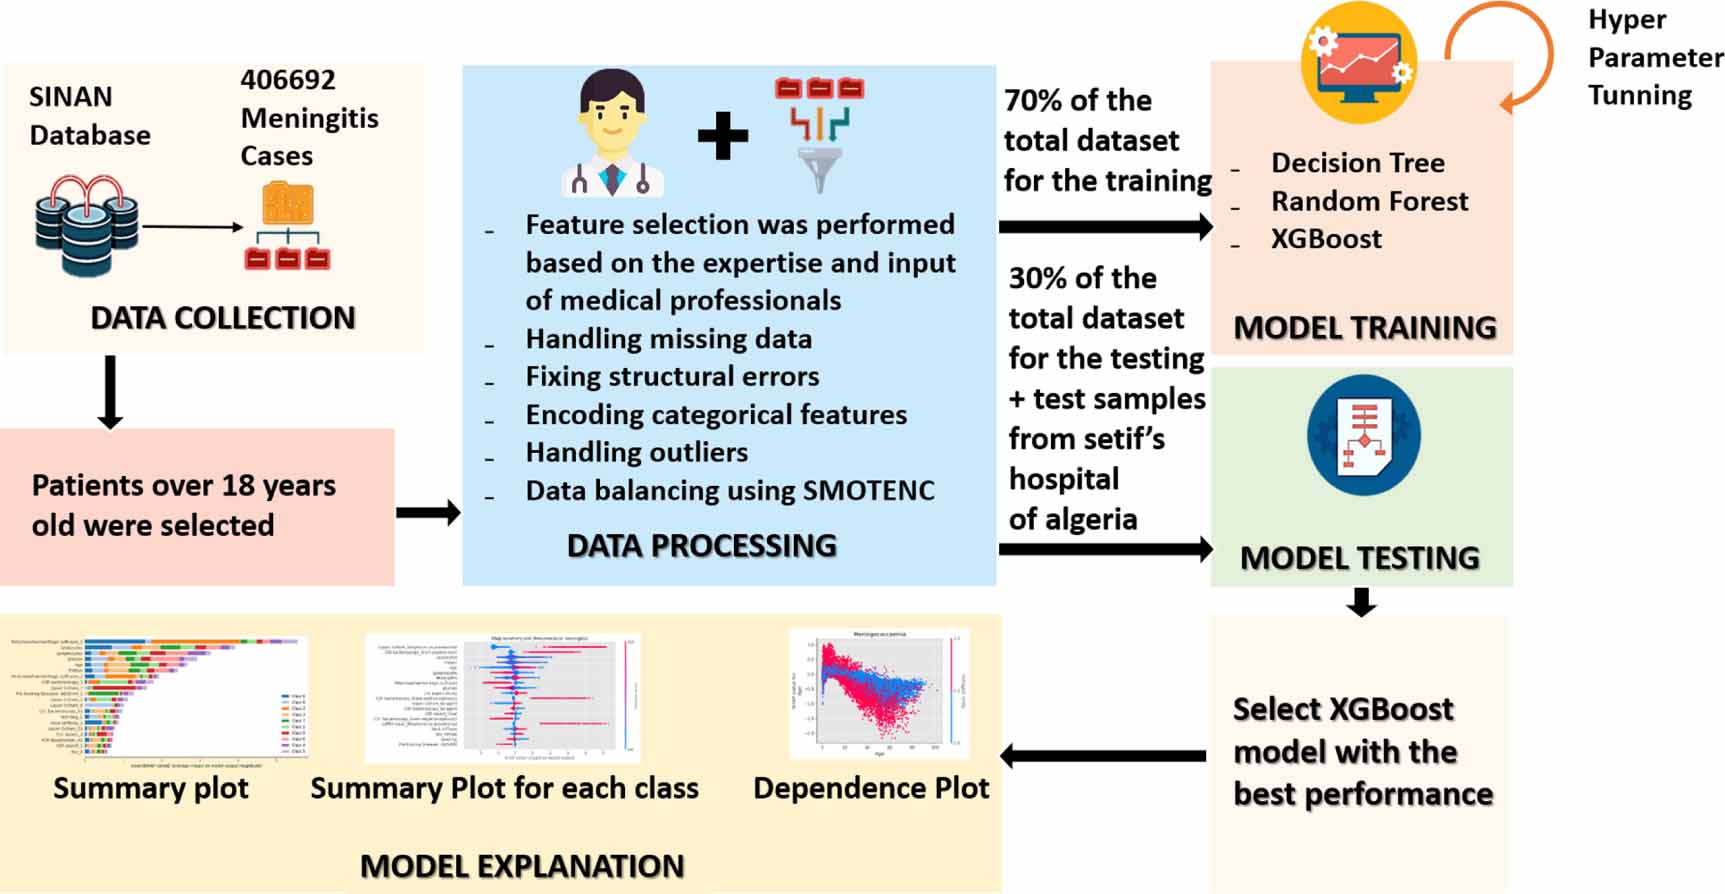
AI-driven techniques, powered by ML algorithms and data analysis, have the potential to analyze vast amounts of patient data, recognize patterns, and identify subtle indicators that might escape human observation [26–29]. For this purpose, our proposed methodology to diagnose the Meningitis cases and discover the differential diagnosis is illustrated in figure 1. In the first phase, the data processing techniques were applied, and synthetic data was generated using the SMOTENC (Synthetic Minority Over-sampling Technique for Nominal and Continuous technique) to address the class imbalance issue. Secondly, multiple classifiers were trained using 70% of the overall dataset. We evaluate their performance using the remaining 30% for testing. Subsequently, the fitting performances of the models were compared, and the best-performing model was selected. In the third phase, we investigated the SHAP analyses SHAP to study and visualize the impact of different features across the various diagnosis cases. The explanation provides valuable insights into the contribution of each feature to the model's predictions and aids in understanding the importance of different factors in diagnosing Meningitis diseases. Finally, the interpretation phase was performed in collaboration with the medical experts to discover the AI-powered diagnostic indicators that can assist in early detection and swift identification of Meningitis cases. Furthermore, early detection often translates to timely intervention and treatment, potentially preventing disease progression and improving prognosis.

Figure 1. Flowchart illustrating the proposed method to diagnose Meningitis relying on the XAI agnostic explainability process. The dataset is preprocessed, including synthetic data generation using SMOTENC. Various machine learning classifiers are trained and evaluated on training and testing datasets. SHAP analyses provide insights into the influence of features on Meningitis diagnosis. According to our medical experts, the interpretation phase extracts meaningful insights and justifications for AI decisions without relying solely on the internal structure of the model.
Download figure:
Standard image High-resolution image3.1. Data preparation: study case
We conducted the experiments on a total of 6729 notified Meningitis cases of individuals over 18, retrieved from SINAN [30], the Information System on Notifiable Diseases of the Brazilian Government's Health Department from 2003 to 2022. SINAN is a database that encompasses compulsory disease notifications throughout Brazil. Notifications and investigations are stored in the SINAN NET database, with dedicated tables for each specific disease, including meningitis.
Initially, the dataset consists of 123 attributes. In our work, we focused on 34 specific attributes that are centered around clinical signs and biological examinations. These attributes were carefully chosen, in consultation with the infectious disease experts at Setif Hospital in Algeria, as they are the most informative and relevant for Meningitis diagnosis. Tables 1 and 2 summarizes the description and the possible values of the selected attributes from the dataset.
Table 1. Prognostic factors associated with meningitis diagnosis, focusing on demographic information, medical history, pre-existing illnesses, and clinical signs/symptoms.
| Diagnostic evaluation | Attributes | Categories | Description |
|---|---|---|---|
| Demographic information | Age | Numerical | Informs the patient's age |
| Sex | Categorical | Informs the patient's sex | |
| M—Male | |||
| F—Female | |||
| Medical History Pre-existing illnesses | Pre-Existing Diseases—AIDS/HIV | Categorical | Provide information about the presence of pre-existing diseases or illnesses in an individual's medical history |
| Pre-Existing Illnesses—ARI | 1—Yes | ||
| Pre-Existing Diseases—Tuberculosis | 2—No | ||
| Pre-Existing Illnesses—Trauma | 9—Ignored | ||
| Pre-Existing Illnesses—Hospital Infection | |||
| Pre-Existing Illnesses—Other | |||
| Vaccination—Meningococcal C Conjugate | Indicate whether the person has received specific vaccinations to protect against certain diseases or infections | ||
| Vaccination—BCG | |||
| Vaccination—Triple Viral | |||
| Vaccination—Hemophile—Tetravalent or Hib | |||
| Vaccination—Pneumococcus | |||
| Clinical Signs/Symptoms | Headache | Categorical | Informs if this clinical manifestation has occurred in the patient |
| Fever | 1—Yes | ||
| Vomiting | 2—No | ||
| Seizures | 9—Ignored | ||
| Neck stiffness | |||
| Petechiae/haemorrhagic suffusion | |||
| Kernig/Brudzinski | |||
| Coma |
Table 2. The prognostic factors related to Meningitis diagnosis derived from biological tests.
| Diagnostic evaluation | Attributes | Categories | Description |
|---|---|---|---|
| Biological tests | Lymphocytes | Numerical | Chemocytological examination |
| Neutrophils | |||
| CSF White Cell Count (WCC) | |||
| Protein ratio CSF/serum | |||
| Glucose ratio CSF/serum | |||
| CSF aspect | Categorical | Appearance of the cerebrospinal fluid (CSF) obtained through the puncture | |
| 1—Clear | |||
| 2—Purulent | |||
| 3—Haemorrhagic | |||
| 4—Cloudy | |||
| 5—Xanthochromic | |||
| 6—Other | |||
| 7—Ignored | |||
| PCR Blood/serum | Categorical | List of causative agents for meningitis identified through PCR testing | |
| 62—Ignored | |||
| 37—Mumps | |||
| 38—Measles | |||
| 39—Herpes Simplex | |||
| 40—Chickenpox/Herpes Zoster | |||
| 41—Rubella | |||
| 55—Influenza | |||
| 72—Dengue | |||
| 61—Unrealized | |||
| 75—Not identified | |||
| 70—Adenovirus | |||
| 56—Echovirus | |||
| 63—Coxsackie Virus | |||
| 59—Other Enteroviruses | |||
| 71—West Nile Virus | |||
| 73—Other Arboviruses | |||
| 74—Other viruses | |||
| 01—Neisseria meningitidis | |||
| 06—H. influenzae | |||
| 07—Streptococcus pneumoniae | |||
| 28—Other bacteria | |||
| 43—Cryptococcus/Torula | |||
| 42—Other fungi | |||
| 48—Toxoplasma | |||
| 52—Other Parasites | |||
| 51—No agent | |||
| CSF Bacterioscopy | Categorical | Etiological agent identified in the examination | |
| 61—Unrealized | |||
| 62—ignored | |||
| 32—Gram negative bacilli | |||
| 31—Gram positive bacilli | |||
| 36—Coccobacilli | |||
| 34—Gram negative cocci | |||
| 33—Gram positive cocci | |||
| 35—Gram negative diplobacilli | |||
| 03—Gram negative diplococci | |||
| 08—Gram positive diplococci | |||
| 28—Other Bacteria | |||
| 51—no agent | |||
| CSF Culture | Categorical | Etiological agent identified in the examination | |
| 61—Unrealized | |||
| 62—Ignored | |||
| 01—Neisseria meningitidis | |||
| Blood/serum culture | 06—H. influenzae | ||
| 07—S. pneumoniae | |||
| 28—Other bacteria | |||
| 51—No agent | |||
| LATEX CSF | Categorical | Etiological agent identified in the examination | |
| 61—Unrealized | |||
| 62—Ignored | |||
| 01—Neisseria meningitidis | |||
| 06—H. influenzae | |||
| 07—S. pneumoniae | |||
| LATEX Blood/serum | 14—Streptococci (sp, piogens, alpha, hemolytic, faecalis, agalactiae) | ||
| 28—Other bacteria | |||
| 43—Cryptococci | |||
| 51—No agent | |||
| Diagnosis | Type of causative agent | 0—Meningococcaemia | Confirmed diagnosis |
| 1—Meningococcal meningitis | |||
| 2—Tuberculous meningitis | |||
| 3—Meningitis by other bacteria | |||
| 4—Unspecified meningitis | |||
| 5—Aseptic meningitis | |||
| 6—Meningitis due to other aetiology | |||
| 7—H. influenzae meningitis | |||
| 8—Pneumococcal meningitis |
We collected a dataset from Setif's Hospital in Algeria comprising cases notified as Meningitis. Notable disparities were observed in comparison to the dataset sourced from the Brazilian SINAN database. This dataset diversification aims to enhance our samples for evaluations, offering a broader perspective on the performance and generalizability of our explainable AI model. Within Setif's hospital dataset, we identified cases suitable for testing our model. However, these cases only encompass two types of Meningitis, constituting a subset of the classes found in the training dataset of the SINAN database.
3.2. Data preprocessing
In this phase, a series of data preparation steps have been performed on the data set, including addressing duplicate data and missing values and handling outliers. Additionally, a crucial step involved balancing the data to mitigate any biases and enhance the overall learning of the model. These rigorous data preparation steps have been undertaken to minimize distortions and improve the accuracy of predictions:
- The data type transformation: We converted data type on selected features to ensure compatibility with the model's requirements and enhance prediction accuracy.
- The missing Data: To preserve the integrity of the analysis and considering the substantial volume of data available, all observations with missing values were omitted from the analysis.
- The structural errors: Fixing structural errors in the preprocessing step, including eliminating typos and inaccurate information, ensures consistent features. This step enhances accuracy, reduces biases, and improves subsequent analysis and modeling.
- The categorical features encoding: We identified several categorical attributes pre-encoded from the original data in the dataset. We selectively converted the necessary attributes into integer form for model compatibility and prediction generation, enabling their effective utilization within our analysis. It is worth noting that certain ML algorithms, such as decision trees and rule-induction methods (e.g. CART, C5.0, etc), possess inherent capabilities to handle high-cardinality categorical attributes without the need for external preprocessing steps [31].
- The outliers: In medical research, outliers hold valuable insights into rare or atypical cases, contributing to a comprehensive analysis. These extreme values may or may not represent aspects of data intrinsic variability and may have a legitimate place in the dataset [32]. We applied the Interquartile Range (IQR) method to handle outliers specifically to numerical attributes, including laboratory biomarkers. The IQR method is a statistical technique employed to detect and manage outliers within the dataset. We systematically deal with outliers by utilizing the IQR method, leading to a more comprehensive data variability. Following this process, the dataset size was reduced to 5072 samples.
- The data balancing: we employed the SMOTE-NC (Synthetic Minority Over-sampling Technique for Nominal and Continuous) method to deal with the class imbalance. SMOTE-NC extends SMOTE to handle categorical and numerical features, generating synthetic samples. Choosing SMOTE-NC over SMOTE allows us to balance the dataset while maintaining feature integrity, which ensures fair representation and reduces bias towards the majority class [33]. Figure 2 shows the class distribution pre-application and post-application of SMOTE-NC.

Figure 2. The class Distribution comparison before and after SMOTE-NC. The (a) and (b) demonstrate the class distribution of the dataset. (a) represents the dataset's class distribution before applying the SMOTE-NC technique, revealing a substantial class imbalance with the 'aseptic Meningitis' category as the majority class at 49%. In contrast, (b) displays the class distribution after implementing SMOTE-NC, effectively balancing the classes with an equal number of instances for each class, totaling 2460 instances.
Download figure:
Standard image High-resolution image3.3. Models investigation
In this section, we justify the choice of three tree-based decision models: the decision tree classifier, random forest classifier, and XGBoost classifier. Among the several attractive properties of tree-based methods is their ability to capture complex interactions between predictors [34]. Moreover, they are considered less prone to outliers, require no distributional assumptions or data transformations, and are intuitive [35].
Various metrics assess distinct characteristics of the classifier generated by the classification algorithm [36]. This study utilized a diverse set of performance metrics to evaluate the developed classifiers. The chosen metrics encompass accuracy, recall, precision, F1-score, and area under the receiver operating characteristic curve (AUROC). The dataset was divided into two subsets to ensure an appropriate evaluation of the classifiers' performance: 70% for training the models and 30% for testing their generalization capabilities. This division allowed us to train the classifiers on a significant portion of the data effectively while reserving a separate portion for independent assessment, serving as a benchmark to evaluate the classifiers' predictive accuracy on unseen instances.
3.4. Model agnostic explainibility
The SHAP method is a model-agnostic interpretation technique used to interpret the results of a predictive model. It employs the Shapley value, a cooperative game theory concept, to quantify each feature's contribution to the model's prediction. The Shapley value formula ( ) considers all possible feature combinations and calculates the marginal contribution of each feature. It satisfies desirable properties like efficiency, symmetry, dummy, and additivity.
The formula for the Shapley value ( ) is:
) is:

In the formula (1), S represents a subset of features used in the model, x is the vector of feature values for the instance being explained, and p is the total number of features. The function val(x) represents the prediction for the feature values x, marginalized over the features not included in the set S. It is obtained by integrating the model's predictions over the ranges of the excluded features, weighted by their respective probabilities. The Shapley value for feature j is calculated by summing the contributions of all subsets S that do not contain feature j and weighing each contribution by the number of possible orderings of the features in the subset [37, 38].
The Shapley value satisfies several desirable properties, such as:
- (i)Completeness/Efficiency: The sum of the Shapley values for all features equals the difference between the model's prediction for the instance x and the average prediction for all possible instances:

- (ii)Symmetry: If two features values j and k contribute equally to all possible coalitions, their Shapley values should be the same:
- (iii)Dummy: If a feature j has no impact on the model's prediction, regardless of its inclusion in coalitions, its Shapley value should be zero:
- (iv)Linearity: When combining two models, represented by val and val', the overall prediction should correspond to the sum of the contributions from each model


The linearity property is beneficial when using ensemble models like XGBoost with TreeSHAP. It enables the computation of the Shapley value for a feature by averaging the contributions of each tree in the ensemble. This simplifies the calculation process and enhances the interpretation of individual feature contributions.
In our study, we employed the TreeSHAP method to interpret the results of the XGBoost model. We chose SHAP due to its model-agnostic nature, theoretical grounding, and ability to provide local and global interpretations. This approach improves the transparency, interpretability, and identification of potential issues or biases in the model.
4. Results
4.1. Model validation
The performances of the classifiers are provided in table 3. It includes key metrics such as precision, recall, F1-score, and support for each Meningitis class within the dataset.
Table 3. Performance Metrics by Meningitis class.
| Meningitis cases | Precision | Recall | F1-Score | Support | ||||||
|---|---|---|---|---|---|---|---|---|---|---|
| DT | RF | XGB | DT | RF | XGB | DT | RF | XGB | ||
| Meningoccaemia | 0.99 | 1.00 | 1.00 | 0.99 | 0.99 | 1.00 | 0.99 | 1.00 | 1.00 | 738 |
| Meningoccal Meningitis | 0.97 | 1.00 | 0.99 | 0.90 | 0.95 | 0.98 | 0.93 | 0.97 | 0.98 | 738 |
| Tuberculous Meningitis | 0.83 | 0.94 | 0.92 | 0.71 | 0.86 | 0.94 | 0.76 | 0.90 | 0.93 | 738 |
| Meningitis by other bacteria | 0.71 | 0.84 | 0.78 | 0.49 | 0.53 | 0.80 | 0.58 | 0.65 | 0.79 | 738 |
| Unspecified Meningitis | 0.50 | 0.88 | 0.79 | 0.42 | 0.42 | 0.73 | 0.45 | 0.57 | 0.76 | 738 |
| Aseptic Meningitis | 0.73 | 0.83 | 0.78 | 0.51 | 0.57 | 0.80 | 0.60 | 0.68 | 0.79 | 738 |
| Meningitis due to other aetiology | 0.83 | 0.96 | 0.92 | 0.64 | 0.77 | 0.90 | 0.72 | 0.85 | 0.91 | 738 |
| H. influenzae Meningitis | 0.91 | 0.95 | 0.94 | 0.94 | 0.98 | 0.99 | 0.92 | 0.96 | 0.97 | 738 |
| Pneumococcal Meningitis | 0.97 | 0.99 | 0.99 | 0.94 | 0.94 | 0.97 | 0.96 | 0.97 | 0.98 | 738 |
Precision represents the proportion of correctly predicted positive instances out of all instances predicted as positive, indicating the model's ability to avoid false positives. Recall, also known as sensitivity, measures the proportion of correctly predicted positive instances out of all actual positive instances, indicating the model's ability to capture all relevant positives. The F1-score is the harmonic mean of precision and recall, providing a balanced evaluation of the classifier's performance by considering both metrics. Lastly, the support column in the classification report indicates the number of instances belonging to each class, providing context and understanding of the distribution and representation of classes in the dataset.
Table 3 provides valuable insights into the model's ability to classify different Meningitis classes accurately. Random Forest (RF) and XGBoost (XGB) achieved consistently high precision scores, ranging from 0.83 to 1.00 and 0.78 to 1.00, respectively, indicating their effectiveness in minimizing false positives. The Decision Tree (DT) classifier also performed well, although slightly lower than RF and XGB, with precision scores ranging from 0.50 to 0.99.
Regarding recall, XGB demonstrated superior performance, consistently achieving scores above 0.73 for all classes, indicating its capability to capture the majority of actual positive instances. Decision Tree and Random Forest classifiers also exhibited lower recall scores, ranging from 0.42 to 0.99.
The F1 score combines precision and recall, offering a balanced evaluation of the model's overall performance for each class. XGB achieved the highest F1 scores across all classes, ranging from 0.76 to 1.00, followed closely by RF with scores ranging from 0.57 to 1.00. DT showed slightly lower F1 scores, ranging from 0.45 to 0.99, indicating a trade-off between precision and recall.
The support metric ensures a fair evaluation and comparison of the classifiers' performance across classes. The findings demonstrate that XGBoost and Random Forest consistently perform strongly across all metrics. These classifiers are reliable choices for accurate Meningitis classification, providing high precision in identifying positive cases and effectively capturing most positive instances. Their ensemble nature, robustness to overfitting, and ability to capture complex relationships contribute to their superior performance compared to the Decision Tree classifier.
To provide an overview of the classifiers' outcomes, table 4 presents a summary of the obtained results. It can be concluded that the XGBoost model outperformed the other classifiers. With the highest accuracy, precision (Macro Avg), recall (Macro Avg), F1-Score (Macro Avg) scores, and One-vs-Rest AUROC (Area Under the Receiver Operating Characteristic), the XGBoost model demonstrated superior performance in accurately classifying the data and capturing the overall patterns in the dataset.
Table 4. Performance comparison of classifiers' overall metrics.
| Classifier | Metrics (Macro Avg) | AUROC One-vs-Rest | |||
|---|---|---|---|---|---|
| Accuracy | Precision | Recall | F1-Score | ||
| Decision Tree | 0.725 | 0.826 | 0.725 | 0.7691 | 0.854 |
| Random Forest | 0.778 | 0.932 | 0.778 | 0.838 | 0.886 |
| XGBoost | 0.900 | 0.900 | 0.90 | 0.899 | 0.944 |
Furthermore, an in-depth analysis of the distinct test set originating from Setif's Hospital, comprising instances of pneumococcal Meningitis and tuberculous Meningitis, revealed significant performance metrics for the XGBoost model: (Accuracy: 0.7143, Precision: 1.0, Recall: 0.7143, F1-Score: 0.7857). These results underscore the efficacy of the XGBoost model in precisely categorizing cases within this subset, further affirming its robust performance across specific meningitis types.
Figure 3 shows ROC curves and AUC calculations for meningitis classes to compare the classification performance for each class. Therefore, we selected the XGBoost model as the optimal choice for our classification task due to its superior performance. To provide an in-depth understanding of the XGBoost model and the factors driving its excellent performance, we further delve into its interpretability in section 3.4. By utilizing Shapley values, we explore the contributions of individual features towards the model's predictions, unraveling the key insights and highlighting the factors that significantly influence the classification outcomes. This interpretability analysis enhances our understanding of the inner workings of the XGBoost model, shedding light on its decision-making process and reinforcing our confidence in selecting it as the optimal choice for our classification task.

Figure 3. Area under the receiver operating characteristic curve (AUROC) of our multi-Class XGBoost model on validation data.
Download figure:
Standard image High-resolution image4.2. XGBoost Global interpretability
In our study, we primarily focused on specific classes of Meningitis, namely meningococcaemia, meningococcal Meningitis, Tuberculous Meningitis, Aseptic Meningitis, H. influenzae Meningitis, and Pneumococcal Meningitis. To gain insights into the predictive performance of our XGBoost model, we generated a summary variable importance plot (figure 4).

Figure 4. Variables importance plot for XGBoost classifier. This figure illustrates the contribution of each feature to the model's output on average. The importance of each feature is determined by its mean absolute SHAP value across all samples. The features are ranked based on the sum of SHAP value magnitudes over all samples.
Download figure:
Standard image High-resolution imageOur analysis reveals that several features, including Neutrophils and Lymphocytes level, WCC, Protein and Glucose ratio, the presence of Petechiae/Haemorrhagic suffusion, along with signs of vomiting and neck stiffness, as well as the identification of Gram-negative diplococci in CSF bacterioscopy and S. pneumoniae in CSF culture, are among the most influential factors affecting the model's predictions.
Furthermore, we observed that the level of Neutrophils hardly influences the classification of H. influenzae meningitis, Aseptic Meningitis, and Meningitis by other bacteria. WCC has the most significant influence on Meningococcal and Tuberculosis meningitis. We found that the presence of Petechiae/Haemorrhagic suffusion signs hardly influences the classification of Meningococcaemia. These findings align with the existing literature, which recognizes petechial purpuric exanthema as a classic sign of meningococcemia, present in approximately 40%–80% of cases [39].
Glucose ratio substantially impacts Aseptic Meningitis, while Protein ratio has a greater influence on Tuberculosis meningitis. Lymphocytes have a more significant impact on Pneumococcal and Aseptic meningitis cases. The figure shows that Neisseria meningitidis, and Gram-negative diplococcus in CSF are associated with invasive meningococcal disease [40] along with neck stiffness.
The Murky aspect of the CSF has the most impact on H. influenzae meningitis and Pneumococcal cases. Additionally, the presence of S. pneumoniae in CSF culture has the most impact on Pneumococcal meningitis cases. Furthermore, vomiting has a more pronounced effect on H. influenzae Meningitis than on the other meningitis types.
4.3. Features impact on the Meningitis diagnosis outcome
The Global Interpretability results (section 4.2) demonstrate that our diagnosis outcomes typically align with expert knowledge. We provide additional diagrams constructed to depict the feature's importance and effect on each diagnosis outcome of Meningitis type (see figure 5).

Figure 5. SHAP diagram illustrating the feature scaling and its corresponding impact on different types of Meningitis (Mingococcaemia, Meningococcal Meningitis, Tuberculous Meningitis, Aseptic Meningitis, H. influenzae Meningitis, and Pneumococcal Meningitis). The diagram highlights the influence of each feature on the prediction of each specific Meningitis type, providing insights into the relative importance of different factors in the diagnostic process.
Download figure:
Standard image High-resolution imageNotably, as shown in figure 5(a), our findings emphasize the significance of petechiae/hemorrhagic suffusion as the most influential feature, increasing the likelihood of meningococcemia. This observation aligns with clinical reports, where this symptom is detected in approximately 50%–60% of patients, strongly associating it with the disease. In cases of meningococcemia, confirmation of the diagnosis involves detecting the presence of Neisseria meningitidis in blood cultures [41]. The strong positive impact of finding this organism in blood cultures significantly increases the probability of meningococcemia for our model.
Moreover, our analysis reveals that clear CSF appearance has a comparatively modest yet positive influence on the model's predictions. We also find that a low WCC, low protein ratio, low neutrophil level, and elevated glucose ratio positively impact the diagnosis of meningococcemia. However, these results deviate from the typical diagnostic characteristics of the condition, characterized by an elevated WCC count in CSF, increased protein levels, low glucose levels, and gram-negative diplococcus. Further research is essential to reconcile these disparities and gain a comprehensive understanding of the diagnostic indicators for meningococcemia.
The CSF analysis is instrumental in diagnosing meningococcal Meningitis, encompassing vital parameters like Gram stain, culture, glucose and protein levels, and cell count. Notably, CSF findings indicative of bacterial Meningitis frequently include low glucose and elevated protein levels. In some instances, Gram stains may reveal the presence of Gram-negative diplococci [42]. The presence of neutrophils in CSF is a crucial indicator of a bacterial origin of the Meningitis.
Our analysis, represented in the beeswarm plot for Meningococcal Meningitis (figure 5(b)), highlights noteworthy patterns. Specifically, higher values of Gram-negative diplococci, signifying their presence, result in positive SHAP values. This implies that the absence of this bacterial type in CSF bacterioscopy corresponds to a lower predicted Meningococcal meningitis class. In essence, detecting these bacteria in CSF bacterioscopy is a robust indicator of a meningococcal meningitis diagnosis [42]. A similar trend is observed for detecting Neisseria meningitidis in blood culture. Furthermore, 'no agent' in the PCR test aligns with the absence of viral agents as the causative factor in meningococcal Meningitis. Additionally, our findings demonstrate that higher Glucose ratio values yield negative SHAP values, while lower values correspond to positive SHAP values. This pattern also extends to the age attribute. In contrast, the Protein ratio and Neutrophils level exhibit the opposite effect.
Our findings are consistent with these clinical observations and diagnostic standards. Common symptoms of meningococcal Meningitis often involve a stiff neck, reduced cognitive function, and other signs of meningeal inflammation.
Protein ratio, WCC, and Neutrophil levels significantly influence the diagnosis of tuberculous Meningitis. Elevated WCC, Neutrophils, and glucose levels negatively impact the prediction of this class. In contrast, high Lymphocyte level and protein ratio contribute positively to diagnosing tuberculous Meningitis. Shap values also indicate that the presence of the BCG vaccine feature affects the model's predictions for tuberculosis meningitis. This vaccine consistently protects against the most severe forms of TB, including TB meningitis in children [43]. However, its effectiveness in preventing tuberculosis in adults is comparatively lower.
Figure 5(c) demonstrates that vomiting and neck stiffness signs negatively affect the diagnosis of tuberculous Meningitis. Tuberculous Meningitis is frequently observed in patients with tuberculosis and/or HIV/AIDS, either as a new occurrence of the disease or as a consequence of a prior tuberculosis infection. In cases of co-occurring tuberculosis and HIV, patients may currently have tuberculosis, indicating a co-infection, or have a history of tuberculosis. Although our dataset lacks specific information on the causative agent, these observations align with the well-established understanding that tuberculous Meningitis is primarily caused by Mycobacterium tuberculosis. It is essential to consider these factors when diagnosing patients with suspected tuberculous Meningitis.
Aseptic Meningitis is a condition characterized by negative bacterial cultures of CSF and can be caused by various aetiologies [44]. It is commonly, associated with viral Meningitis or prior antibiotic usage. Our analysis (figure 5(d)) has revealed factors that positively correlate with diagnosing aseptic Meningitis. These include elevated levels of glucose and lymphocytes in the CSF, along with negative results in culture and latex tests for bacterial agents. Conversely, a diagnosis of aseptic Meningitis has been associated with lower levels of neutrophils and reduced protein levels in the CSF. The presence of seizures and neck stiffness positively predicts this particular outcome.
The diagnosis of H. influenzae meningitis relies on a combination of clinical manifestations and specific diagnostic investigations, including laboratory testing and CSF analysis. In cases of H. influenzae meningitis, the CSF often appears cloudy or turbid (murky) and contains an increased number of white blood cells, primarily neutrophils. Our Shapley value analysis (figure 5(e)) reinforces these findings, highlighting that high neutrophil values, relatively elevated WCC, and a cloudy CSF appearance positively influence the prediction of the target class. Confirmation of the presence of H. influenzae type b (Hib), the most common causative organism, can be achieved through Gram staining and bacterial culture of the CSF. H. influenzae infections are most prevalent at the extremes of age, affecting infants, young children, and older adults. However, due to specific vaccines, the incidence of H. influenzae infections has significantly decreased in the general population. Nevertheless, it is still observed in patients aged 65 and older with underlying conditions. The dataset used for this analysis consists of medical records and clinical data from individuals aged 18 years and older. This age range was chosen to focus on the adult population and provide insights into CSF profiles in cases of Haemophilus meningitis. Our analysis further confirms that the presence of H. influenzae, as indicated by culture results, is a positive factor in diagnosing Haemophilus meningitis.
Pneumococcal Meningitis is often marked by a cloudy appearance of the CSF, elevated white blood cell count with a predominance of neutrophils, a substantial reduction in glucose levels, occasionally reaching near zero, and high protein levels within the CSF. Moreover, CSF bacterioscopy and LATEX tests can confirm the presence of S. pneumoniae, the bacteria responsible for pneumococcal Meningitis. Our analysis (figure 5(f)) reaffirms the typical diagnostic indicators of pneumococcal Meningitis. This includes the positive influence of a cloudy/Murky appearance of the CSF and decreased glucose levels on predicting the disease. Furthermore, the presence of Gram-positive cocci and Gram-positive diplococci in CSF bacterioscopy strongly contributes to diagnosing pneumococcal Meningitis. Consistent with these findings, identifying S. pneumoniae through culture and LATEX tests further supports the diagnosis of Pneumococcal Meningitis.
4.4. Influence of neutrophil and lymphocyte levels on Meningitis predictions
Figure 6 illustrates the SHAP dependence plot, offering insights into the impact of Neutrophil and Lymphocyte levels on the model's predictions. It provides a clear visualization of how changes in these specific biomarkers impact the predictive outcome of the model. We focused our analysis on cases of meningococcal Meningitis, tuberculosis meningitis, aseptic Meningitis, and H. influenzae meningitis, as these categories displayed distinct interaction patterns with these features.

Figure 6. Visualizes Neutrophil and Lymphocyte levels' influence on predicting outcomes for meningococcal Meningitis, tuberculosis meningitis, aseptic Meningitis, and H. influenzae meningitis.
Download figure:
Standard image High-resolution image
Analysis shows a common trend in the dependence plots, characterized by a monotonically increasing curve for meningococcal and H. influenzae Meningitis. This suggests that changes in these features significantly affect the model's predictions, as evidenced by the positive Shapley values.
We further identified specific ranges where variations in neutrophil and lymphocyte levels substantially impacted the predictions. This range typically falls within the  40%
40%
Similarly, for H. influenzae meningitis, we observed a monotonic increasing pattern, particularly with a strong predominance of neutrophils. However, a significant threshold effect becomes evident when neutrophil levels reach approximately 80%, resulting in a noticeable and substantial increase in Shapley values. This highlights the impact of neutrophils on the model's predictions for both types of Meningitis.
Conversely, Tuberculous and Aseptic meningitis exhibited a typical pattern characterized by a monotonically decreasing curve. Positive Shapley values in Tuberculous Meningitis were associated with neutrophil levels below 60% and high lymphocyte levels above 60%, signifying their influence on the model's predictions. In contrast, Shapley values consistently remained below 0 for Aseptic Meningitis, primarily for neutrophil levels around 40%
5. Discussion
Our research focused on applying ML techniques to diagnose various types of acute Meningitis. ML algorithms analyze large volumes of biomedical laboratory testing, clinical symptoms, or clinical records, enabling the identification of intricate disease patterns [45]. We have applied three tree-based decision models, and the XGBoost classifier outperformed the others, achieving 90% accuracy and a 94% AUROC. Through a comprehensive analysis using the SHAP technique, we identified key diagnostic indicators for different meningitis types, shedding light on the significance of specific clinical signs and laboratory biomarkers.
The results of the Global Interpretability (see section 4.2) demonstrate that our diagnosis outcomes typically align with expert knowledge. The identified diagnostic indicators can aid healthcare professionals in making more precise and timely diagnoses and reinforce confidence and effectiveness in integrating AI-driven techniques into clinical practice. This can improve patient outcomes and reduce misdiagnoses, as early intervention for Meningitis diagnosis is crucial. Furthermore, we provide additional diagrams to depict the features' importance and effect on each diagnosis outcome of Meningitis type.
Our analysis identifies vital diagnostic indicators for various forms of Meningitis. Notably, petechiae/hemorrhagic suffusion is a significant predictor for meningococcemia (see figure 5(a)), while other factors exhibit distinctive patterns involving clear CSF appearance and specific biomarkers. Also, the presence of Gram-negative diplococci and Neisseria meningitidis, as shown figure 5(b), strongly supports the diagnosis of meningococcal meningitis [42], with specific biomarkers exhibiting contrasting effects. Tuberculous Meningitis is significantly influenced by attributes such as protein ratio, WCC, Neutrophils, Lymphocytes, and the presence of the BCG vaccine. Aseptic meningitis diagnosis (see figure 5(d)) correlates with elevated glucose and lymphocyte levels, negative culture and latex tests, low neutrophil levels, and reduced protein levels, with seizures and neck stiffness contributing positively. H. influenzae meningitis diagnosis is associated with high neutrophil values, elevated WCC, and a cloudy CSF appearance, with the presence of H. influenzae in culture positively influencing the diagnosis (see figure 5(e)). Pneumococcal meningitis diagnosis is characterized by a cloudy CSF appearance, low glucose levels, the presence of Gram-positive cocci in CSF bacterioscopy, and the identification of S. pneumoniae (figure 5(f)).
To gain deeper insights into the influence of specific biomarkers on the predictive outcomes of our model, we focused on studying the impact of Neutrophil and Lymphocyte levels. We identified distinct ranges where variations in these biomarkers significantly affected the model's predictions. For meningococcal Meningitis, Neutrophil levels above 40% and Lymphocyte levels between 40%–60% notably influenced the model's outcomes. Similarly, in the case of H. influenzae meningitis, Neutrophil predominance is observed with a significant threshold effect when it reaches 80%. This highlighted the critical role of Neutrophils in predicting both types of Meningitis. The case of Tuberculous and Aseptic meningitis showed a common decreasing pattern of Shapley values. For Tuberculous Meningitis, Neutrophil levels below 60% and high Lymphocyte levels above 60% were associated with positive Shapley values. Conversely, Aseptic Meningitis consistently had Shapley values below 0, primarily when Neutrophil levels were around 40% and Lymphocyte levels were below 50%–60%.
While our study draws on a substantial dataset and has undergone rigorous validation, it is important to acknowledge several limitations. The fact that interpretability lacks standard evaluation metrics makes it challenging to quantify and compare interpretability across different models.
6. Conclusion
One crucial aspect of clinical reasoning is differential diagnosis, where a list of potential problems causing a patient's signs and symptoms is developed. This process allows for a thorough investigation to rule out possibilities and confirm an accurate diagnosis. However, losing follow-up on investigations and patients leads to diagnostic delays or misdiagnoses. In this work, we developed an explainable AI automatic medical decision approach to highlight the importance of specific features in accurately diagnosing different types of Meningitis. The XGBoost model demonstrates a vital accuracy of 0.90 and AUROC of 0.944. We performed an evaluation test using collected data from Setif's hospital in Algeria to assess the model's efficiency in handling diverse and unseen real-world instances. The test set includes instances of pneumococcal Meningitis and tuberculous Meningitis and reveals notable performance metrics for the XGBoost model: (Accuracy: 0.7143, Precision: 1.0, Recall: 0.7143, F1-Score: 0.7857). To enhance our model's trustworthiness, we delve deeper into its workings using SHAP. SHAP helps us break down the model's output by assessing the impact of each feature. This allows us to comprehend the significance of each feature, facilitating clear explanations to medical practitioners, aiding in their decision-making process, and ensuring consistent and reliable results. Our study identified critical biomarker ranges for meningitis diagnosis. For meningococcal Meningitis, Neutrophil levels  40% and Lymphocyte levels 40%–60% were influential. H. influenzae meningitis was associated with Neutrophil predominance, specifically when reaching 80%, highlighting Neutrophils' significance. Positive Shapley values were associated with Neutrophil levels approximately
  60% and Lymphocyte levels
  60% in Tuberculous Meningitis. Conversely, Aseptic Meningitis consistently had Shapley values below 0 when Neutrophil levels were around 40% and Lymphocyte levels were
  50%–60%.
By understanding the relative influence of these factors, healthcare professionals can improve diagnostic accuracy and optimize treatment strategies. Our model utilizes accurate and relevant attributes with close resemblance to clinical standards. While most attributes align with these standards, we have also uncovered some disparities that highlight the need for further investigation to understand the diagnostic indicators of meningitis classes better and reconcile the differences between our findings and the expected characteristics.
7. Future directions
Despite our study benefiting from a significant dataset and rigorous external validation, it is crucial to recognize several limitations. Notably, the absence of standardized evaluation metrics for interpretability poses challenges in quantifying and comparing interpretability across different models. Furthermore, our training set solely originates from a single country, focusing exclusively on the adult population. This limitation may restrict the generalizability of our models, as meningitis diagnosis and characteristics can vary significantly across diverse geographical regions and populations. To address this issue, we plan to expand the dataset collection globally, collaborate internationally for diverse data, and ensure adaptability to different healthcare systems and diagnostic practices. Furthermore, we aim to leverage external expertise through expert evaluation to validate the explanations provided by the model, ensuring alignment with domain-specific knowledge and expectations. Moreover, we plan to conduct validation studies across different populations to enhance model applicability on a broader spectrum of cases and diagnostic patterns and practices.
Data availability statement
The data from Setif's Hospital cannot be made publicly available upon publication due to legal restrictions preventing unrestricted public distribution. The data that support the findings of this study are available upon reasonable request from the authors.
The SINAN database can be accessed at https://datasus.saude.gov.br/transferencia-de-arquivos/# [30].
Code availability
Code is available on request.
Conflict of interest
The authors declare that they have no conflict of interest.
Funding source
There was no funding for this research.